
🎧 Morning Brief #187- audio debate on today’s market setup
Bitcoin price has corrected by 20% over the past month, and two independent on-chain indicators are converging at the same point. The market has been realizing net losses for a third straight week, while the MVRV Z-Score has dropped deep into the cold zone, well below its historical average.
TL;DR
The market has been realizing losses for 22 straight days, while the MVRV Z-Score shows that Bitcoin is sitting near the zone of deep capitulation. Stress remains, but it is developing from an already cooled valuation of the leading cryptocurrency.
Bitcoin MVRV Z-Score
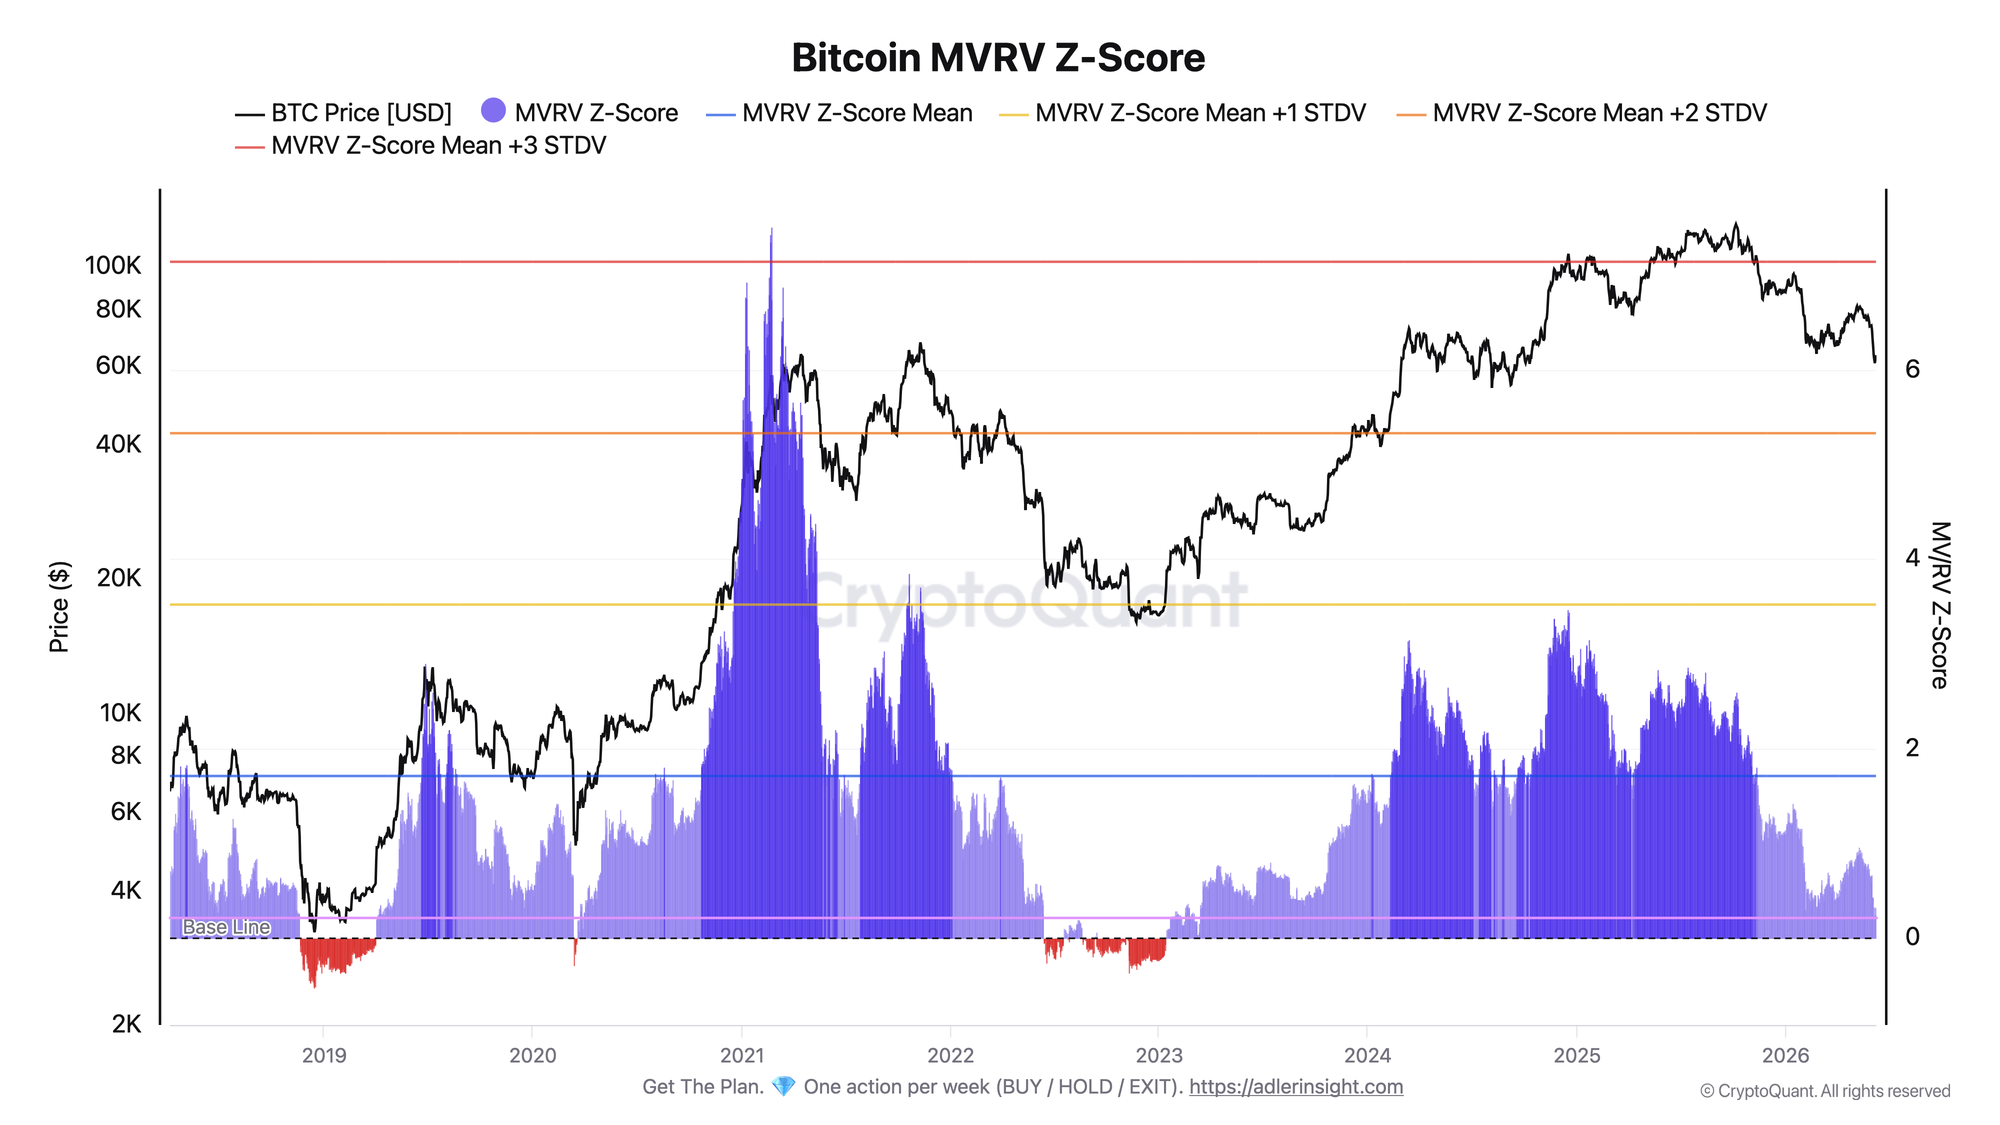
The metric shows the ratio of market value to realized value in standard deviation units. The upper bands mark zones of market overheating.
The MVRV Z-Score has fallen to 0.32 and remains far below its historical average of 1.71, not to mention the upper +1, +2, and +3 STD zones. Over the past month, the indicator declined from 0.95 to current levels alongside the price correction. The metric remains positive, meaning the market is not yet in a zone of deep undervaluation, but the valuation premium has been almost fully washed out. The indicator is sitting in the lower half of its range, which has historically been more favorable for accumulation.
By this metric, the market can no longer be called expensive: there is no overheating premium left. The trigger for deterioration would be a move below zero, into the zone of capitulation and deep undervaluation. The trigger for improvement would be a return above the historical average and the ability to hold there.
Bitcoin Net Realized Profit/Loss
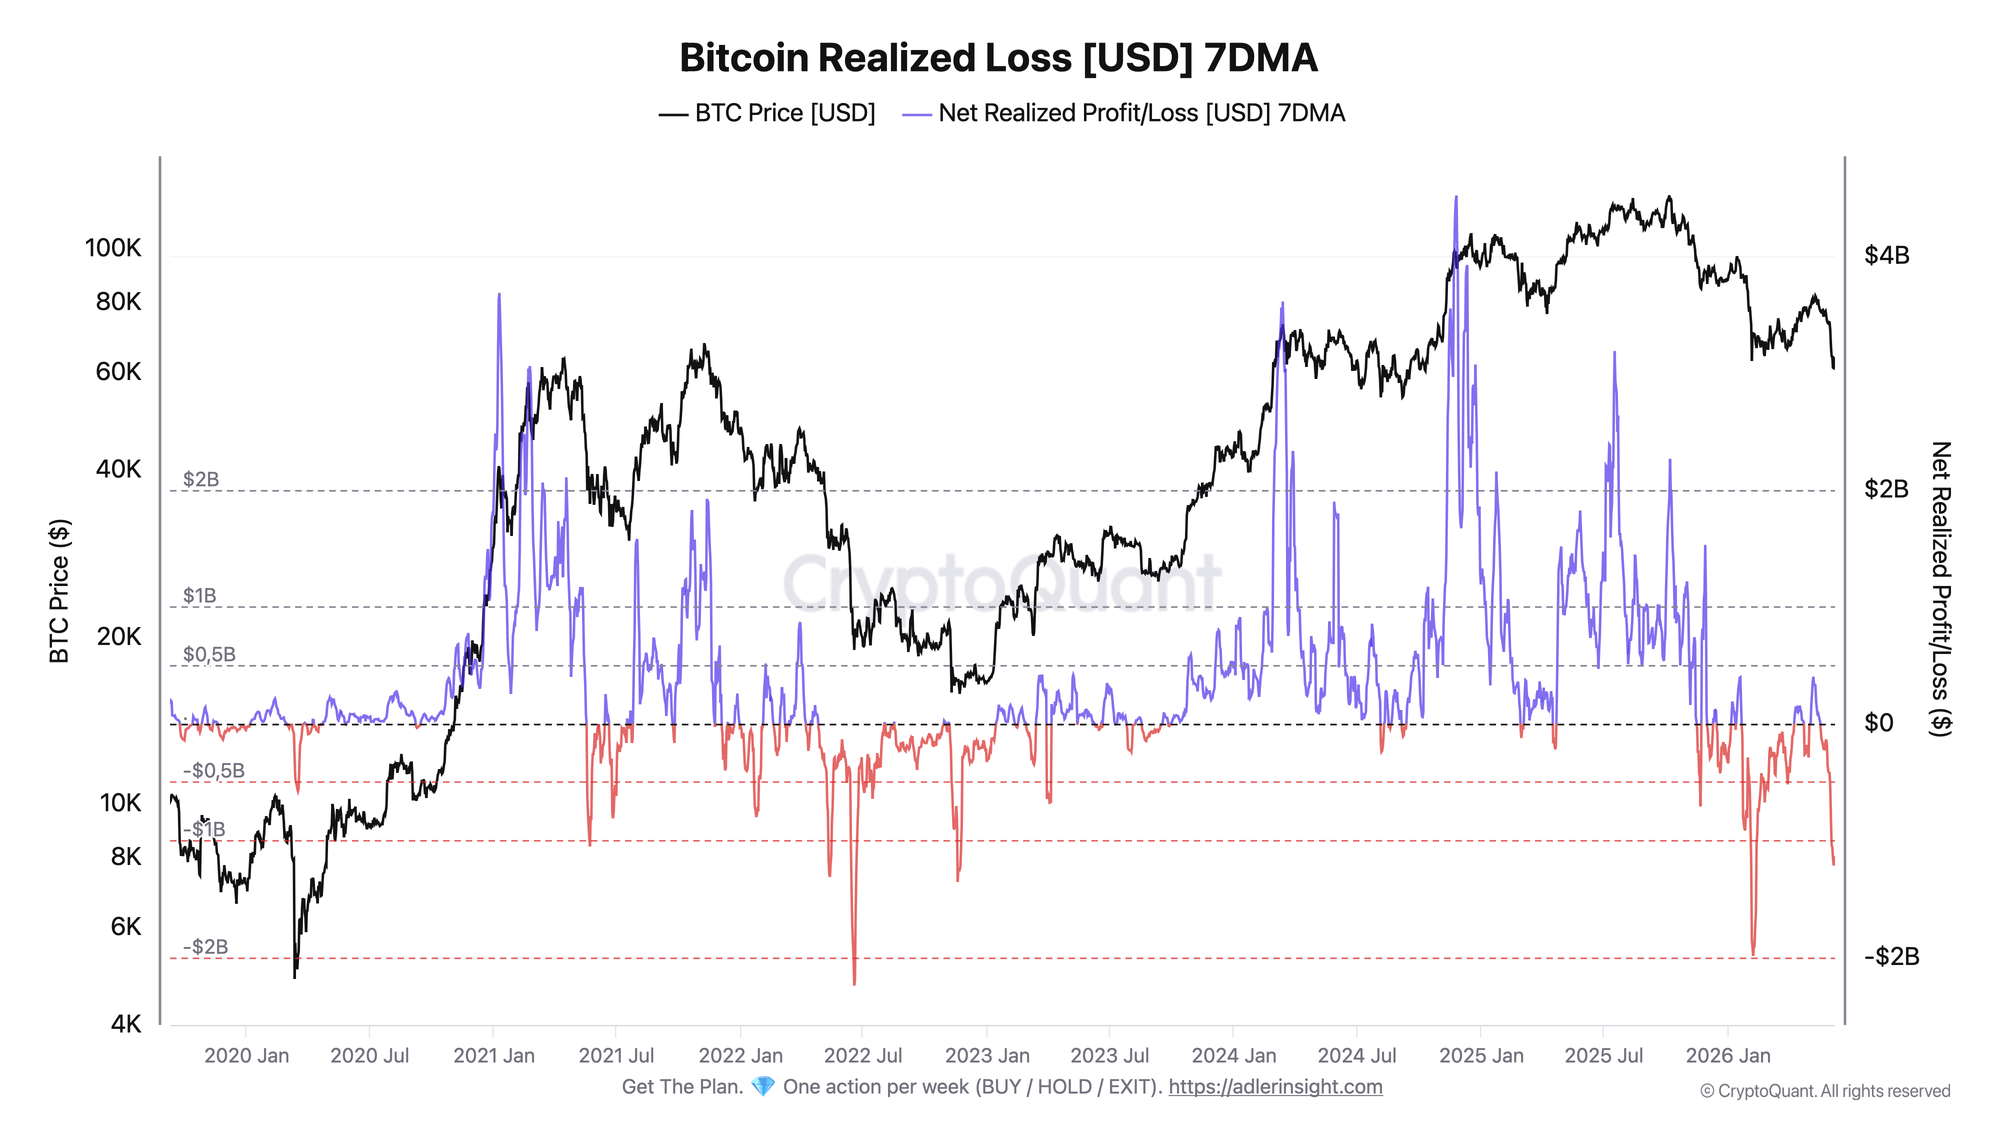
Bitcoin Net Realized Profit/Loss 7DMA - negative values mean that realized losses exceed realized profits.
The indicator has remained in negative territory for 22 straight days, starting on May 18: loss realization is dominating across the network. The low was reached on June 6 at -$1.2 billion, and the value has now recovered slightly to around -$1.1 billion. For context, this is roughly half of the 2022 capitulation extreme of -$2.2 billion. Stress is pronounced, but the market has not yet reached a historical bottom in terms of the depth of realized losses.
Holders are, on average, selling below their entry price. This confirms stress: part of the market is no longer waiting for recovery and is closing positions at a loss. Confirmation of stabilization would be a return of the metric to zero and above.
The two charts refine each other: realized losses capture weak sentiment, while the cooled MVRV Z shows that this weakness is unfolding from a discounted valuation.
FAQ
What do 22 straight days of net realized losses mean? It means that sales below the purchase price are dominating across the network, while the aggregate realized result has remained negative for nearly three weeks. This kind of behavior is typical of stress and capitulation phases, when holders surrender their positions.
What MVRV Z-Score level would confirm a regime change? A move below zero would signal a transition into a zone of deep undervaluation and a risk of further capitulation. A confident return above the historical average around 1.71 and the ability to hold there would be a constructive signal of valuation recovery.
CONCLUSIONS
Realized losses for 22 straight days confirm weak sentiment and selling pressure, but an MVRV Z reading of 0.32 shows that Bitcoin valuation has cooled. The discount itself is the constructive part of the picture.
The main trigger for improvement is a return of Net Realized P/L to zero and above while MVRV Z holds in positive territory. The main risk is a renewed deepening of realized losses toward the extremes of 2022 and a break of MVRV Z below zero.
Live Charts
Explore the metrics behind this brief with live, auto-updating charts:
MVRV Ratio — Market value vs realized value to identify valuation regimes and cycle risk.
SOPR — Spent Output Profit Ratio shows whether moved coins realize profit or loss.
Realized Price — Aggregate on-chain cost basis compared with BTC price and long-term trend.
NUPL — Net unrealized profit/loss across holders, mapped into cycle sentiment phases.
STH-SOPR — Short-term holder profit/loss behavior around the 1.0 breakeven threshold.