
🎧 Morning Brief #188 - audio debate on today’s market setup
Realized Cap is contracting at a pace the market has not seen since March. At the same time, aSOPR has remained below 1 for 13 straight days - market participants are locking in losses on nearly every sale. Two independent indicators are pointing to the same regime: capitulation.
TL;DR
Capital is leaving the Bitcoin network, and participant behavior confirms a capitulation regime - sales are being made at a loss. This brief examines how close the current stress is to the March extremes and what needs to happen for the regime to change.
Bitcoin: Realized Cap Net Position 30D Change (%)
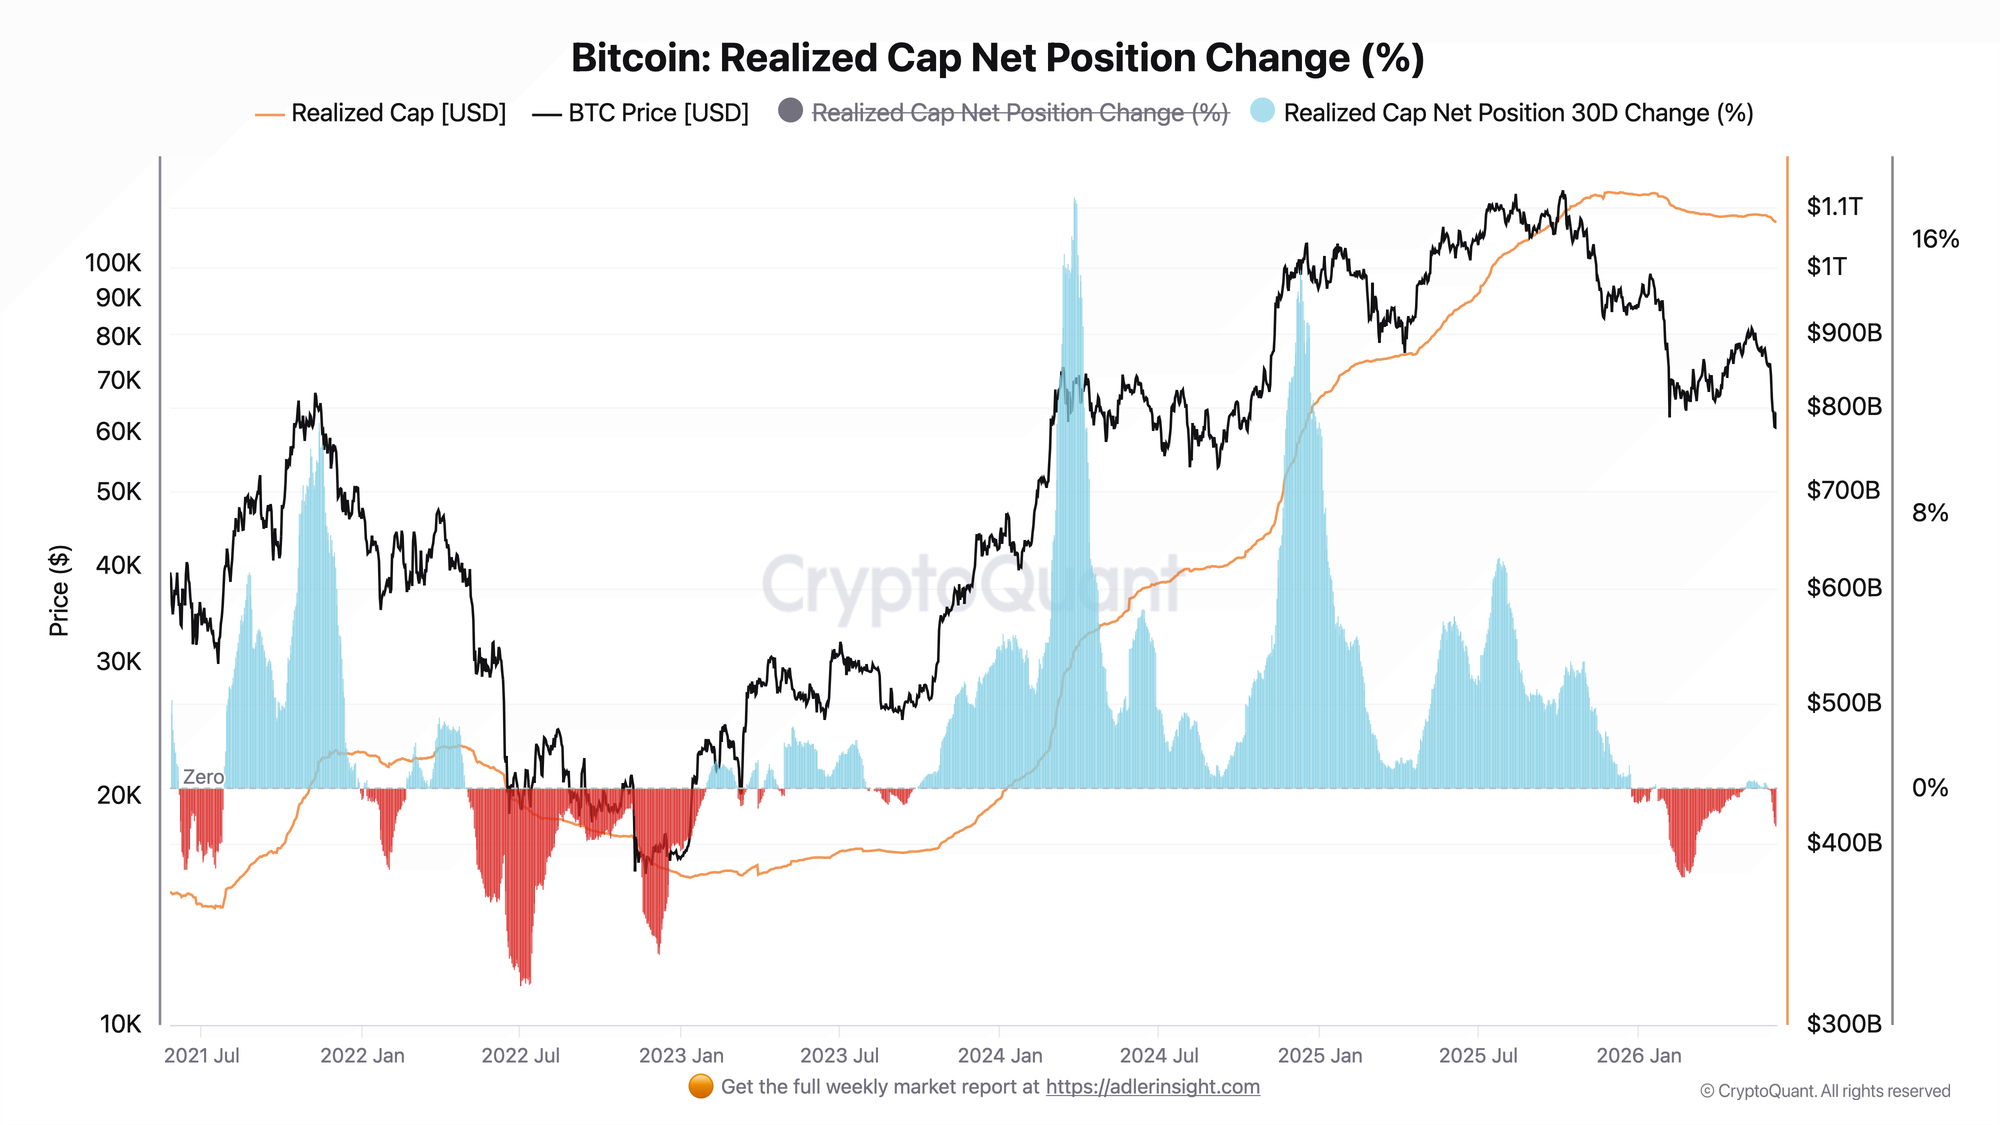
Realized Cap is the aggregate value of all coins priced at the level of their last movement. Its 30-day change helps show whether new capital is entering the network or whether capital continues to leave.
The indicator fell to -1.1% - the first time since mid-March that capital outflows have reached this level. From its mid-May peak of around $1.087T, Realized Cap declined by roughly $12B to $1.075T. The pace of contraction has accelerated noticeably: as recently as June 1, the indicator stood at -0.15%, and by June 8 it had dropped to -1.1%. Over the same period, BTC price fell from $82K to $63K, a decline of 23%.
The current pace of outflows is already comparable to the beginning of the March capitulation, when the indicator reached -2.4%. That means there is still room for further deterioration. The first positive signal would be stabilization in the 30D Change near zero, followed by a turn upward. Until that happens, the regime remains negative.
Bitcoin: Adjusted SOPR (aSOPR) SMA-30
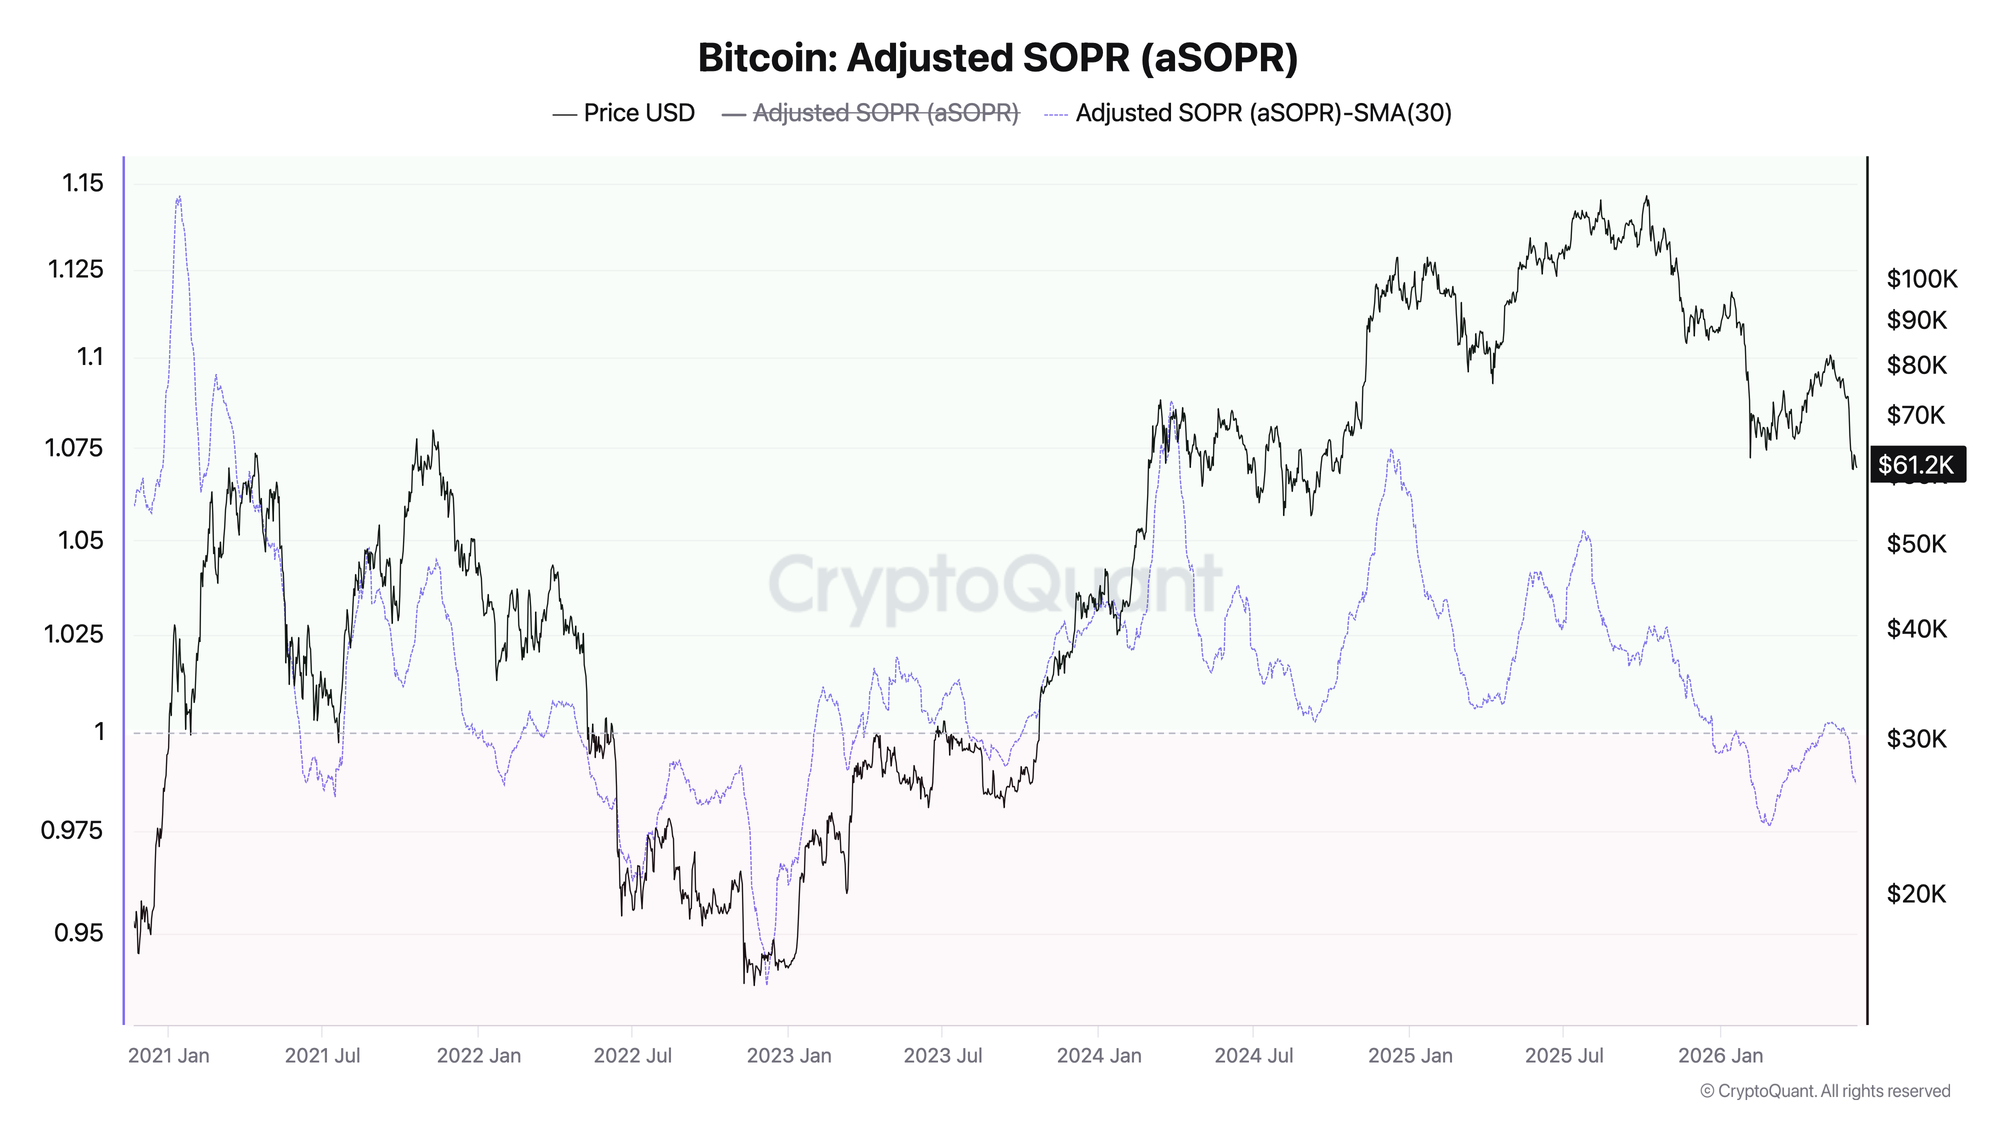
Adjusted SOPR, or aSOPR, shows whether participants are selling coins at a profit (>1) or at a loss (<1). SMA-30 removes daily noise and helps reveal the underlying market regime.
aSOPR SMA-30 broke below the 1.0 level on May 28 and has been declining continuously ever since - it has now stayed below 1 for 13 straight days. The current reading of 0.987 means that, on average, each coin moved is being sold at a loss of about 1.3%. The trend remains steadily downward: from 1.000 at the breakdown threshold to 0.987 without any meaningful bounce.
A prolonged period with aSOPR below 1 is a classic marker of weak hands being flushed out. Until aSOPR turns upward and begins to retest 1.0, sellers remain in control.
Both charts describe the same process from different angles. Realized Cap captures the macro picture - capital is leaving the network. aSOPR shows the internal mechanics of that move - the outflow is being driven not by profit-taking, but by forced selling at a loss. It is precisely this combination - contracting Realized Cap with aSOPR < 1 - that defines a capitulation phase.
FAQ
How dangerous is the current situation compared with March? In March, the 30D Change fell to -2.4%, while the indicator is currently at -1.1%. That means the current stress is roughly half as severe as the March peak. Capitulation is already underway, but there is still room before an extreme is reached. The key question now is whether the outflow will stop at current levels or continue to intensify.
What signal would indicate a regime change? The first signal would be an upward reversal in aSOPR SMA-30 followed by a return to 1.0 - that would show that the wave of loss-taking sales is beginning to fade. At the same time, the 30D Change in Realized Cap would need to stabilize and begin moving back toward zero. Until both signals appear, the regime remains capitulationary.
CONCLUSIONS
Two independent on-chain indicators are synchronously confirming a capitulation regime. Realized Cap has lost $12B from its May highs, while the 30-day pace of outflows, at -1.1%, has returned to a zone of pronounced stress for the first time since March. At the same time, aSOPR has now remained below 1 for 13 days - on average, every sale is locking in a loss, while selling pressure remains in place. Positioning: the main trigger for a regime change is a reversal in aSOPR above 1.0 alongside stabilization in Realized Cap outflows. The main risk is a deepening of outflows toward the March extremes, around -2.4%, which would signal a second wave of capitulation and stronger pressure on price.
Live Charts
Explore the metrics behind this brief with live, auto-updating charts:
SOPR - Spent Output Profit Ratio shows whether moved coins realize profit or loss.
STH-SOPR - Short-term holder profit/loss behavior around the 1.0 breakeven threshold.
MVRV Ratio - Market value vs realized value to identify valuation regimes and cycle risk.
NUPL - Net unrealized profit/loss across holders, mapped into cycle sentiment phases.
Realized Price - Aggregate on-chain cost basis compared with BTC price and long-term trend.