
The current Bitcoin drawdown from the October 2025 peak remains historically shallow. Two charts today show how this cycle still differs from previous bear markets and where price sits relative to fundamental on-chain valuation.
TL;DR
This brief examines the depth of the current correction in the context of historical bear market drawdowns and evaluates price position relative to the CVDD model. The logic: if market structure has changed due to ETF inflows, deep drawdowns of past cycles may not repeat - but too little time has passed for conclusions.
Bitcoin Bear Market Correction Drawdowns
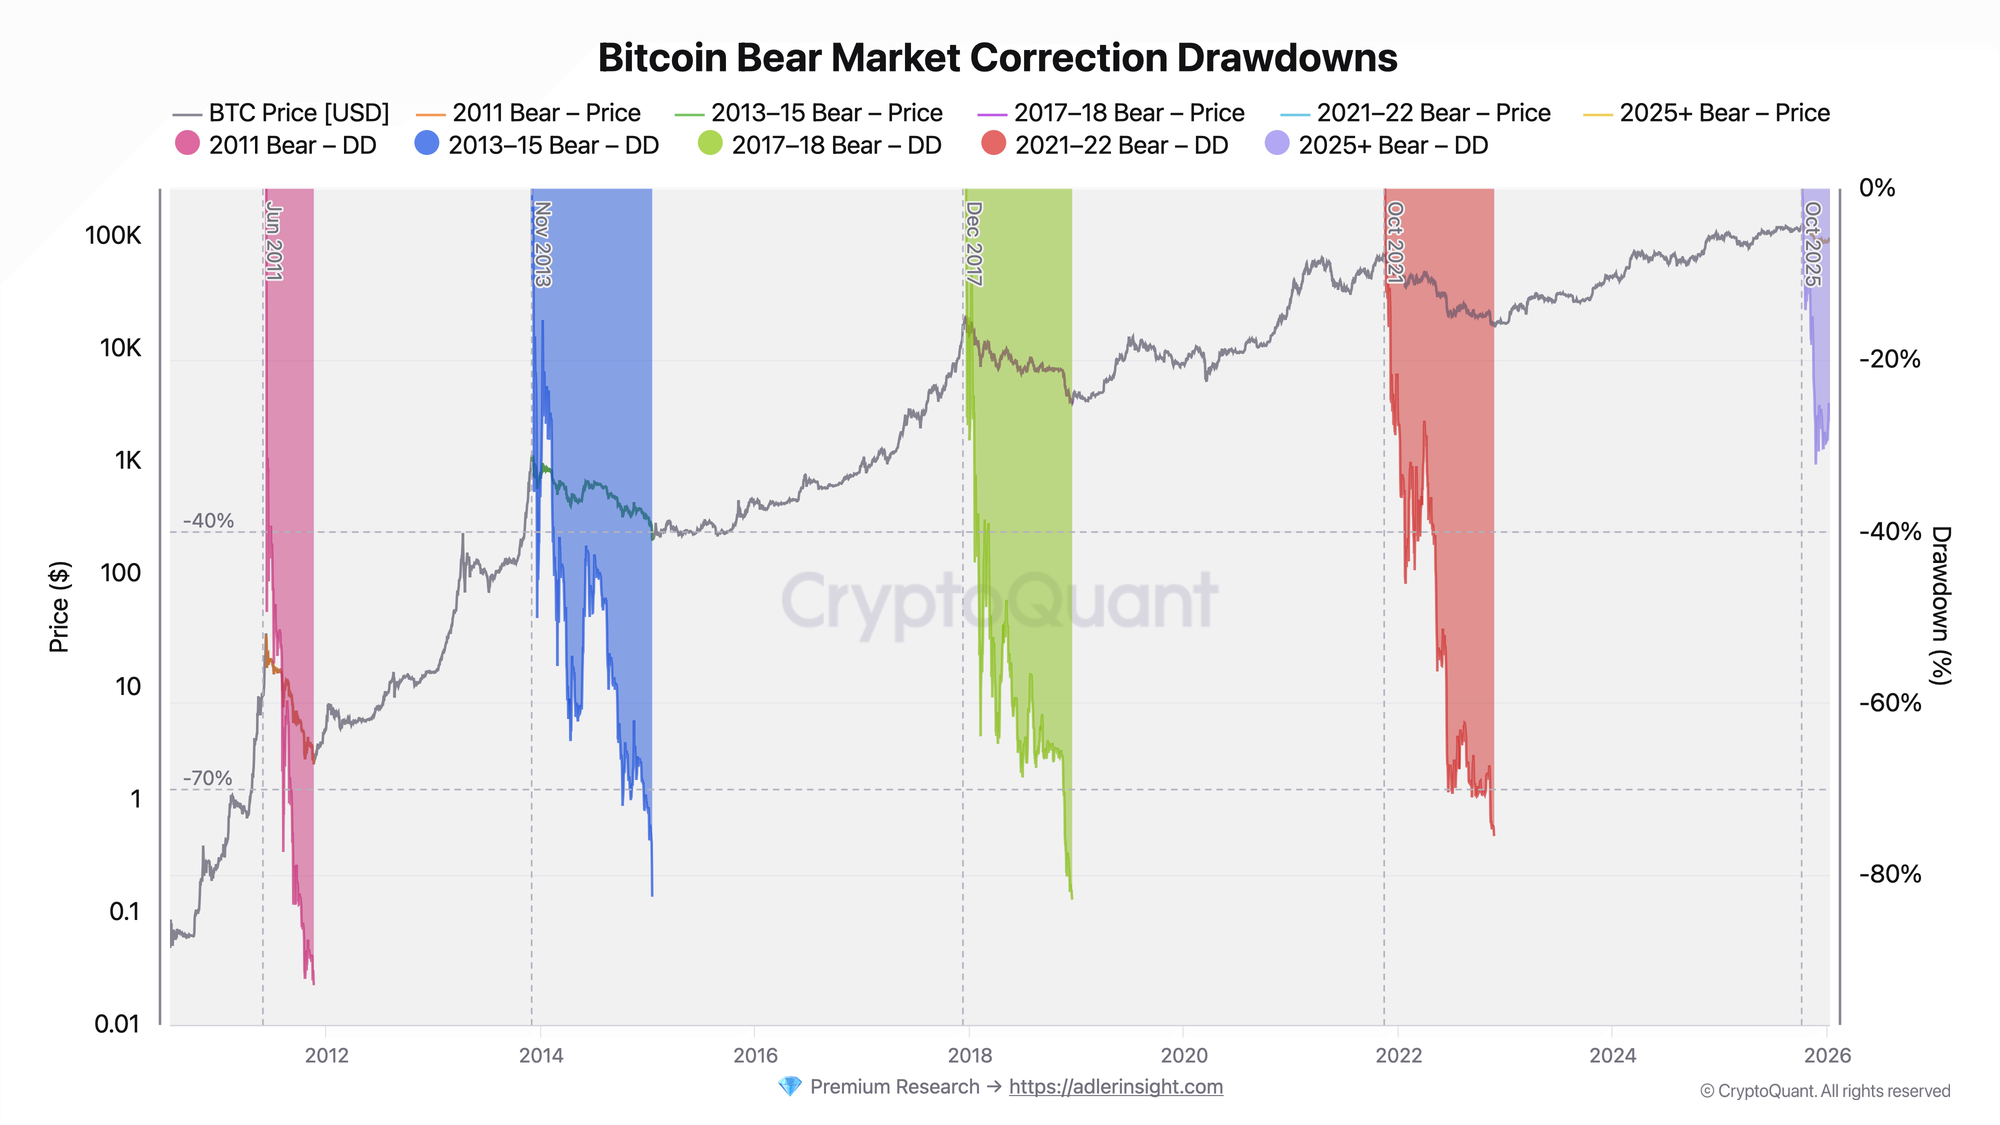
The metric displays the percentage drawdown from each cycle's local maximum (right axis) against a logarithmic price chart.
The current 2025+ cycle drawdown stands at approximately −27%, with the cycle maximum reaching −33% from the October peak. For comparison: the 2011 bear market reached −92%, the 2013–15 and 2017–18 cycles showed drawdowns of up to −82%, and the 2021–22 cycle dropped to −75%. The current correction remains the shallowest among all historical bear markets.
This dynamic may indicate structural market change: the presence of spot ETFs and institutional capital potentially smooths volatility. However, too little time has passed since the current bear cycle began to speak of a full paradigm shift.
Bitcoin Cumulative Value Days Destroyed
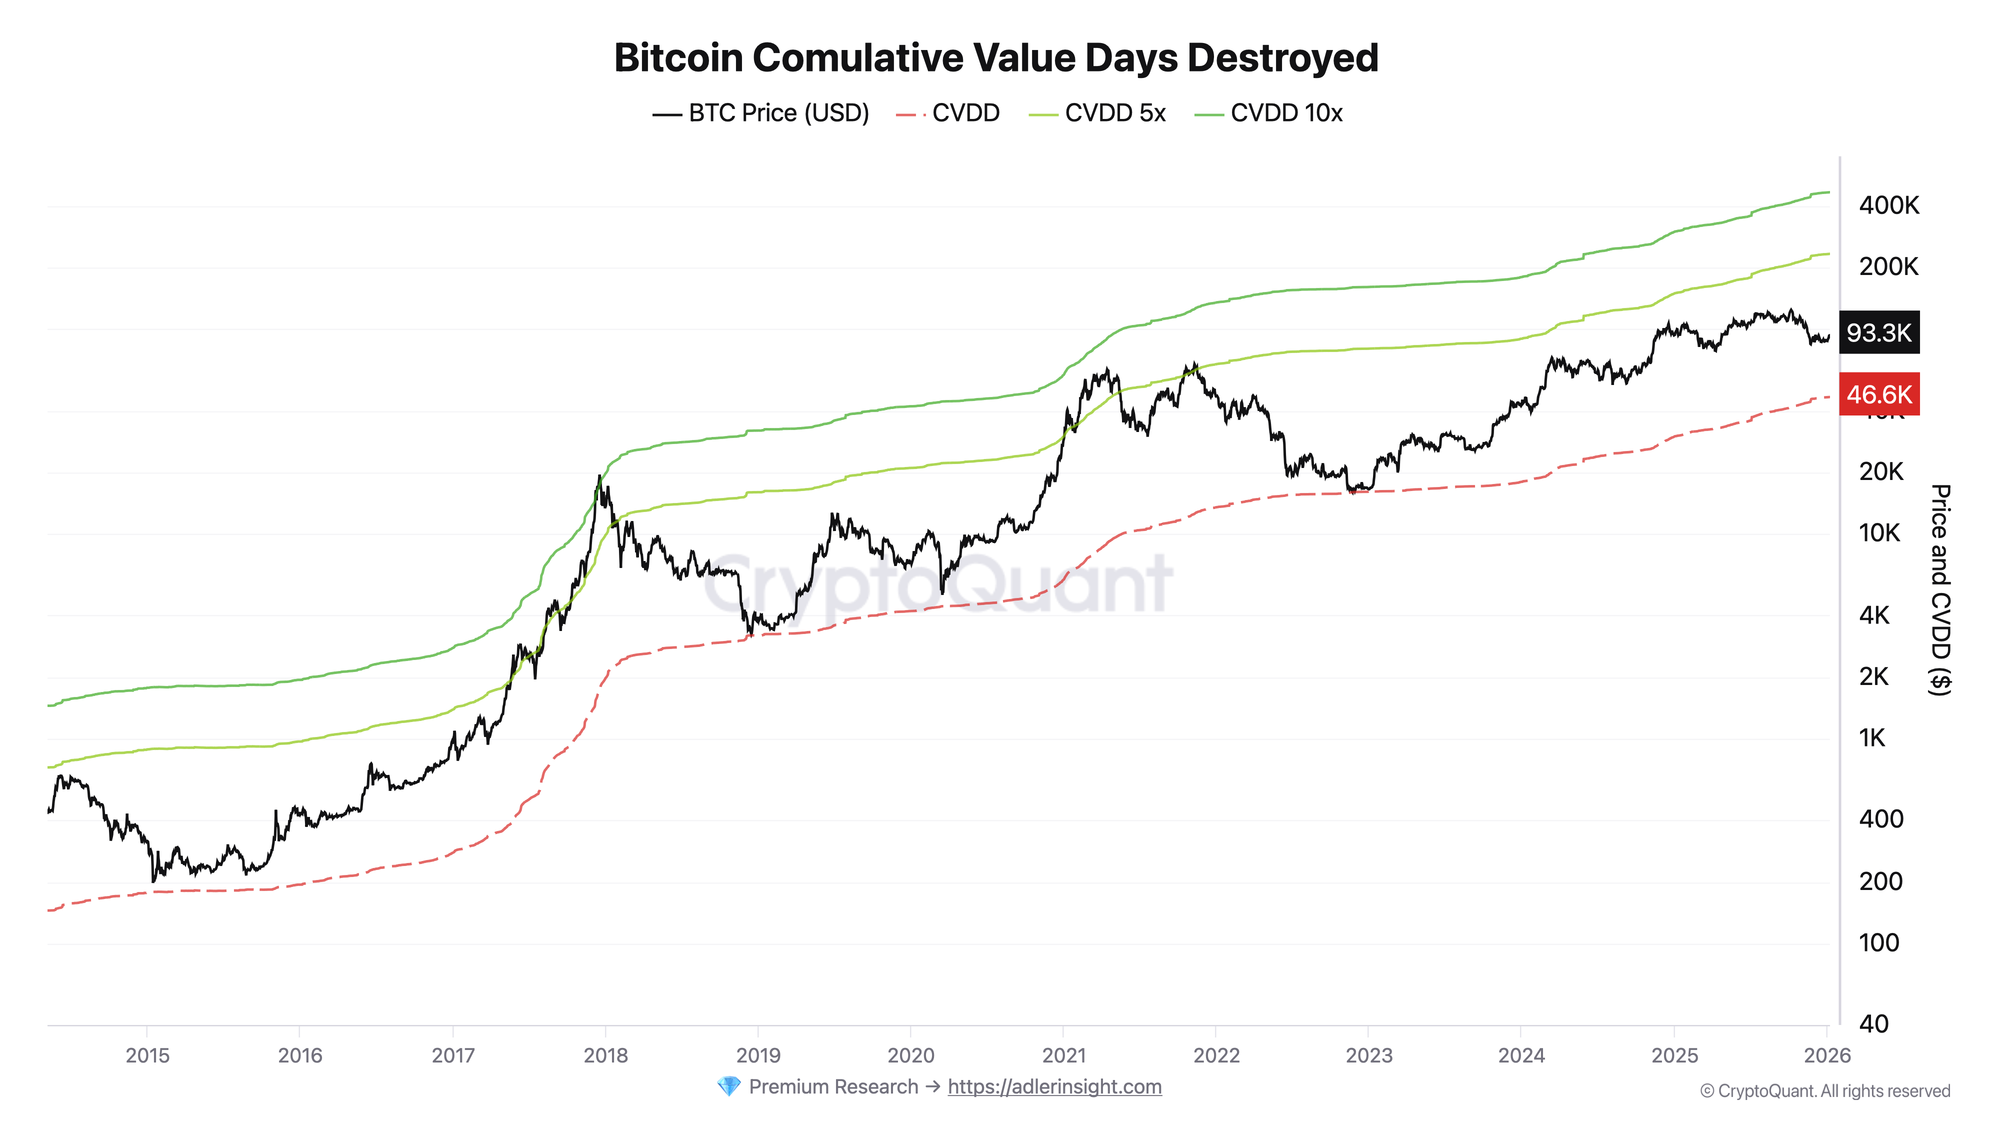
CVDD is a fair value model based on "destroyed" coin days. The chart displays the base CVDD as well as 5x and 10x multipliers.
Bitcoin price (~$91K) trades approximately 2x above the base CVDD ($46.6K). This zone historically corresponds to bear cycle bottom formation. Price position above CVDD confirms the market is not yet in full capitulation mode or deep undervaluation. Base CVDD ($46.6K) serves as long-term fundamental support.
Both charts show that correction is occurring, but its depth and position relative to on-chain fundamentals indicate an early stage of the bear cycle.
This Sunday, the full in-depth Bitcoin market report comes out. It includes:

1) Bitcoin Strategy
Key components: Regime (main filter) → Bitcoin Index Market Phase → Bitcoin Halving Cycles Timing → Point triggers: Bitcoin Advanced Net UTXO Supply → BTC Buy/Sell Index & Risk → Weekly strategy status

2) Market Analysis
Deep market analysis using key on-chain metrics and final market state with forecast for the following week.
3) Adler Insight Light
Adler Insight Light - a one-page weekly brief based on our proprietary models. It aggregates over 50 on-chain and market parameters and uses machine learning-based forecasting.
7-day trial subscribers receive both reports in full. → Subscribe before Sunday
FAQ
Why is the current correction shallower than previous bear markets?
Despite institutional demand through ETFs cushioning selling pressure, too little time has passed for conclusions. The market is in the initial phase of a bear cycle, and drawdown depth may still increase.
What signal would indicate correction deepening to past cycle levels?
The critical threshold is drawdown below -40%, where intermediate supports occurred in previous bear markets. Additional confirmation would be price approaching base CVDD ($46.6K) - this would signal a return to the zone of fundamental undervaluation and potential market bottom.
CONCLUSIONS
The current −27% correction remains historically shallow against −70–84% drawdowns of previous bear markets, and price position at 2x above CVDD confirms the absence of deep stress. However, the early cycle stage doesn't rule out deeper drawdown. The main reassessment trigger is a break below −40% drawdown and/or movement toward base CVDD, the main risk is intensified selling from STH and LTH combined with aggressive bear pressure in the futures market, which would activate the deep correction pattern of previous cycles.