


Bitcoin fell 4.3% over the week, from $86.0K to $82.3K, while forced closures of long positions totaled $520 million over October 2-8. The Bitcoin Stress Index reached the threshold of 49.9, approaching its peaks over the past three months. This was one of the strongest stress episodes since July.
TL;DR
The price decline was accompanied by large long liquidations and an increase in the index to a level comparable to the strongest stress episodes since July. After the sell-off, the index fell to 7. We examine how the scale of forced position closures compares with overall market pressure.
Bitcoin Stress Index
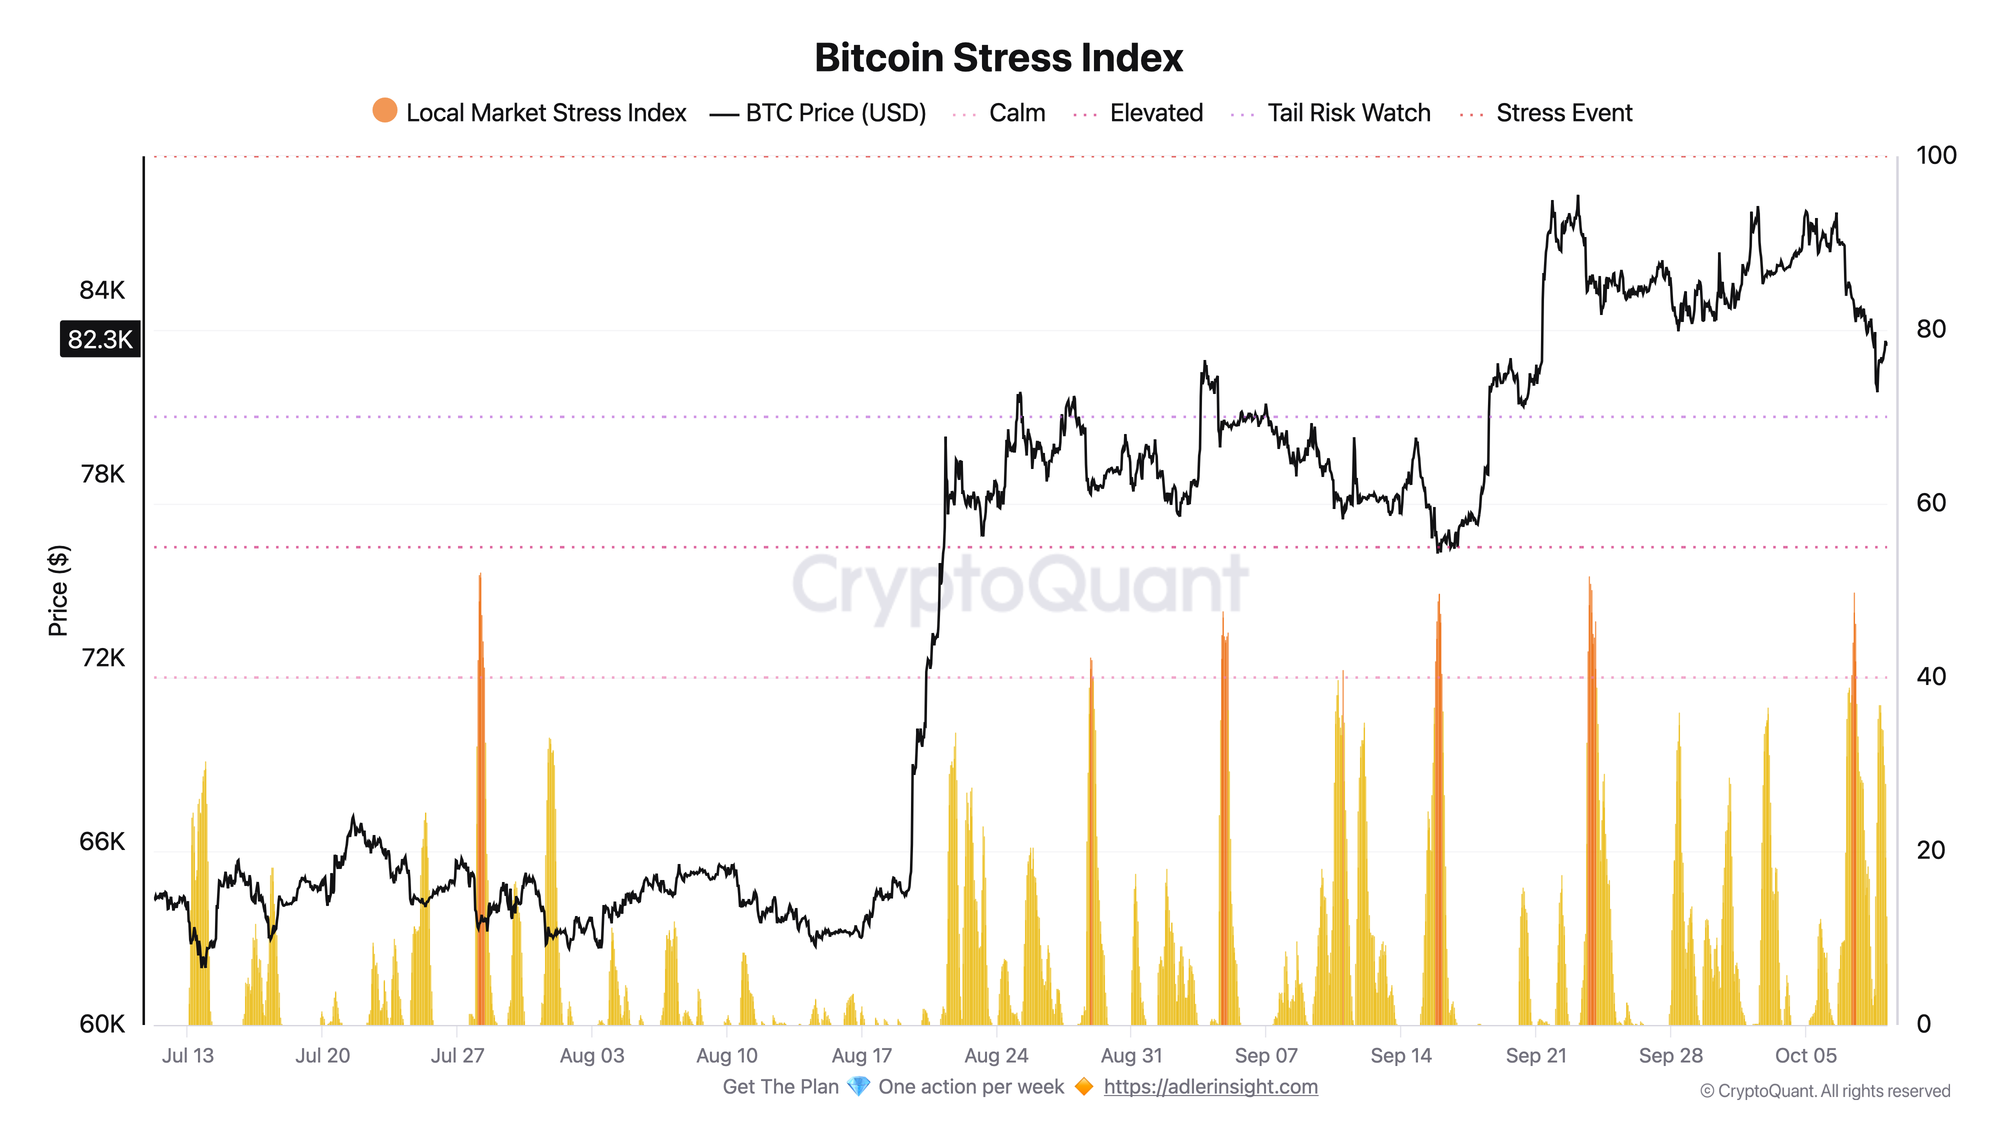
The index measures the intensity of the sell-off through the dominance of market selling, a contraction in open interest, and the funding rate. The weekly peak came on October 7 at 49.9. This falls within the Elevated stress zone, which spans readings from 40 to 55. Since July, readings at these levels have appeared only in isolated episodes, including late July and September.
Over the past 90 days, the index has never reached the threshold of 55. It has now fallen to 7 points, placing it in the calm zone. A rise to 55 or above alongside a price decline would indicate a move into the Tail Risk Watch zone and stronger selling pressure.
Bitcoin Long Liquidations USD
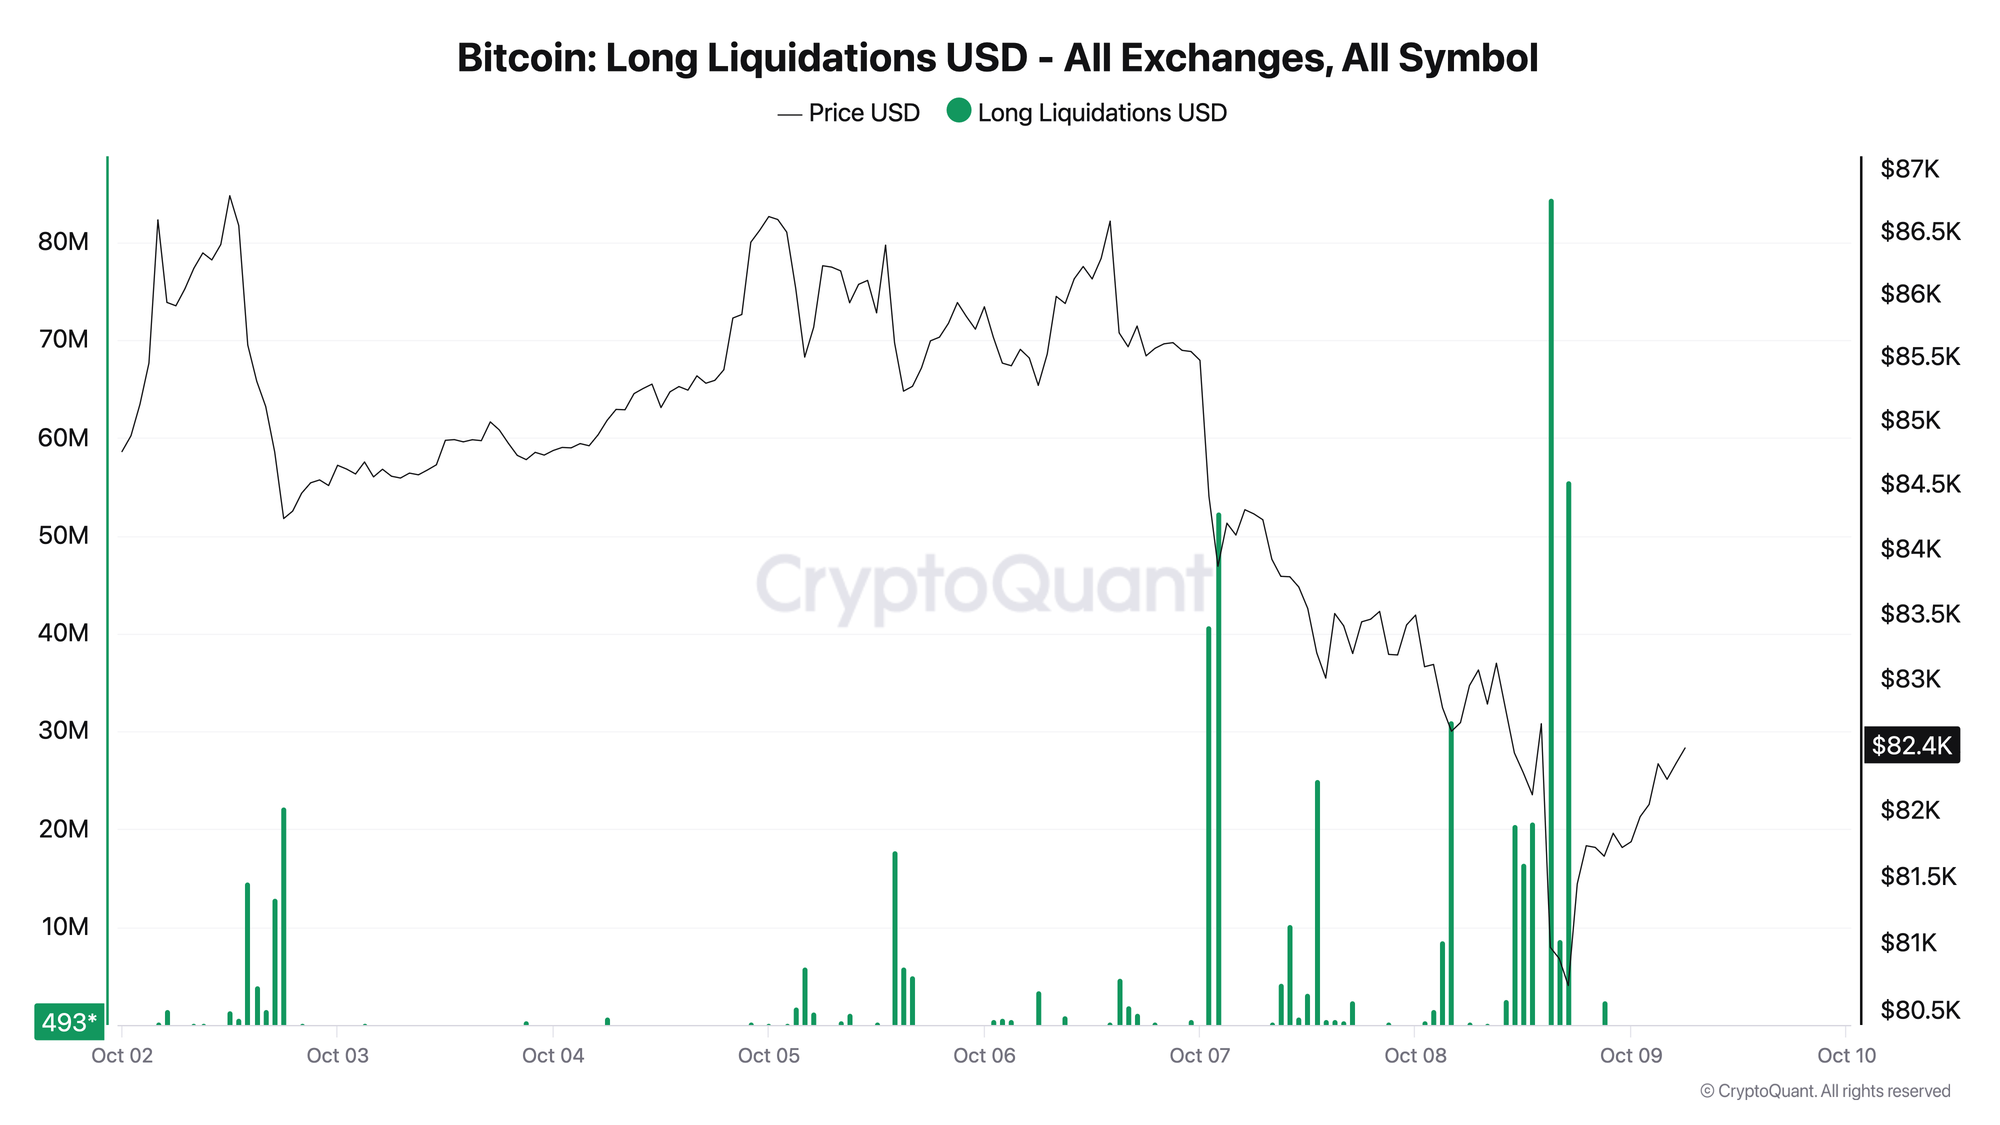
October 7 and 8 accounted for $397 million, or 76% of liquidations over October 2-8. The largest hourly total was recorded on October 8 at 15:00 UTC: $84 million. The price fell below $81K during that hour, while the weekly low was $80.7K.
After the main wave, liquidation volume fell sharply. Over the past six hours, it totaled $196K. This shows that long liquidations have subsided.
Liquidation volume is not a direct input into the index, so it provides an additional check on the nature of the sell-off. On October 8, liquidations reached $255 million versus $142 million the previous day, while the index rose to 37 versus 49.9. The larger volume of forced closures did not coincide with a high index reading. If the price falls below $80.7K, a new wave of liquidations, together with a confirmed rise in the index to 55 or above, would indicate stronger pressure. The key support zone is at $79,000.
Stop holding through every crash. Weekly Engine tells you when to stay in, when to step aside, and when risk is rising. Get access.
FAQ
Do $520 million in long liquidations mean capitulation? This volume alone does not confirm capitulation. The data show large forced closures of leveraged positions and one of the strongest stress episodes since July.
Why was the index lower on the day with the largest liquidations? Liquidation volume is not a direct input into the index. It measures the price decline, the dominance of market selling, a contraction in open interest, and funding rates.
Conclusions
The market went through one of its strongest stress episodes since July. Holding above $79K alongside low liquidation volume and a low stress index would support the view that pressure is easing. The main risk is a drop below this low with a new wave of liquidations and a confirmed rise in the stress index to 55 or above.
Live Charts
Explore the metrics behind this brief with live, auto-updating charts:
Open Interest (BTC) - Total futures positioning and 7-day BTC-denominated change.
Funding Rates - Perpetual futures funding to track long-side or short-side leverage pressure.
Fear & Greed Index - Composite market sentiment for risk appetite and sentiment extremes.
Derivatives - All funding, open-interest, and leverage charts in one view.