
🎧 Morning Brief 0088 - audio debate on today’s market setup
After the deleveraging event, the market has pulled back to the first on-chain support line - the cost basis zone of STH 0D-1D and 1W-1M cohorts. Two charts show where the key levels are and how close MVRV has come to the historical oversold zone.
TL;DR
Price is testing the $89.8-90K zone - the cost basis of the freshest buyers. Holding this level is critical for stabilization, a breakdown means two cohorts go underwater simultaneously.
Bitcoin Support and Resistance
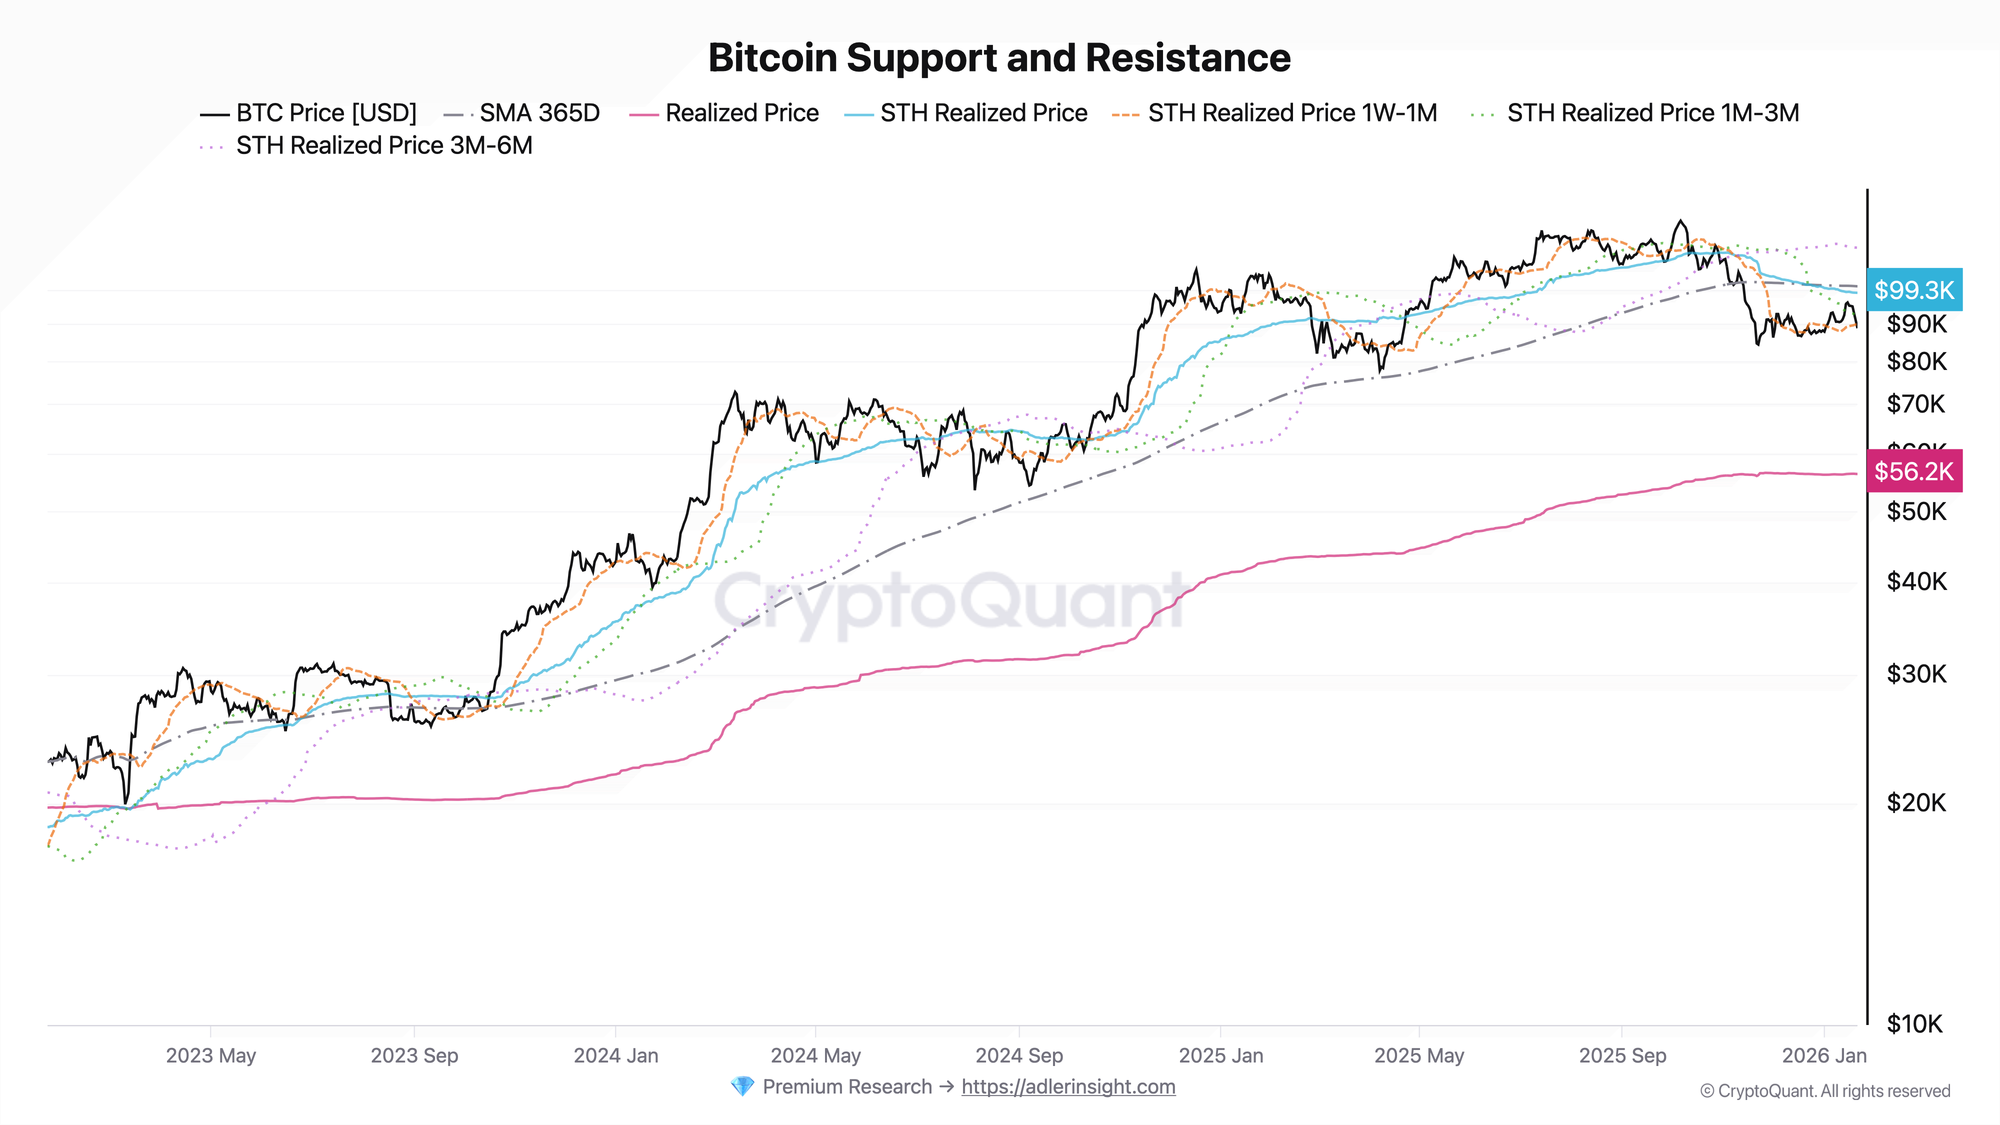
The metric displays the Realized Price of various short-term holder cohorts as dynamic support and resistance levels.
BTC price (~$89K) is trading right at the cost basis zone of the two freshest cohorts: STH 0D-1D ($89.8K) and STH 1W-1M ($90K). This means buyers from the last few weeks are at the edge of breakeven. Above are resistance levels: the 1M-3M cohort ($92.5K) is already underwater and will take profits on bounces, while the aggregated STH RP ($99.3K) remains major resistance.
Holding the $89.8-90K zone gives the market a chance to stabilize. A breakdown means the 0D-1D and 1W-1M cohorts go underwater simultaneously - this increases the risk of accelerated short-term pressure from the most sensitive market participants.
Bitcoin STH MVRV 155 days Range
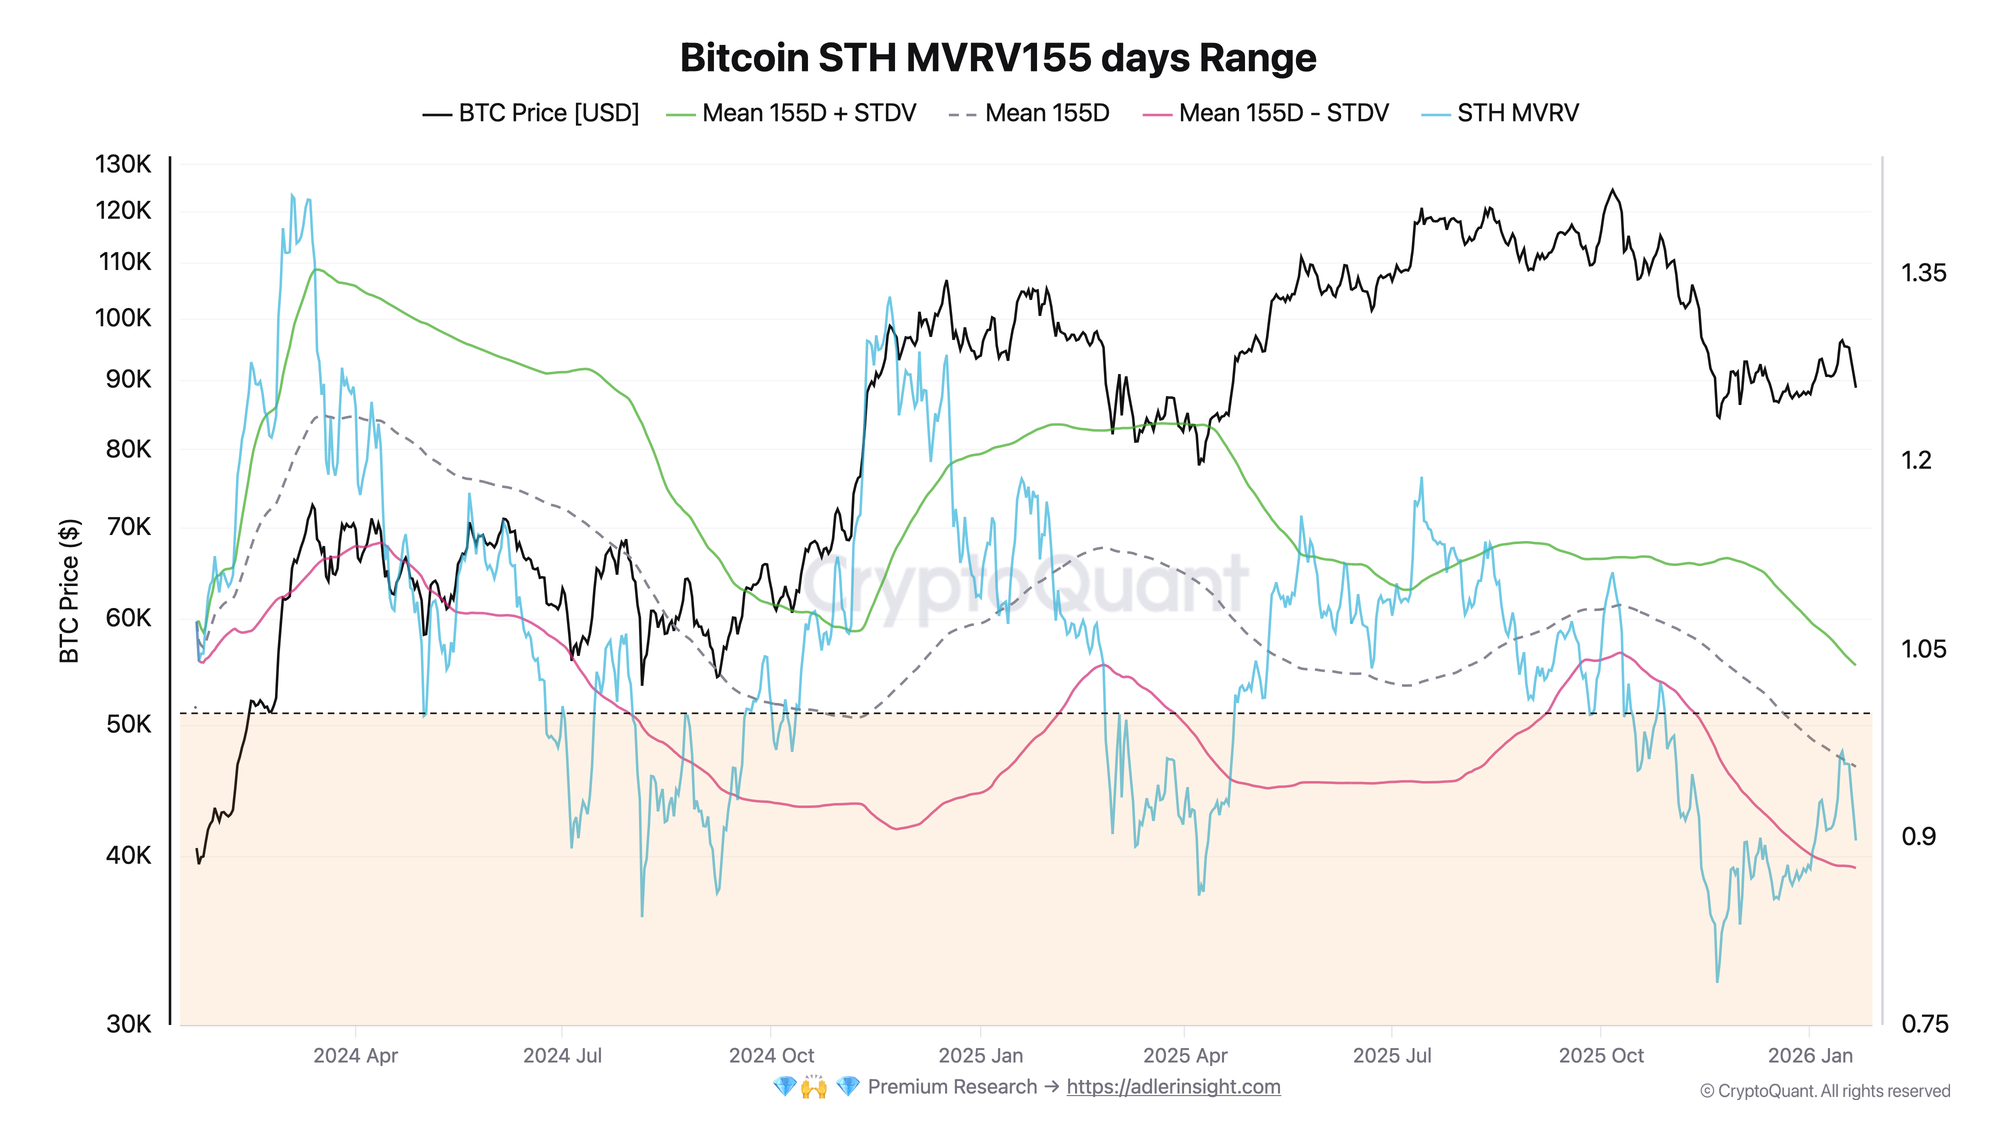
STH MVRV measures the ratio of market price to short-term holder cost basis; a value below 1.0 means the cohort is on average underwater.
Current STH MVRV stands at 0.897 - well below unity and approaching the lower boundary of the 155-day range (Mean - StdDev = 0.875). About 2.5% remains until the statistical minimum. In most historical observations, touching the lower boundary coincided with the formation of local bottoms and increased buyer interest.
The current MVRV position is a zone of heightened attention. A break below 0.875 would indicate extreme oversold conditions and potential STH capitulation. Holding above this boundary while price stabilizes at $90K would be the first sign of a local bottom forming.
Both charts form a unified picture: the first shows that the $89.8-90K zone is the defense line for fresh buyers, while $92.5K now acts as resistance. The second chart confirms that MVRV is approaching a statistical extreme. The market is at a point where the outcome will be decided: stabilization or deeper correction.
Don’t understand why I focus on this metric in today’s brief?
In the Adler Edu section, you’ll find step-by-step breakdowns of every indicator: what it measures, when it works, and when it lies.
Start with the fundamentals - then the briefs will read very differently.
FAQ
Why is the $89.8-90K zone more important than other levels?
This zone concentrates the cost basis of two cohorts at once: 0D-1D and 1W-1M. These are the most recent buyers who have not yet "adjusted" to the drawdown and are the first to respond with selling when going underwater. A breakdown of this zone means simultaneous pressure from both groups - a stronger signal than breaking a single level.
Why is $92.5K now resistance rather than support?
The 1M-3M cohort with a cost basis of $92.5K is already underwater at the current price of ~$89K. On a bounce to this level, they will have an opportunity to exit closer to breakeven and will be taking profits. This turns the level into a selling zone rather than a buying zone.
CONCLUSIONS
The market is testing a key on-chain support line: price (~$89K) sits at the cost basis zone of STH 0D-1D ($89.8K) and 1W-1M ($90K) cohorts. STH MVRV (0.897) is approaching the lower boundary of the statistical range (0.875), which in most historical cases corresponded to local bottom zones. The regime remains risk-off, but with stabilization potential if current levels hold. The main trigger for improvement is defense of the $89.8-90K zone followed by an attempt to overcome $92.5K resistance. The main risk is a break below $89.8K, which would mean two fresh cohorts going underwater simultaneously and accelerating short-term pressure.