


The decline in the average number of active addresses is approaching the scale of the 2018 drop, but is unfolding much more slowly. Meanwhile, average daily transfer volume remains around 800,000 BTC.
TL;DR
Address activity remains below its annual average, while transfer volume exceeds its own. We examine the similarities with 2018 and the differences between the two metrics.
Bitcoin Active Addresses
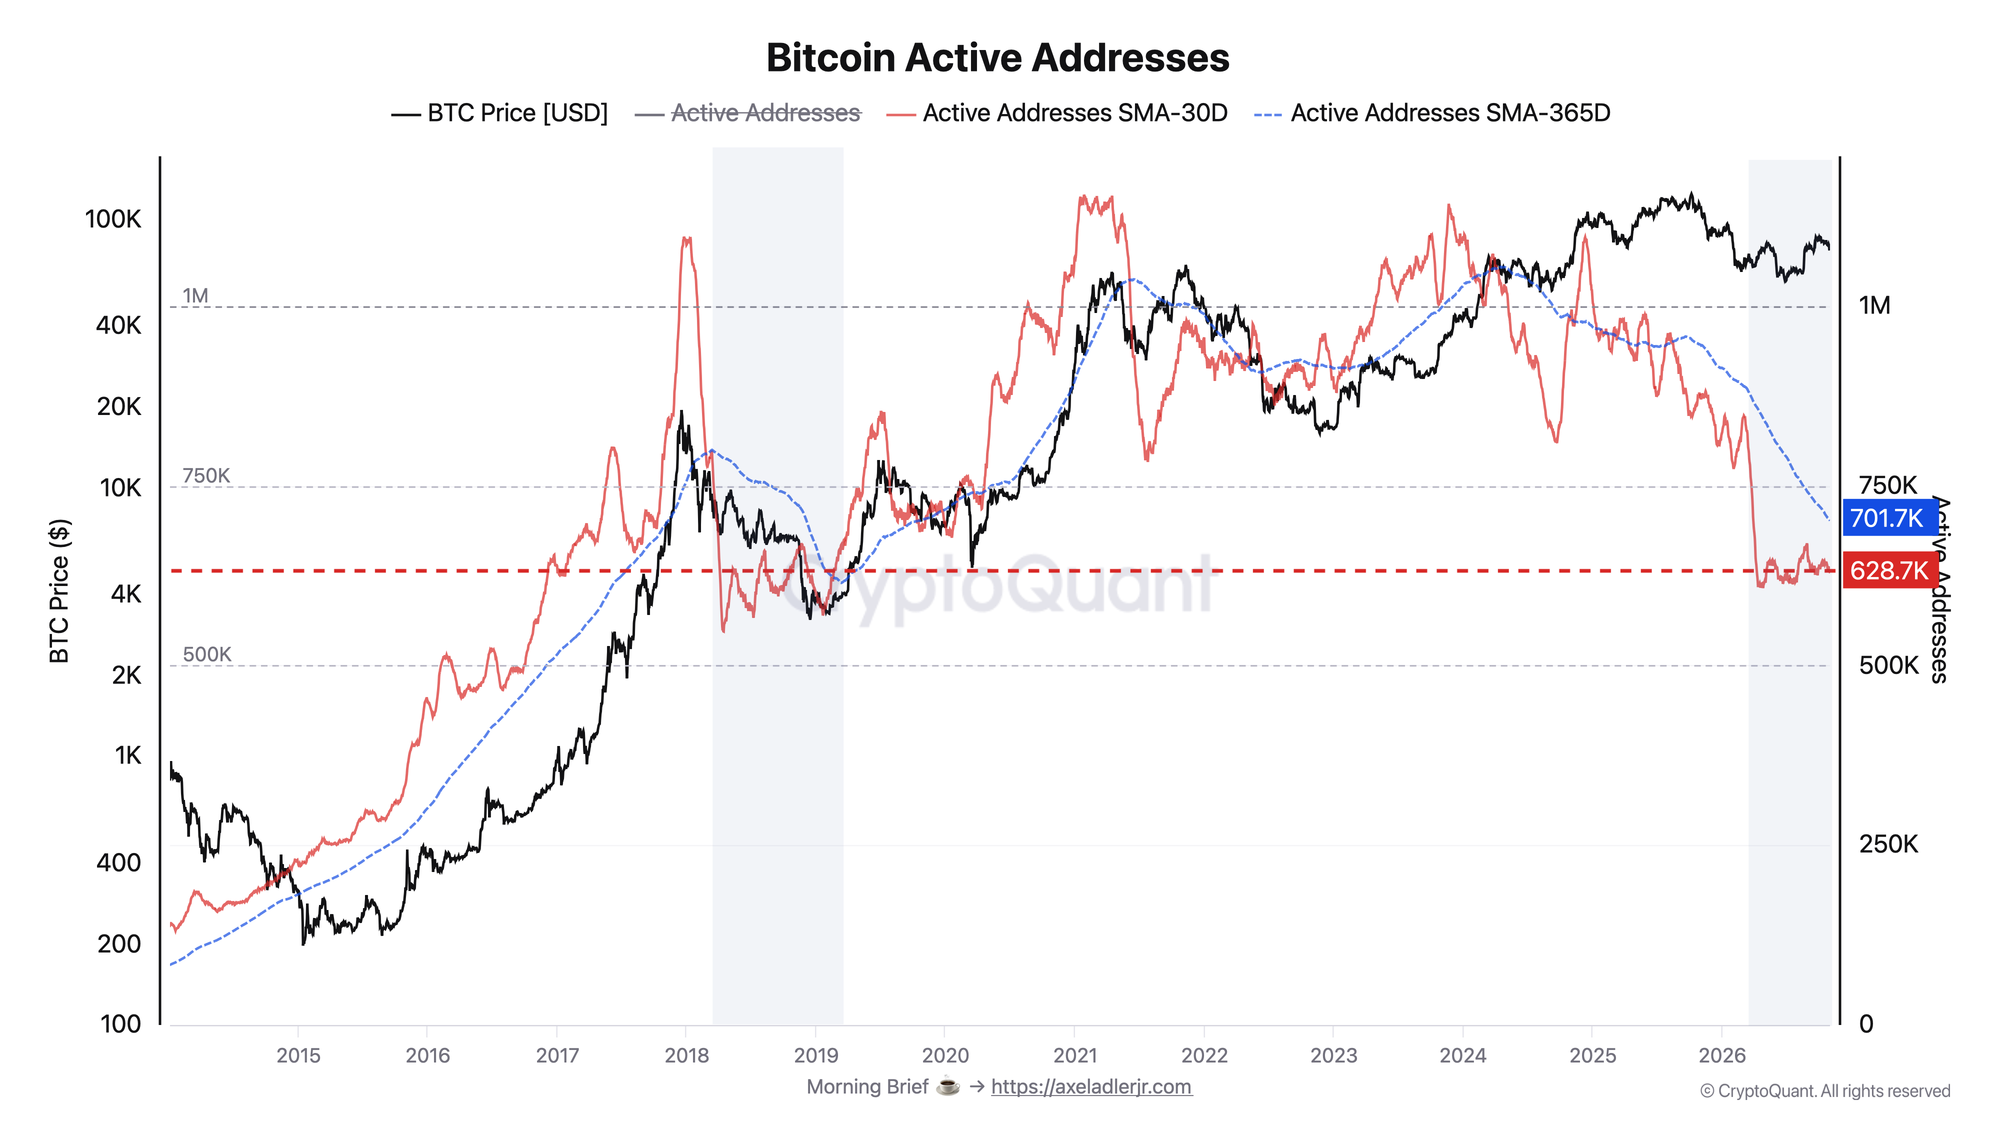
As of November 1, the 30-day average number of active addresses stands at 629,000. This is 43% below the local peak in December 2024, when the metric reached 1.10 million. Over the past week, the metric declined another 1%.
In 2018, the same metric fell 50%, from 1.10 million to 547,000. That decline took three months, from January to April. The current decline from the December 2024 peak has stretched over almost two years. The declines are similar in magnitude, but activity is contracting much more slowly this time.
The 30-day SMA is currently 10% below the annual average of 702,000. A move back above it would show that activity over the past month once again exceeds the average level over the past year.
Bitcoin Transfer Volume
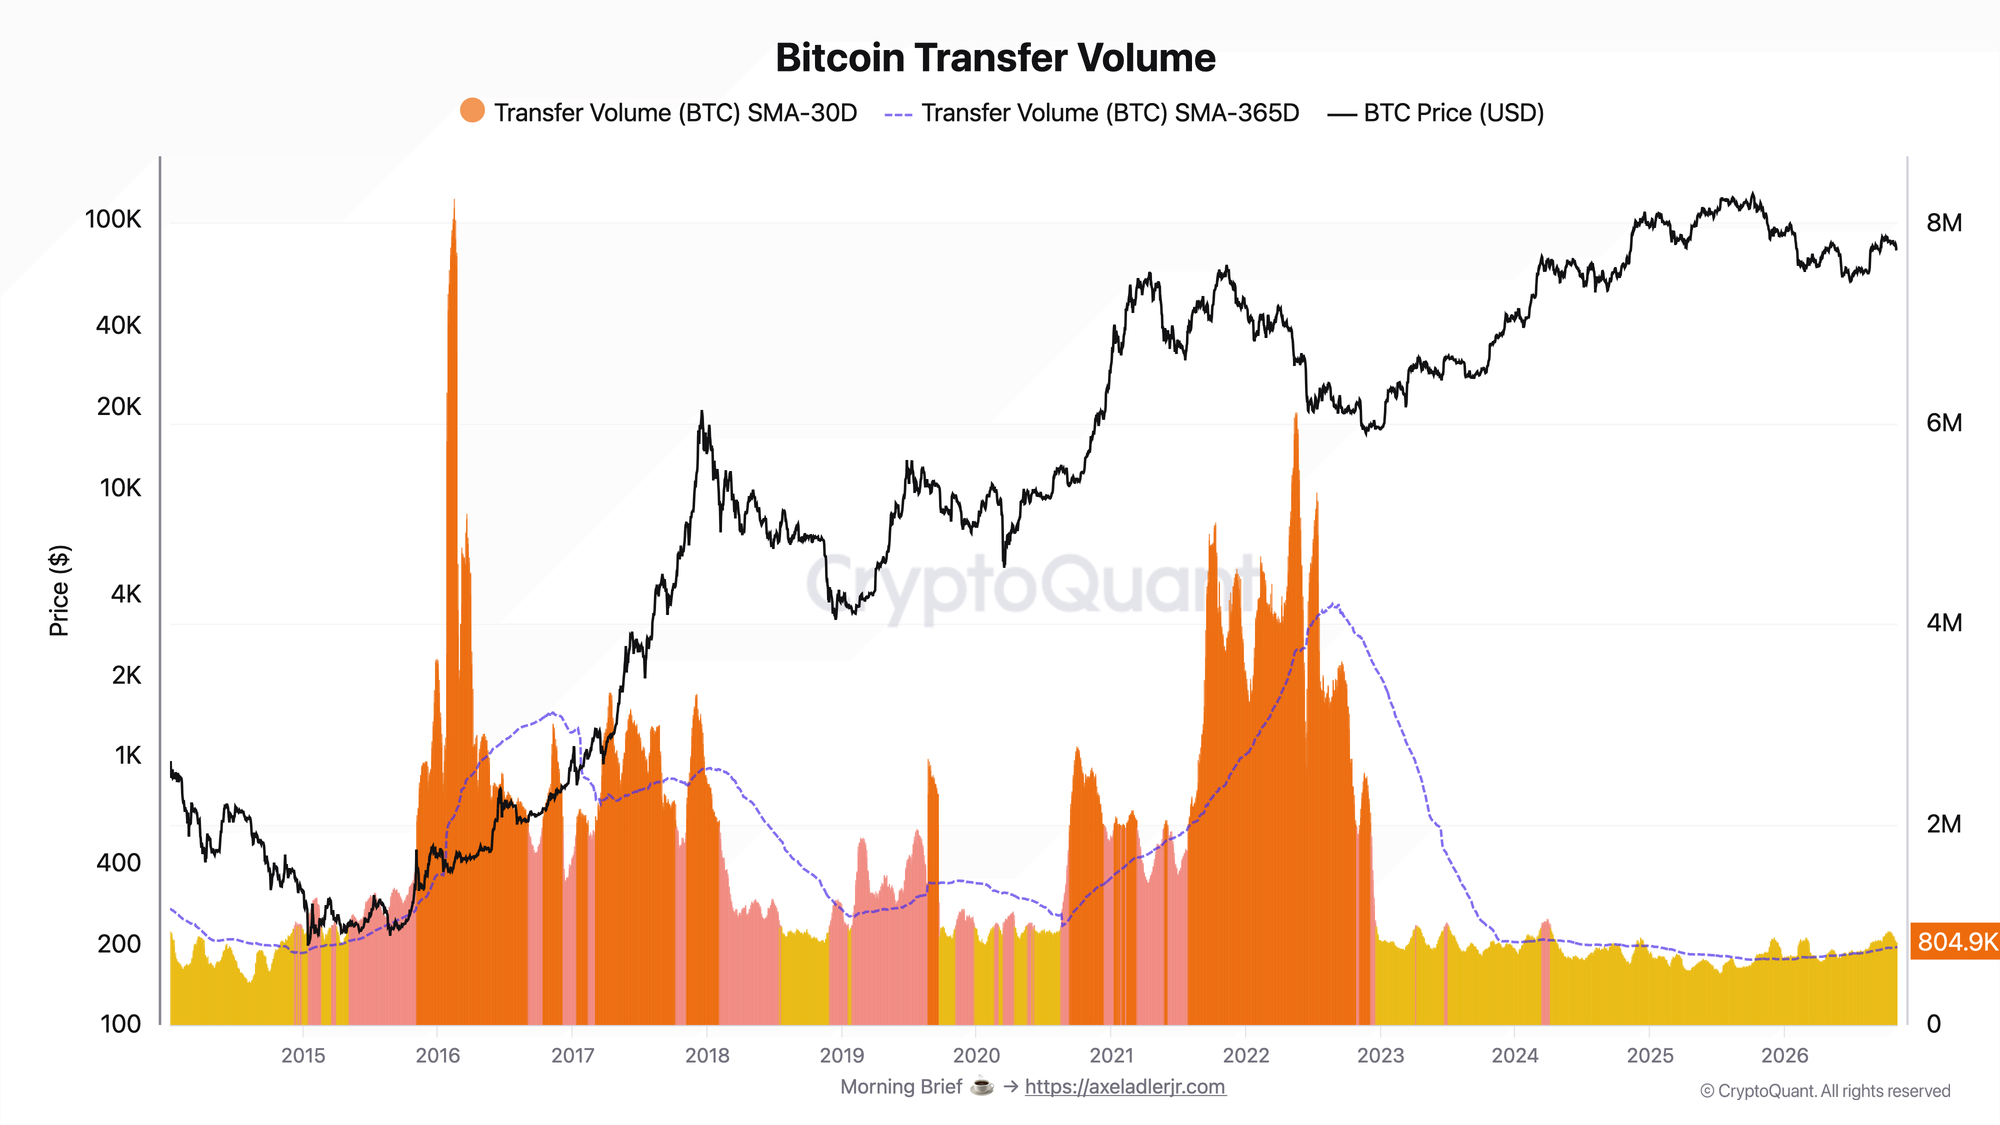
Since December 10, 2024, the 30-day average daily transfer volume has declined from 865,000 to 819,000 BTC, a drop of 5.4%. Over the same period, the average number of active addresses fell 43%. The decline in address activity has therefore not been accompanied by a comparable reduction in the volume of BTC being moved.
Over the past week, the 30-day SMA of transfer volume declined 2.5%, but remains 5.5% above the annual average of 776,000 BTC.
FAQ
Does the decline in active addresses mean an equivalent loss of users? No. One participant can use multiple addresses, so the number of addresses does not equal the number of people.
Does 819,000 BTC mean that this amount was bought or sold? The metric reflects transfers on the network, including repeated movements of the same coins.
Conclusions
Address activity has declined considerably, but the volume of BTC being moved remains in line with levels seen in recent years. With fewer active addresses, the network continues to handle a comparable volume of transfers. However, both metrics declined over the past week, so there is no sign of a sustained recovery in network activity yet. An improvement would be a move in the 30-day SMA of active addresses back above its annual average, with transfer volume remaining above its own annual average.
Live Charts
Explore the metrics behind this brief with live, auto-updating charts:
Exchange Netflow - Net BTC moving to and from exchanges across positive and negative flow regimes.
SOPR - Spent Output Profit Ratio shows whether moved coins realize profit or loss.
LTH vs STH Supply - Supply split between long- and short-term holders to track accumulation and distribution.