
🎧 Morning Brief #183 - audio debate on today’s market setup
Over the past month, the market has pulled back from the May highs to February levels. Both charts capture the same reversal, but at different speeds: the slow Bitcoin Impulse has already dropped to -59, while average monthly demand from takers has only now broken below the zero line.
TL;DR
A brief on the reversal in momentum and aggressive demand. The logic is simple: impulse has already collapsed, while the bullish fuel behind the rally from taker orders dried up only on the latest bars. This is still an early stage of deterioration.
Bitcoin Impulse Performance
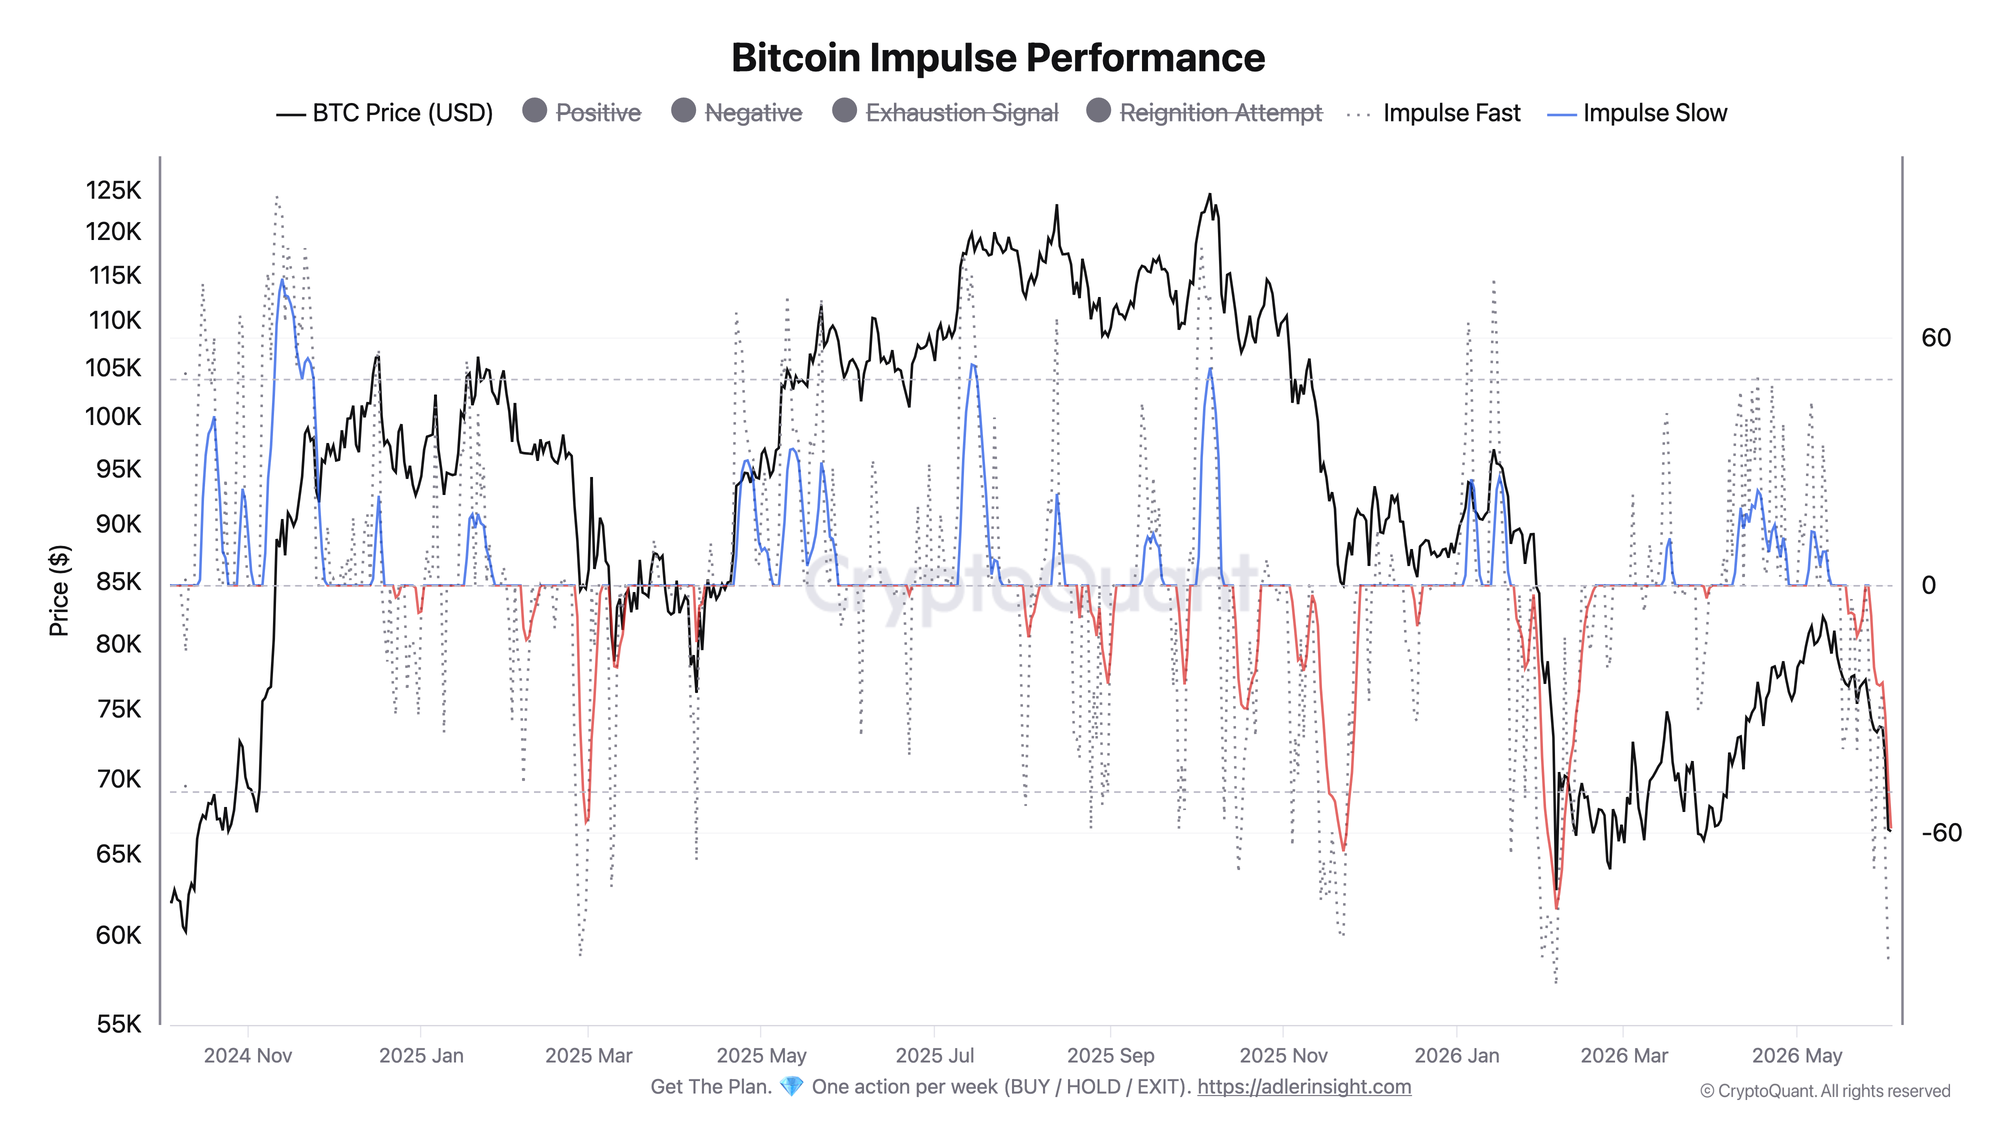
The metric reflects the speed and persistence of price impulse: Fast reacts first, while Slow confirms the regime shift.
Both lines are now deep in negative territory. Fast impulse is pinned near the lower boundary around -90, while slow impulse has fallen to -59 and continues to accelerate downward. Slow crossed below zero in late May and, within a week, moved all the way from zero to an extreme negative reading, in sync with the price decline.
Confirmation of further deterioration would come from Slow holding below zero. For an upside reversal, Fast needs to return to positive territory and attempt a reignition, which is not visible at the right edge yet.
Bitcoin Net Taker Volume Position Change
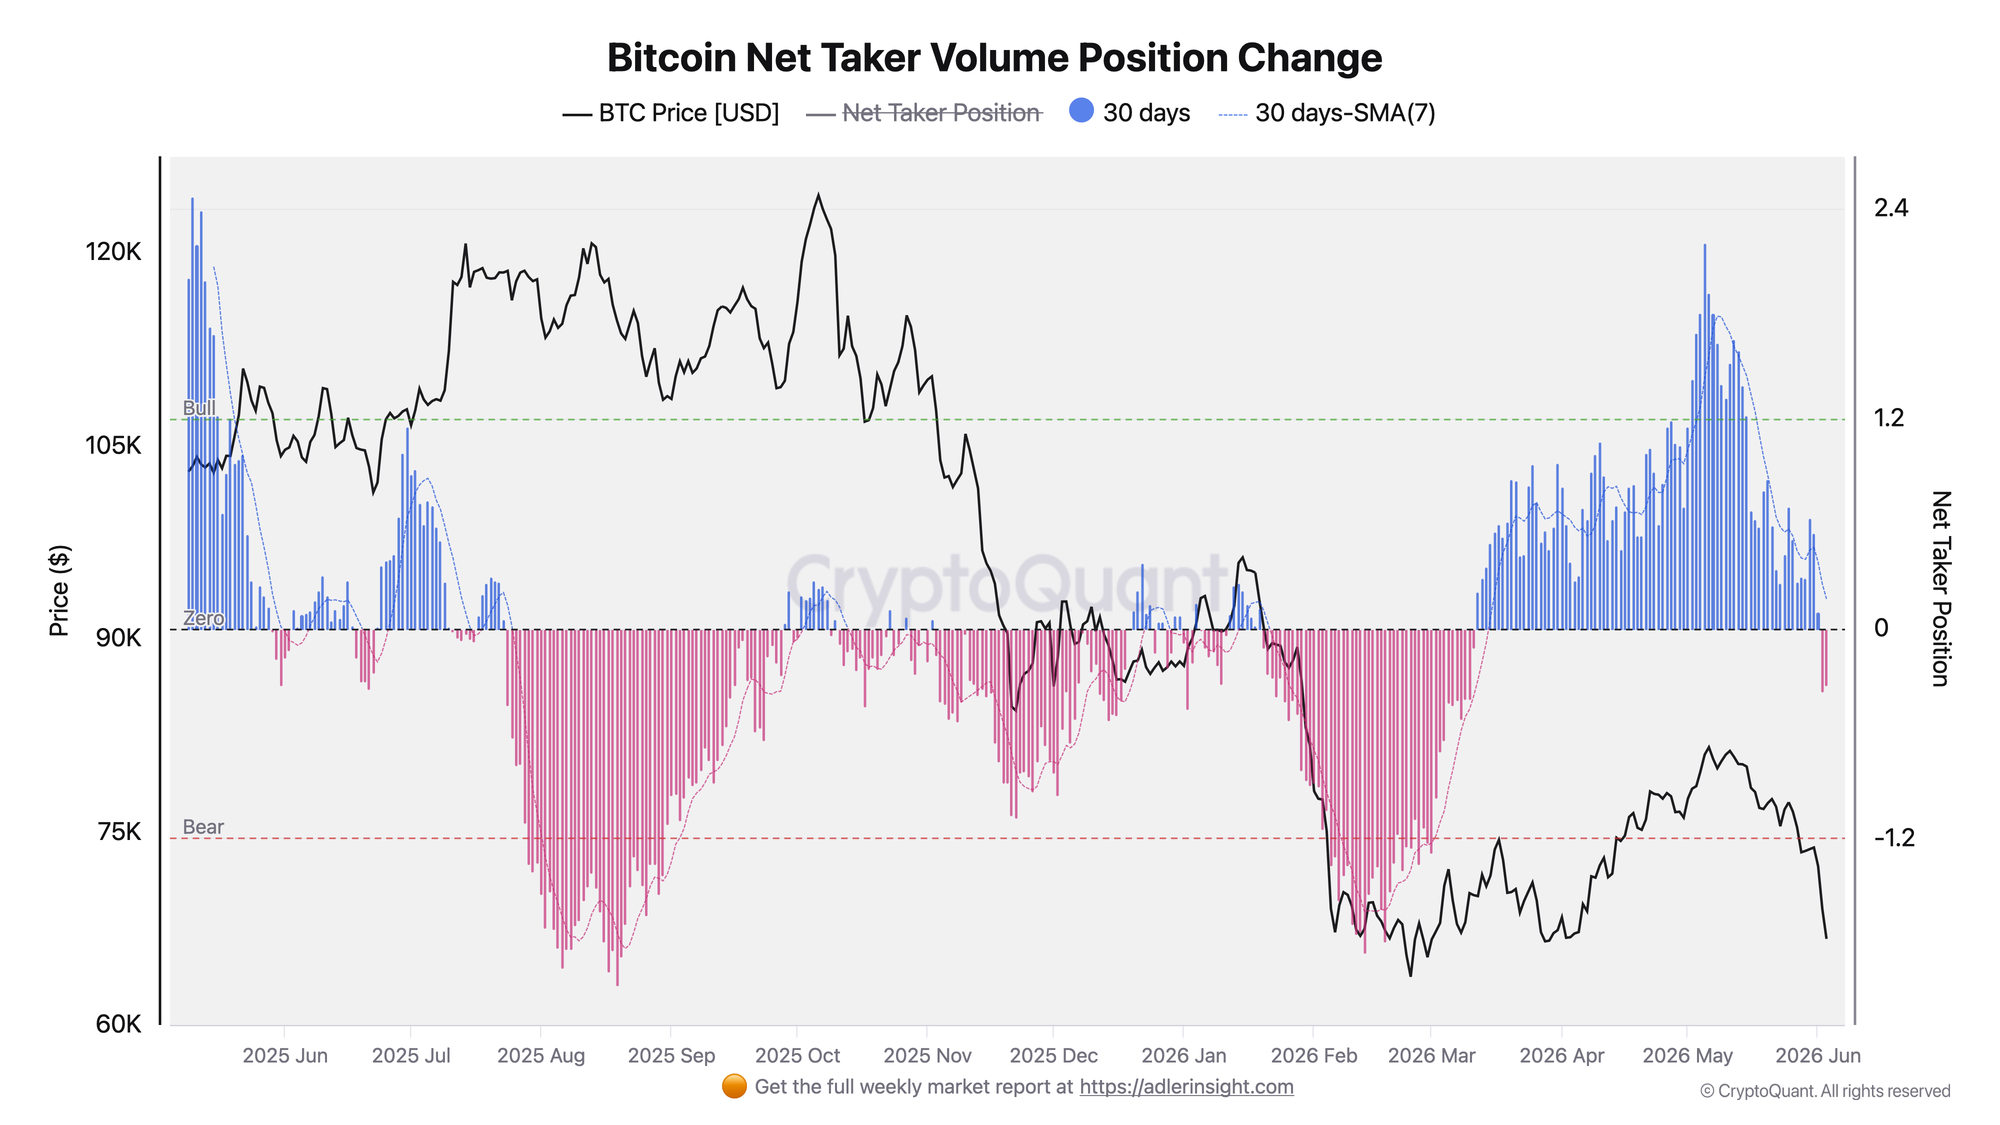
The metric shows the balance between aggressive market buying and selling over 30 days: above zero, buyers dominate; below zero, sellers take the initiative.
Since mid-March, the 30-day position had been holding steadily in positive territory, and in early May it rose above the Bull threshold. On the latest bars, the histogram changed color to negative: taker demand moved below zero for the first time in almost three months. At the same time, the smoothed SMA(7) line is still holding slightly above zero, but it is already turning down noticeably. The signal has not reached the Bear zone yet.
The fuel that supported the spring rally has been exhausted, but the process itself is still in its early stage. For risk and positioning, this is a transition from a "buyers in control" regime to a "sellers taking the initiative" regime.
The second chart confirms the first one, but with a lag: impulse has already collapsed, while taker demand is only now catching up with it by breaking below zero. The main point today is that market demand has officially moved into negative territory, and momentum is leading this shift.
FAQ
Why is impulse already at the lows while Net Taker has only just broken below zero?
Impulse is a faster momentum metric, so it reacts first and is already in a deeply negative regime. The 30-day taker position is inertial: it smooths almost a month of data and changes sign later. That is why the current break below zero is an early deterioration signal.
What will define the regime shift boundary?
To the downside - a move in the 30-day position toward the Bear zone while impulse holds below zero. That would confirm risk-off. To the upside - a return of Net Taker above zero and an attempt to reactivate impulse would hand the initiative back to buyers.
CONCLUSIONS
Over the past month, price has returned to February levels, and both charts describe the same reversal: impulse is in free fall and accelerating downward, while the 30-day taker position has just broken below zero after almost three months in positive territory. This means the aggressive demand that fueled the spring rally has been exhausted.
The resulting regime is risk-off with a leading signal from momentum. The main trigger from here is a move in Net Taker toward the Bear zone while impulse holds below zero. That would confirm the bearish scenario. The main risk to this view is a quick return of takers above zero and an attempt to reactivate impulse.
Live Charts
Explore the metrics behind this brief with live, auto-updating charts:
Funding Rates - Perpetual futures funding to track long-side or short-side leverage pressure.
Open Interest (BTC) - Total futures positioning and 7-day BTC-denominated change.
Fear & Greed Index - Composite market sentiment for risk appetite and sentiment extremes.
Coinbase Premium Index - Coinbase vs global market premium as a proxy for US spot demand pressure.
Bitcoin Analysis Framework - Multi-layer decision stack for cycle position, participant behavior, and momentum timing.