
🎧 Morning Brief #182 - audio debate on today’s market setup
Since the start of May, the market regime has completely reversed. What previously pushed price higher is now working against it. Two charts show how exchange outflows and short squeezes have been replaced by BTC inflows to exchanges and cascading long liquidations. Against this backdrop, price has pulled back from the May high toward the $70K zone.
TL;DR
This brief is about how May's market support turned into pressure. The logic is simple: spot and futures, which previously drove the rebound, are now working in sync to the downside.
Bitcoin Exchange Flow
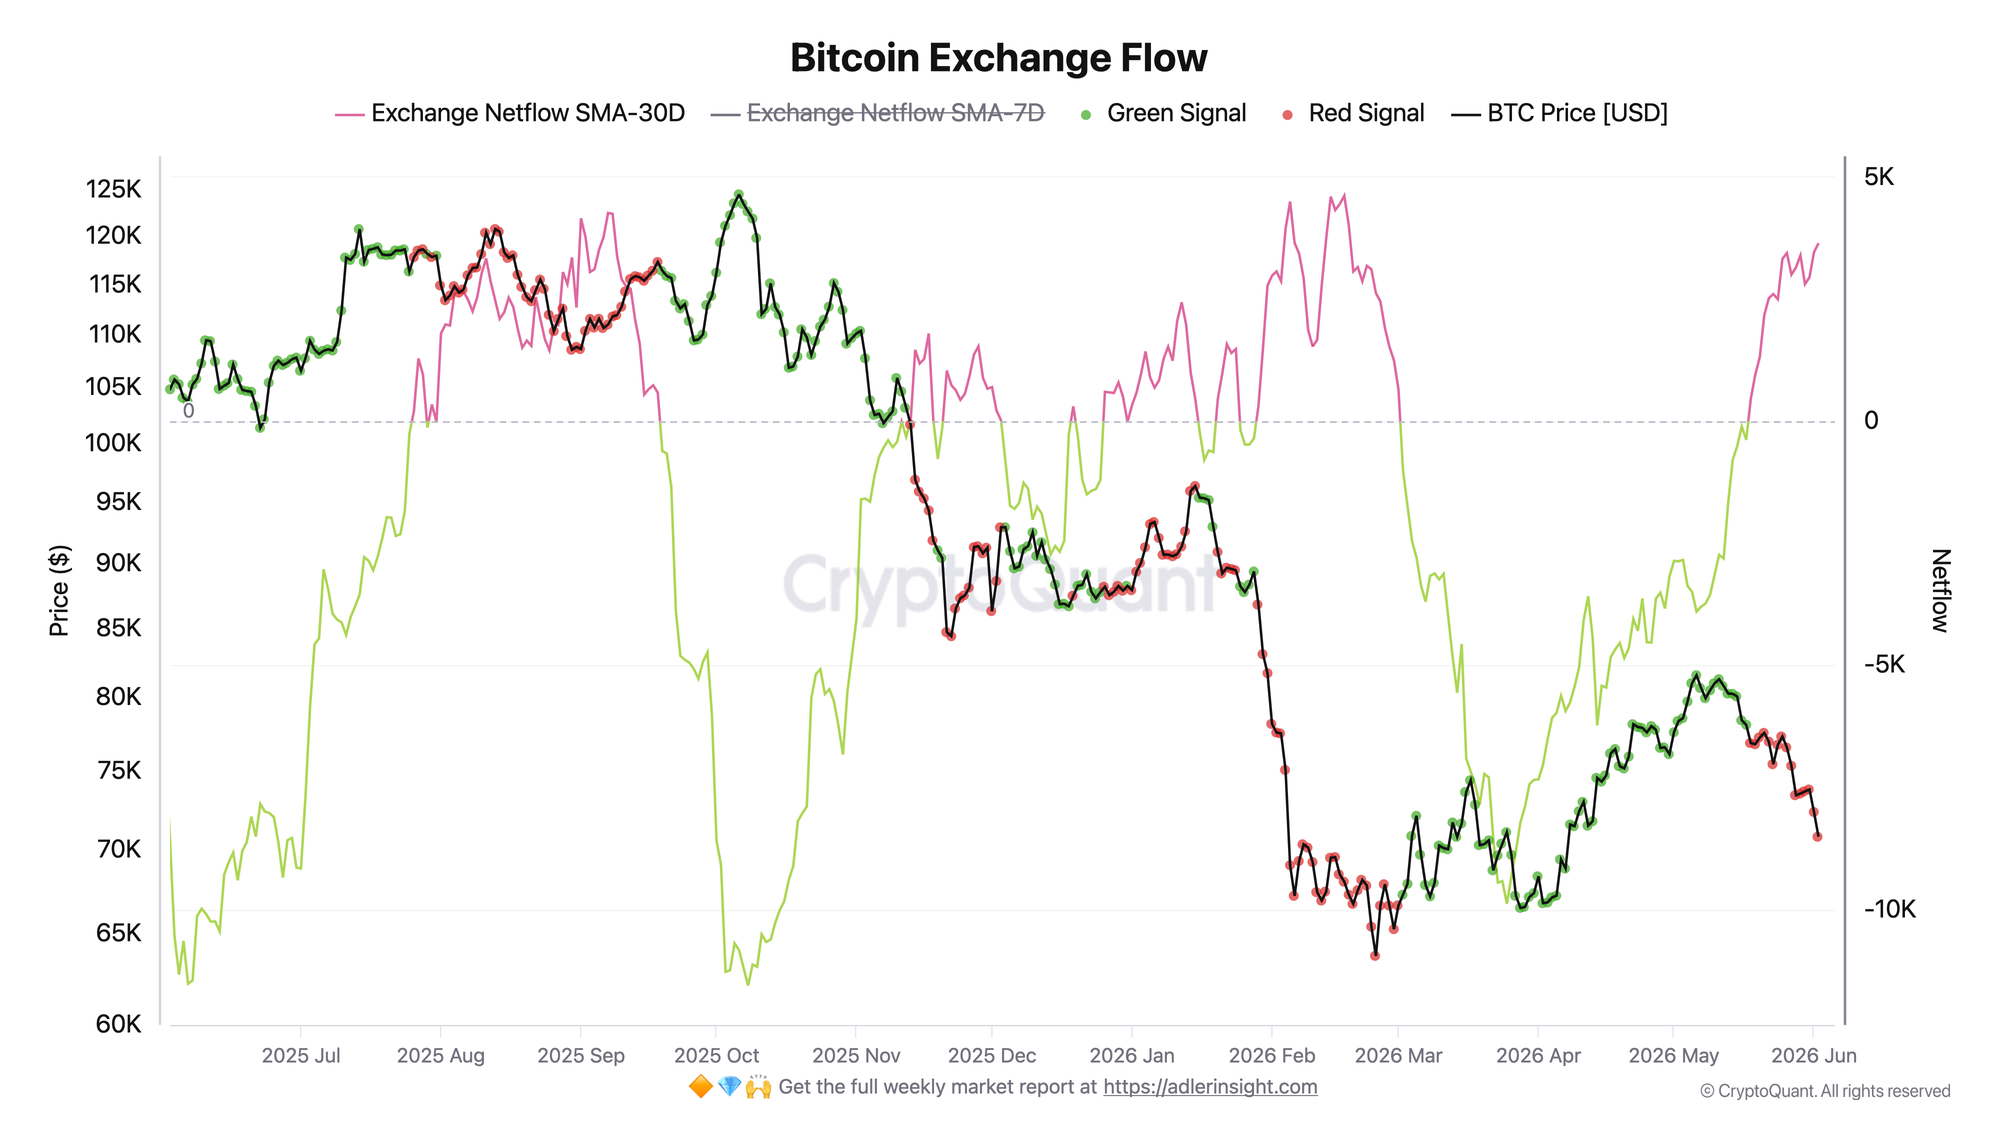
Metric: net BTC flow to and from exchanges. Negative values mean outflows from exchanges and accumulation. Positive values mean inflows to exchanges and potential selling pressure.
In the first half of May, the 30-day netflow remained deeply negative, around -3.9K BTC. The signal stayed green, and against this backdrop price reached a May high of around $81.6K.
On May 16, the flow crossed the zero line to the upside, the signal flipped red, and inflows have only strengthened since then. The 30D netflow is now positive at +3.6K BTC, while the faster 7D flow has accelerated even more, to +8.7K BTC.
This means coins are entering exchanges faster than they are leaving them. For the market, this is a picture of distribution and supply pressure. A regime reversal would require the 30D netflow to move back below zero.
Bitcoin Futures Long Short Liquidations Dominance
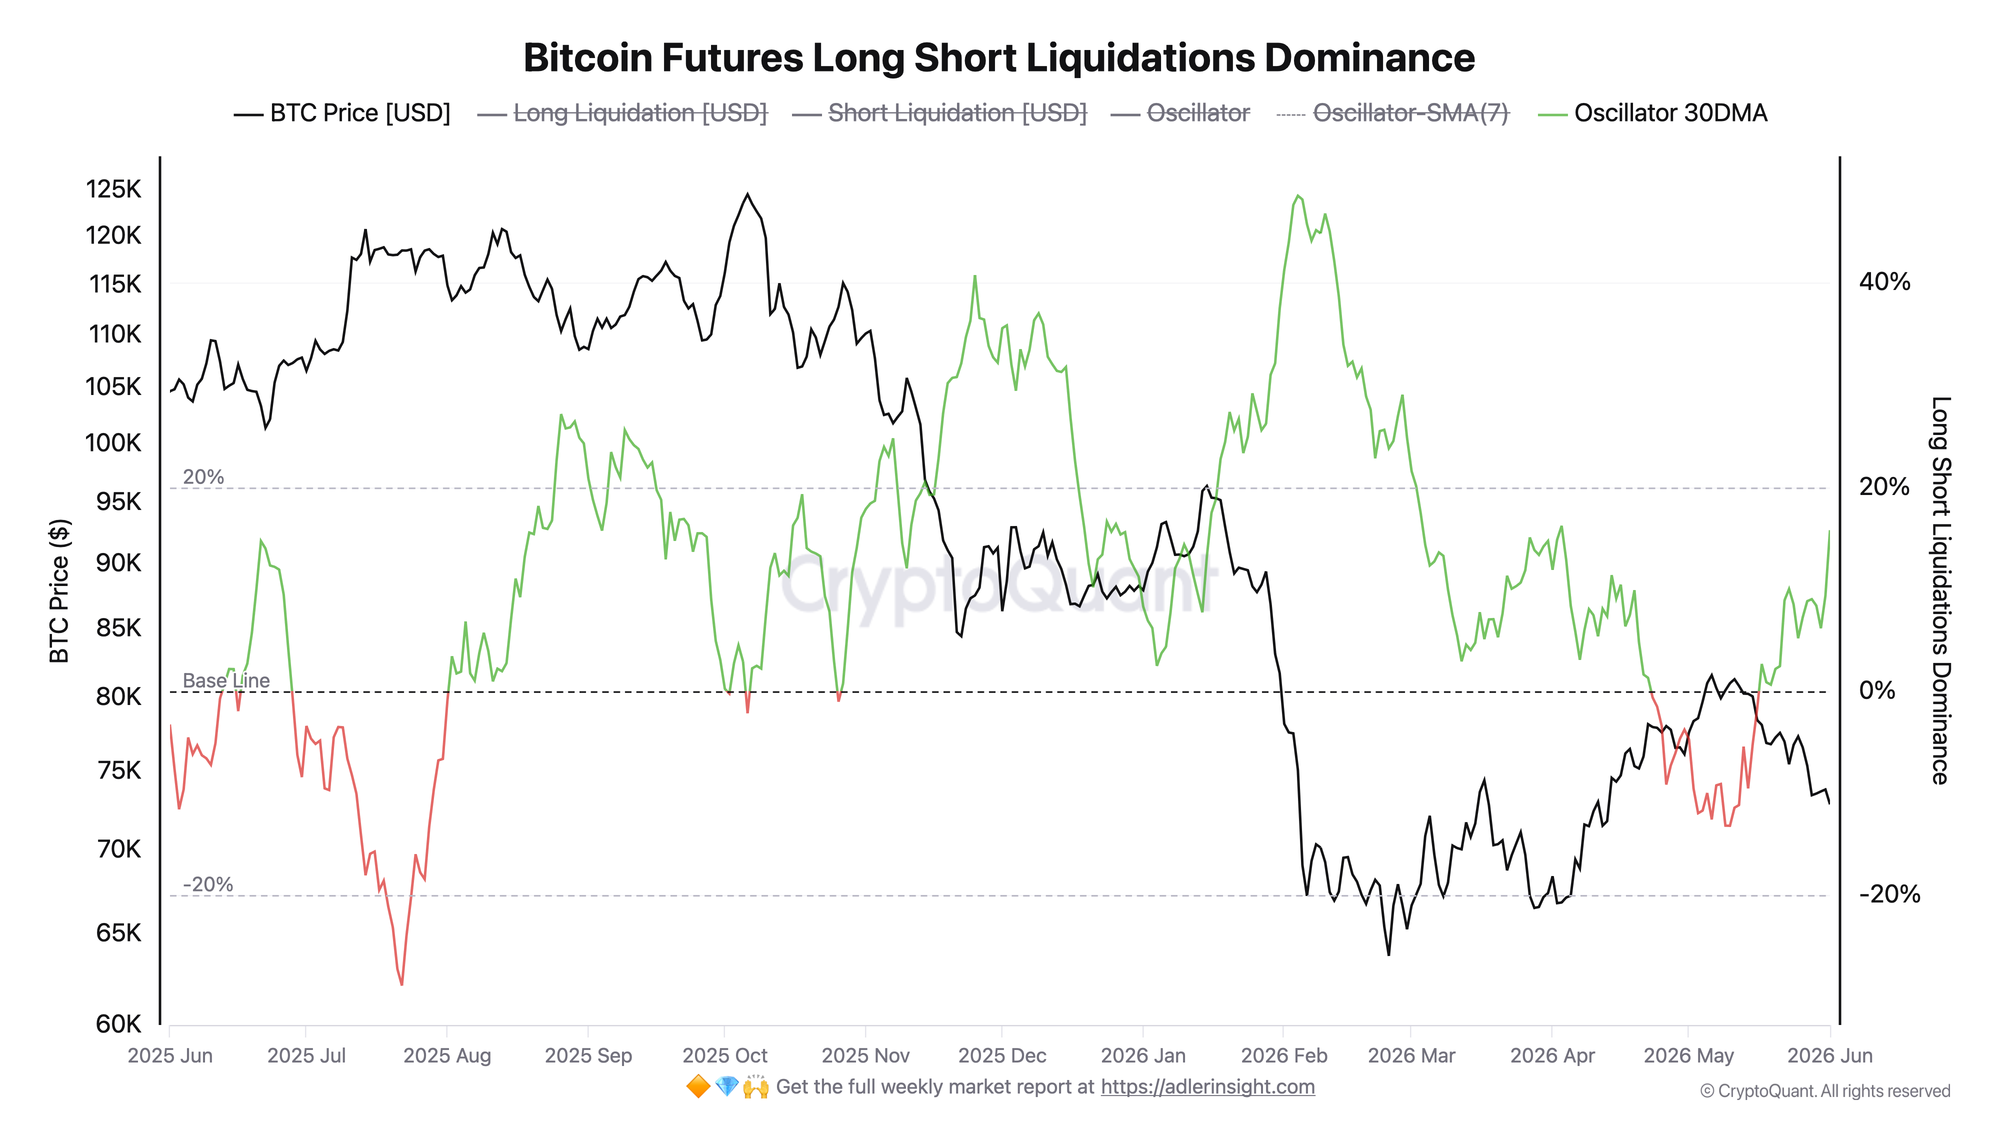
Metric: liquidation dominance oscillator. Positive values mean long liquidations dominate. Negative values mean short liquidations dominate.
In early May, the oscillator's 30DMA was in negative territory. At that point, short liquidations dominated, helping the early rebound. By mid-May, the oscillator had turned upward through zero and is now in positive territory, around +16. This means the market is now flushing out longs during the decline.
Recent days brought extreme spikes: daily long liquidation dominance rose to +98-99, while forced closures of long positions exceeded short liquidations by several multiples.
This shows that the decline is being amplified not only by normal selling, but also by forced unwinding of long positions. The link is clear: spot inflows to exchanges create supply pressure, while long liquidations in futures amplify the move. Both channels are now working in the same direction - down.
FAQ
Why did the early May rally fail to hold?
Because it was supported by two factors: coins leaving exchanges and a short squeeze. Once netflow reversed into inflows and liquidation dominance shifted toward longs, both drivers disappeared. Price lost its support.
What would signal a regime shift back?
A return of the 30-day netflow below zero, meaning renewed coin outflows from exchanges, together with a downward turn in the liquidation oscillator toward short-dominance territory. Until then, the priority remains on the sellers' side.
CONCLUSIONS
Since May, both metrics have moved in sync from support to pressure. Spot flow shifted from outflows to sustained coin inflows to exchanges, while liquidation dominance moved from shorts to longs. Against this backdrop, price fell from the May high toward the $70K zone.
The regime remains risk-off: supply is pressuring the market from both spot and leverage at the same time.
The main reversal trigger is a return of the 30D netflow into negative territory alongside a cooling of long liquidations. The main risk is a continued cascade of long liquidations while coin inflows to exchanges remain elevated. That scenario could extend the decline below current levels.
Live Charts
Explore the metrics behind this brief with live, auto-updating charts:
Exchange Netflow — Net BTC moving to and from exchanges across positive and negative flow regimes.
Funding Rates — Perpetual futures funding to track long-side or short-side leverage pressure.
Open Interest (BTC) — Total futures positioning and 7-day BTC-denominated change.
Coinbase Premium Index — Coinbase vs global market premium as a proxy for US spot demand pressure.
Fear & Greed Index — Composite market sentiment for risk appetite and sentiment extremes.