


Bitcoin has climbed to $85.7K and is trading above its average price over the past year for the first time since November 2025. At the same time, Trend Pulse has returned to bull mode after nine days in neutral.
TL;DR
The short-term and long-term trends are pointing up again. We look at how durable this signal is and which average prices now act as support.
Bitcoin Trend Pulse
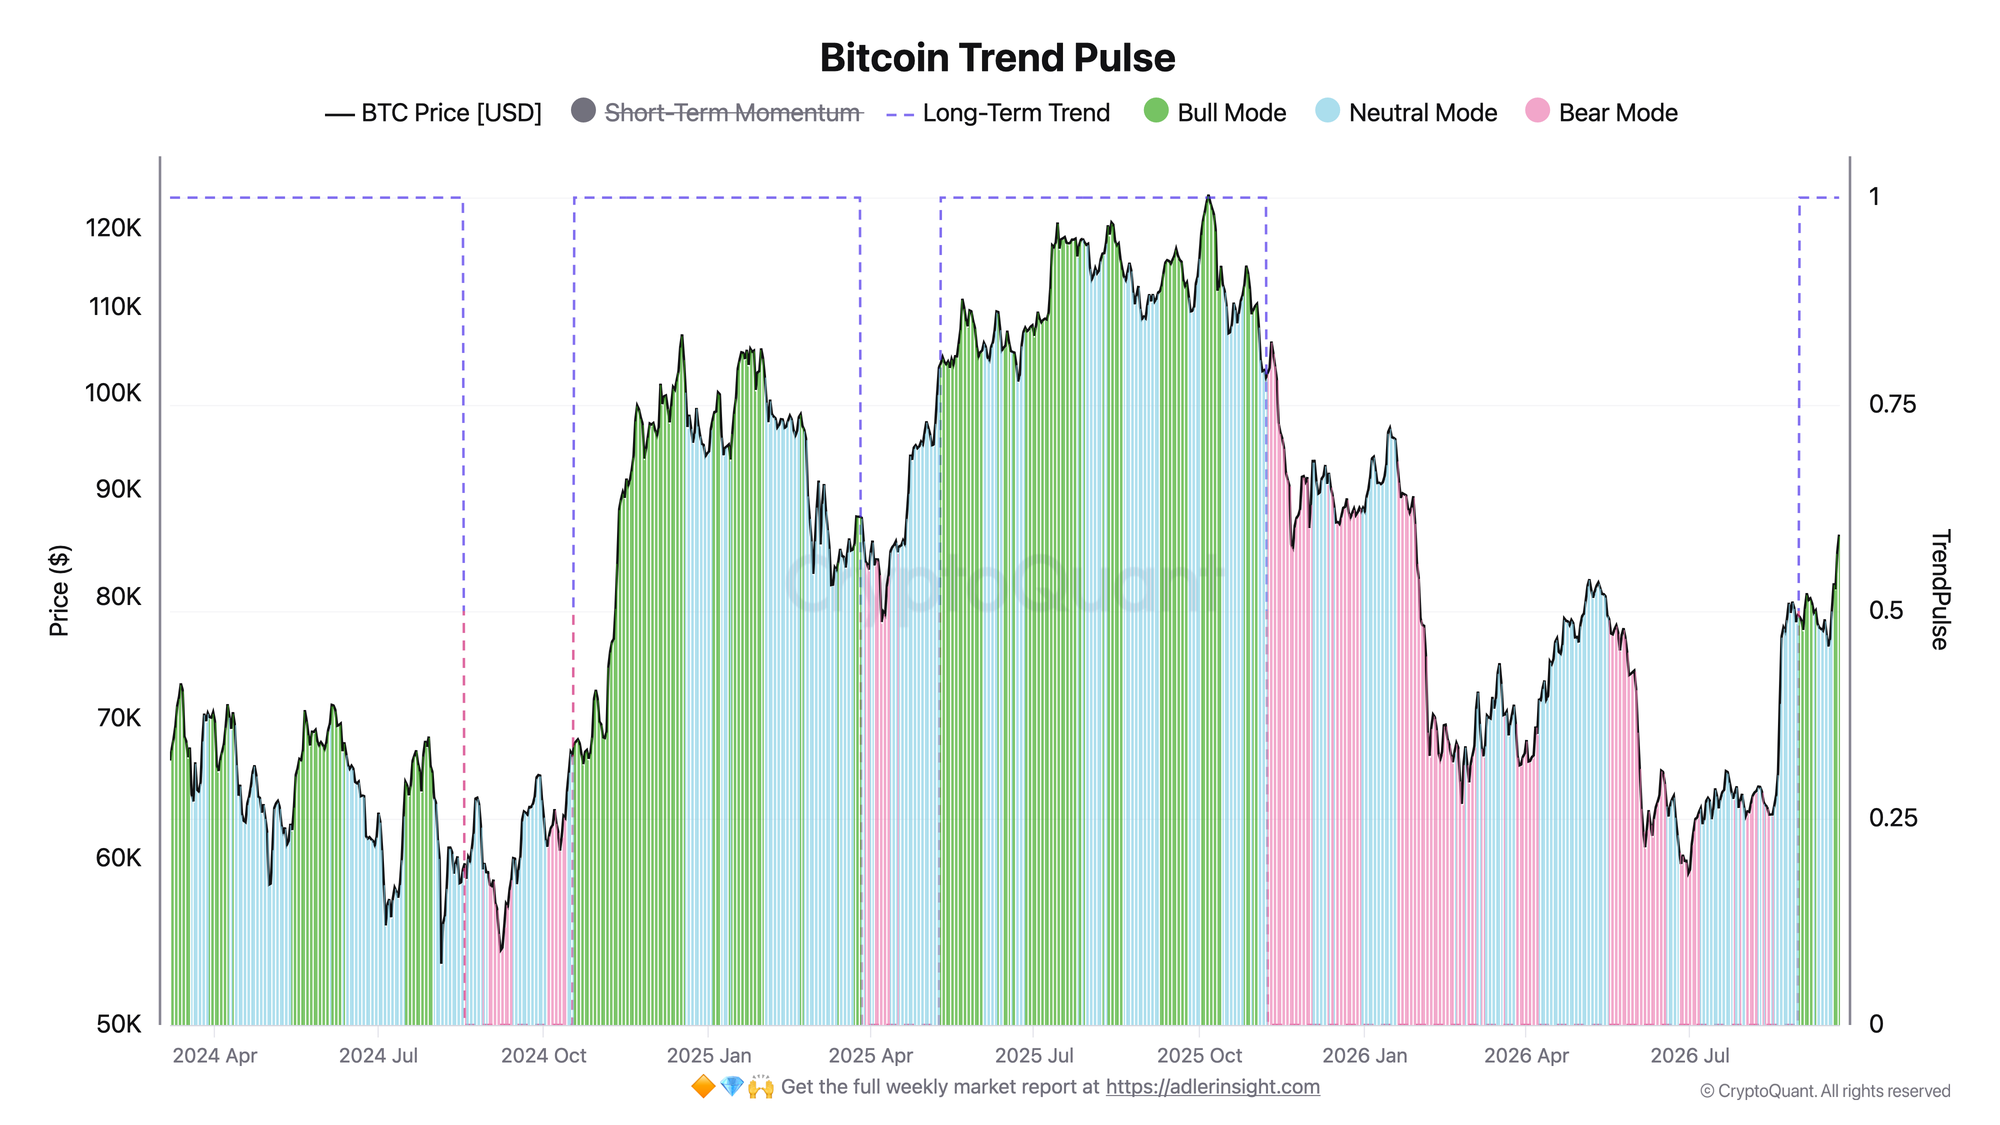
From September 10 to 18, the indicator was in neutral mode: the long-term trend remained up, but the price was lower than two weeks earlier. On September 19, short-term momentum recovered, and both signals are showing growth again. Over the week, bitcoin rose from $76.8K to $85.7K, or 11.5%.
The long-term signal has a cushion: the 30-day average ($78.9K) is 12% above the 200-day average ($70.6K). Over the next few days, that is the $76-79K range. If bitcoin falls back into it, the indicator will switch to neutral mode again, as it did in mid-September.
Bitcoin: Technical Pricing Models
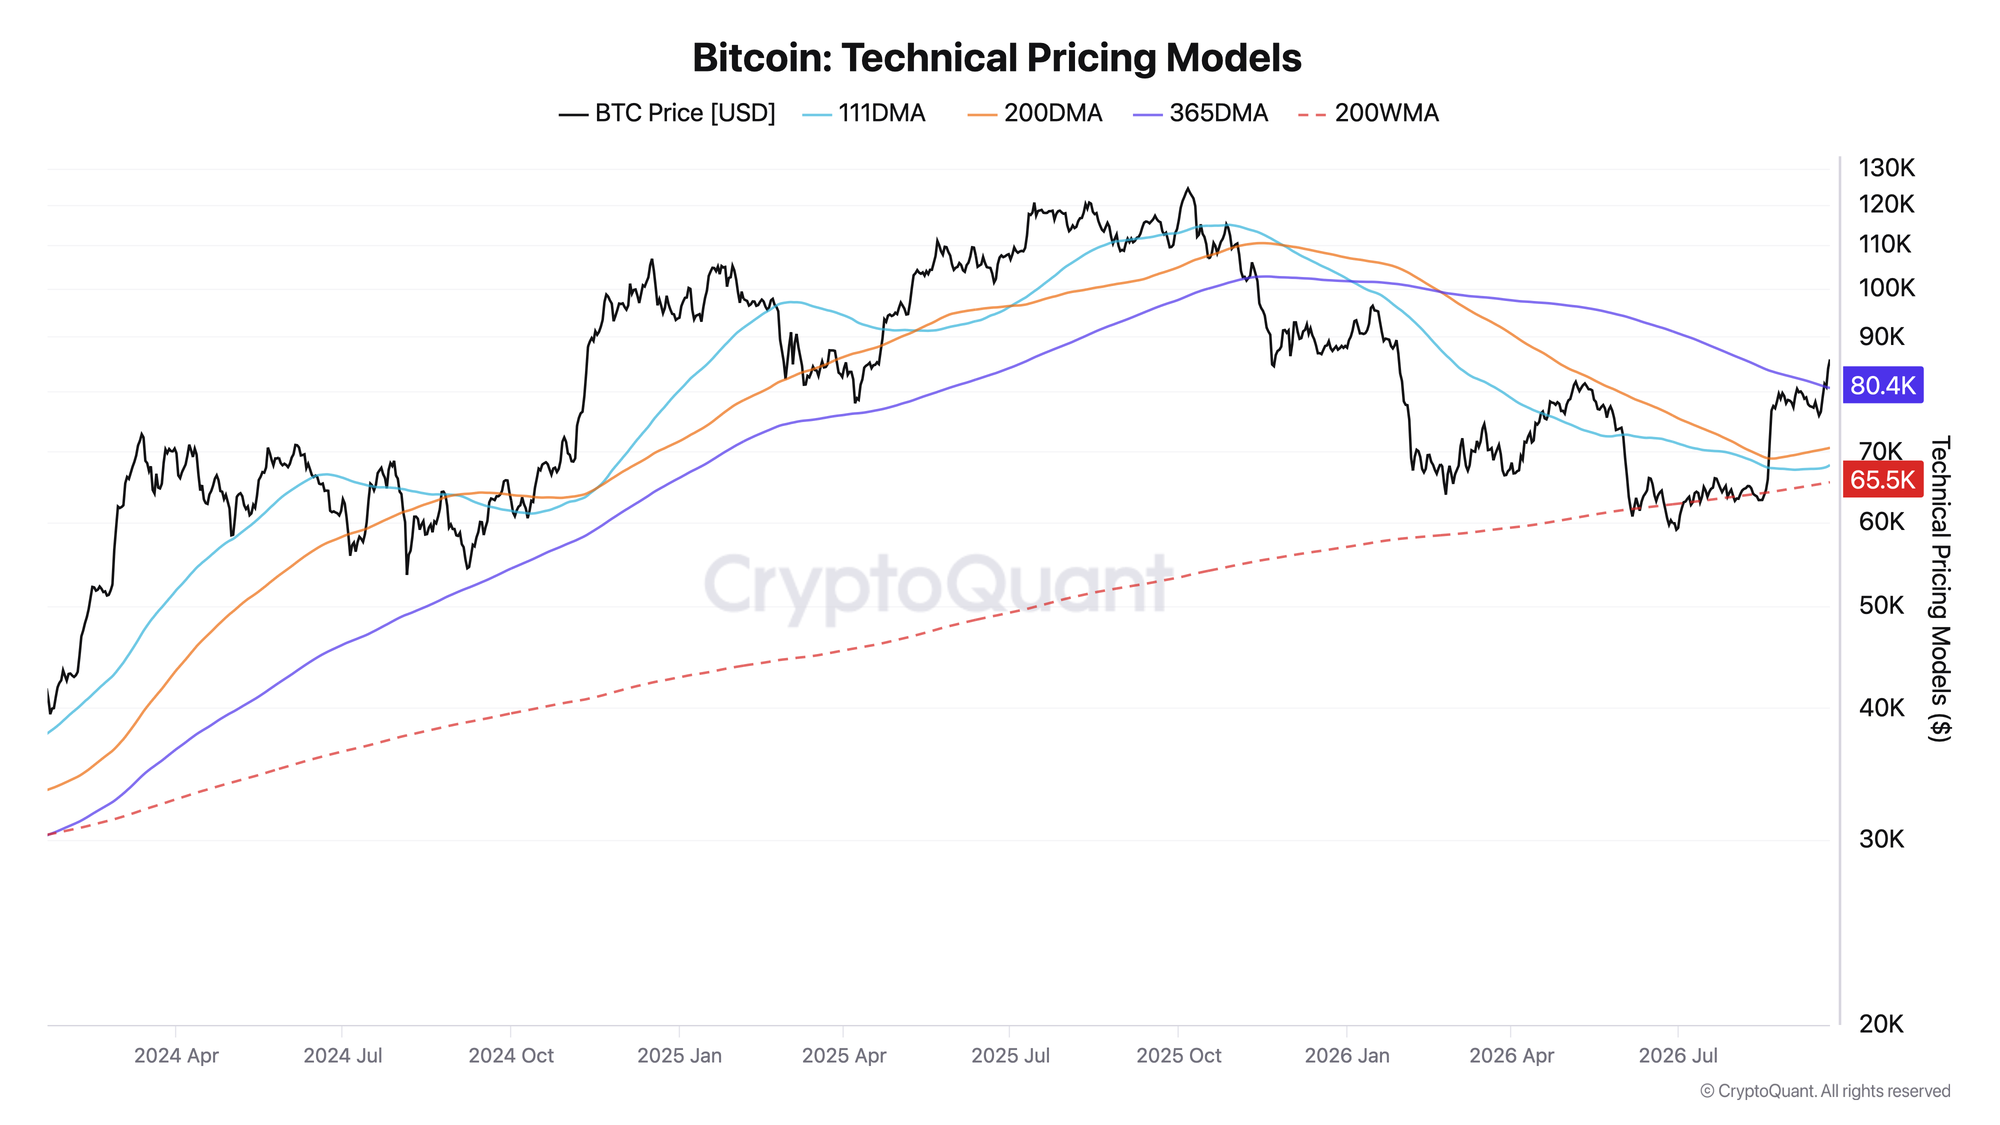
As of September 22, bitcoin is 6.4% above the 365-day average, which stands at $80.5K. Before September 19, the price was last above it on November 12, 2025. The yearly average has been falling all year, from $101.7K on January 1, so the crossover came both from the price rising and from the average itself declining. Below sit the 200-day ($70.6K), 111-day ($68.0K), and 200-week ($65.5K) averages.
The key level to watch is $80.5K. As recently as September 20, the price was only 0.05% above it. If bitcoin drops below it, the price will again be below the average level of the past 12 months, and the breakout will prove false.
FAQ
Does Trend Pulse bull mode mean the rally will continue? The indicator shows that the price is higher than two weeks ago and that the monthly average is above the 200-day average. It describes the current trend and does not forecast the price.
Why is the 111-day average below the 200-day average if the market is rising? It covers the period since early June, when bitcoin fell as low as $59K. Averages react with a lag, and the rally since late August has not yet lifted it above the 200-day average.
Conclusion
Bitcoin is above all four averages, and Trend Pulse is back in bull mode. Holding above $80.5K will confirm the move above the yearly average. The main risk is a drop back below $80.5K and into the $76-79K range. In that case, the breakout will prove false, and the indicator will return to neutral mode.
Live Charts
Explore the metrics behind this brief with live, auto-updating charts:
Bitcoin Analysis Framework - Multi-layer decision stack for cycle position, participant behavior, and momentum timing.
Realized Price - Aggregate on-chain cost basis compared with BTC price and long-term trend.
MVRV Ratio - Market value vs realized value to identify valuation regimes and cycle risk.
Fear & Greed Index - Composite market sentiment for risk appetite and sentiment extremes.