
TL;DR
- What it is: Long spot BTC + short equal notional in BTC perpetual swap. Net price exposure = zero.
- How it earns: Funding payments flow from long perp traders to short perp traders (you) every 8 hours when market is net long.
- What positive FR means for you: Each positive funding day, you collect. What negative FR means: you pay out instead.
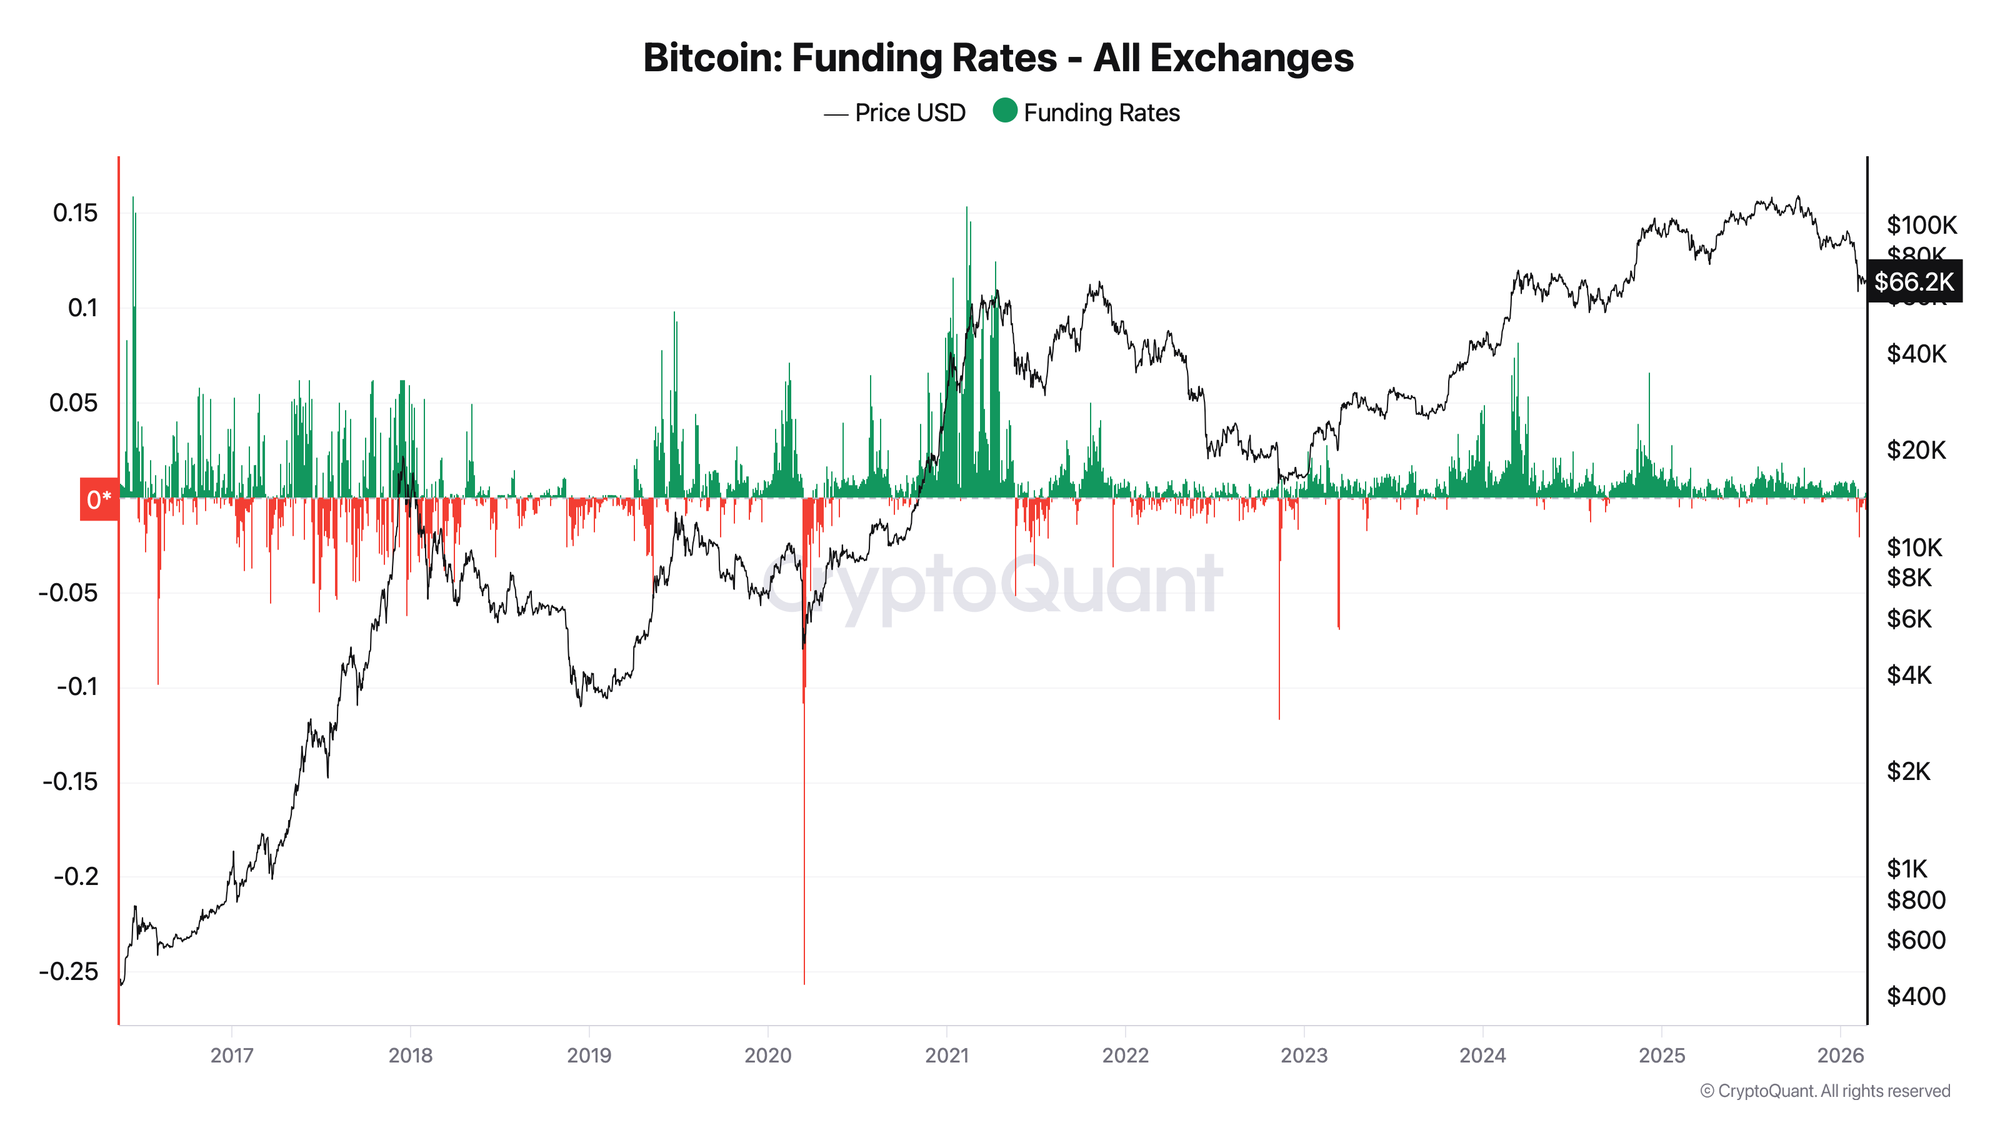
- Main practical result: +254.3%/year mean annualized on the funding leg from 3,572 days of data (May 2016 - Feb 2026). Two losing years out of ten (2018: -44%, 2022: -14%).
- Context caveat: These are gross funding figures before fees, taxes, and execution costs. Real-world net yield in sustained positive environments: 15-40% annualized.
- Signal rule: Enter when FR has been positive for 3+ consecutive days after a negative streak. Exit when FR is negative for 3+ consecutive days, or drops below -1.0%/day on any single day.
The Signal Rule
Enter: FR (daily aggregate, all exchanges) > 0 for 3 consecutive days after a negative period, OR any sustained positive period where FR > +0.1%/day.
Exit (standard): FR < 0 for 3 consecutive days.
Exit (emergency): FR drops below -1.0%/day on any single day. This threshold has historically preceded extended negative regimes. In the full dataset, 280 out of 3,572 days (7.8%) fell below -1.0%/day - and these cluster tightly around major crash events.
If X, then Y:
- FR > +1.0%/day sustained → excellent carry environment, hold, size at full target
- FR turns negative for 1 day → do not exit, this is noise (25.9% of all days are single-day negative)
- FR < -1.0%/day on any single day → review immediately, prepare exit
- FR < -3.0%/day → exit both legs immediately regardless of prior trend
Key Definitions
Delta-neutral: Portfolio with zero net price sensitivity. A $1,000 BTC price rise gains $1,000 on spot, loses $1,000 on the short perp. Price P&L cancels. Only income source: funding.
Funding rate (daily aggregate): Sum of three 8-hour funding events across all exchanges. At the historical mean of +0.697%/day, each 8-hour rate is approximately +0.232%/8h - well above Binance's standard "neutral" rate of +0.01%/8h.
Basis: Perp price minus spot price. Positive basis (perp > spot) = longs pay shorts = you collect. Negative basis (perp < spot) = shorts pay longs = you pay out.
Capital allocation: The strategy requires approximately 2x capital versus a directional trade. To run $100,000 notional delta-neutral, you need ~$50,000 in spot BTC + ~$50,000 in USDT margin collateral on the perp side.
Negative carry: When FR < 0, the short perp owes funding to longs. The carry leg is now a liability. If sustained negative carry exceeds your opportunity cost, rational action is to close.
How to Interpret Funding Rate for This Strategy
Bullish carry (FR > +0.5%/day): Ideal. Longs are dominant, perp trades at premium, your short collects every 8 hours. In 2021, this environment produced +738.3% annualized on the carry leg. Hold full position, compound receipts.
Neutral carry (FR +0.1 to +0.5%/day): Solid. Even at +0.3%/day, the annualized carry is ~109% - above T-bill rates in any historical year we have data for. In 2024, the ETF era compressed FR to this range more frequently, and the year still delivered +430.6% total.
Marginal carry (FR 0 to +0.1%/day): Evaluate costs. Annualized at +0.05%/day = ~18%/year. Still above risk-free, but transaction costs and rebalancing friction begin to matter. No exit needed - monitor closely.
Negative carry (FR < 0): Carry leg is losing money. Decision depends on duration and depth. A single negative day is normal (25.9% frequency historically). Three consecutive days signals a regime shift. Below -1.0%/day on a single day is an emergency signal regardless of duration.
What matters most: Trend and duration, not single-day level. FR declining from +0.8% to +0.3% over 5 days is more concerning than FR holding steady at +0.3% for 10 days. Watch the direction, not just the number.
Historical Examples: What Worked, What Didn't
Example 1: 2021 Bull Market - Maximum Carry (+738.3%/yr)
The best year on record for this strategy. Mean FR: +2.023%/day. Only 65 negative days (18% of the year) with no single streak exceeding 12 days.
Key data points:
- Jan 1, 2021: FR +1.106%/day, BTC $29,413
- Jan 15, 2021: FR +7.639%/day, BTC $36,755 - a single day at this level paid more than a full year's T-bill yield
- Mar 30, 2021: FR +8.604%/day, BTC $58,786 - peak of the spring rally
Why it worked: Persistent long-side dominance throughout the year, OI growing steadily. The strategy had no extended negative streak to force an exit. A trader entering January 1 and following the 3-day exit rule never had to close - the longest negative streak was 12 days (Jun 16-27) with cumulative -19.97%.
Caution from this example: At FR > +5%/day, liquidation risk on the short perp rises sharply. If BTC rallies 15% in a single session, a margin call on the short can force closure before you can sell spot to cover. The highest-yield moments are also the highest-operational-risk moments.
Example 2: 2022 Bear Market - Strategy Breaks (-14.4%/yr)
The second worst year in the dataset. Two distinct events drove most losses.
LUNA/3AC (May-June 2022): FR dropped to -1.104%/day on May 12 and -1.362%/day on June 14 (the deepest single day of the period). BTC fell from $38,000 to $18,000 across two months. The 3-day consecutive exit rule would have triggered around May 14 before the deepest losses. Anyone who held through June paid out carry daily while also watching their spot position decline (hedged by the perp gain, but psychologically costly).
FTX (November 2022): FR was +0.787%/day on November 7. Then: Nov 9: -3.021%/day, Nov 10: -11.670%/day, Nov 11: -6.734%/day. The emergency -1.0%/day exit rule would have triggered on November 9 at latest. FR stabilized to +1.003%/day on November 16 - the strategy was resumable within 8 days of the collapse.
What the year demonstrated: The strategy cannot be fully hedged against sudden exogenous shocks. The -1%/day rule limits damage but does not prevent all losses from gap events. FTX had no advance on-chain warning in funding data.
Example 3: 2024 ETF Era - Structural Improvement (+430.6%/yr)
Only 17 negative funding days in 366 (4.6%). This is the structural shift the ETF era created: spot ETF demand flows through the spot market, not derivatives. This creates a persistent floor under the basis without adding OI that would require funding to clear.
March 11, 2024: FR peaked at +8.224%/day when OI hit $17.95B during the run to the $73,777 ATH on March 14. This was the highest post-2022 single-day carry. The ETF era did not eliminate extremes - it primarily compressed the frequency of negative periods.
Signal from 2024: If negative day frequency below 10%/year becomes the new norm, the 3-day exit rule may be overly conservative. A 5-day threshold may be more appropriate for current market structure.
How to Use It in Practice
Setup 1: Standard Entry (Positive Carry Environment)
- Setup: FR has been positive for 5+ consecutive days. Market in Q1 (OI up, FR positive) per the 4-quadrant framework.
- Trigger: FR > +0.3%/day for 3 consecutive days.
- Confirm: Basis (perp minus spot) is positive at the moment you execute both legs. You want to sell the premium, not the discount.
- Action: Buy spot BTC on Coinbase Advanced / Kraken. Simultaneously open short BTC-USDT perpetual on Binance / Bybit / OKX for same notional. Execute both within 60 seconds to minimize basis gap risk. Use USDT (not BTC) as margin on the short leg.
- Invalidates when: FR below 0 for 3+ consecutive days, or single day below -1.0%/day.
- Time horizon: Weeks to months. Not intraday.
Setup 2: High-Conviction Entry (After Negative Streak Resolution)
- Setup: FR just turned positive after a 5+ day negative streak. This has occurred 52 times since 2016.
- Trigger: First positive FR day after 5+ consecutive negative days.
- Why this is optimal: The negative streak has flushed leveraged longs, OI has reset. The transition from Q4 (capitulation) or Q2 back to Q1/Q3 is the cleanest entry point.
- Action: Enter at 50-75% of target size on day 1. Add remaining on day 3 of confirmed positive FR.
- Real example: Feb 6-17, 2026 = 12 consecutive negative days. Feb 18: FR turned to +0.065%/day. Feb 19: +0.327%/day. Textbook Setup 2 entry.
Setup 3: Emergency Exit Protocol
- Trigger: FR drops below -1.0%/day on any single day.
- Action: Close the short perp immediately. Hold spot if you have a separate directional conviction. The delta-neutral strategy is suspended.
- Resume signal: FR returns to positive for 3+ consecutive days after the negative event.
Common Pitfalls
1. Entering both legs with a time gap Buying spot first, opening the short 30 minutes later means you are directionally exposed during that gap. In high-volatility periods, BTC can move 2-3% in minutes. Execute both legs simultaneously. Accept a small market-order cost to avoid the exposure gap.
2. Using spot BTC as perp margin Posting your spot holdings as collateral on the perp exchange creates a liquidation risk cascade: if BTC spikes and the short perp is marked to loss, the exchange sells your spot collateral. You lose both legs simultaneously. Always use USDT as margin on the short perp. Keep the spot position on a separate custodian if possible.
3. Anchoring to gross yield figures The +254.3%/year mean in raw funding data looks like the strategy's yield. It is not. Subtract: exchange fees on entry and exit (0.02-0.05% per leg), rebalancing costs when BTC price diverges, opportunity cost of capital locked in the margin account. Real net yield in positive environments: typically 15-40% annualized. Still exceptional, but a different number.
4. Holding through extended negative streaks The 2018 worst streak: 34 consecutive days, -30.5% cumulative carry. The 2020 COVID streak: 21 days, -104.7% cumulative (this extreme was driven by -25.7%/day on March 13). Anyone holding through these without applying the exit rule turned a carry strategy into a liability. The 3-day rule is non-negotiable.
5. Concentrating on a single exchange FTX (November 2022) locked spot and derivatives on the same platform simultaneously. A trader with both legs on FTX had their spot frozen and an uncovered short that required emergency action. Best practice: spot custody on one regulated entity (Coinbase, Kraken), perp on a separate derivatives exchange.
6. Applying pre-2024 exit rules post-2024 In 2022, negative days occurred 41% of the year. In 2024, only 4.6%. A 3-day exit rule calibrated for 2022 will trigger false exits frequently in the current structural environment. Consider adjusting to 5-day exit threshold for 2024+ conditions, while keeping the single-day -1.0% emergency rule unchanged.
Cash-and-Carry vs Related Strategies
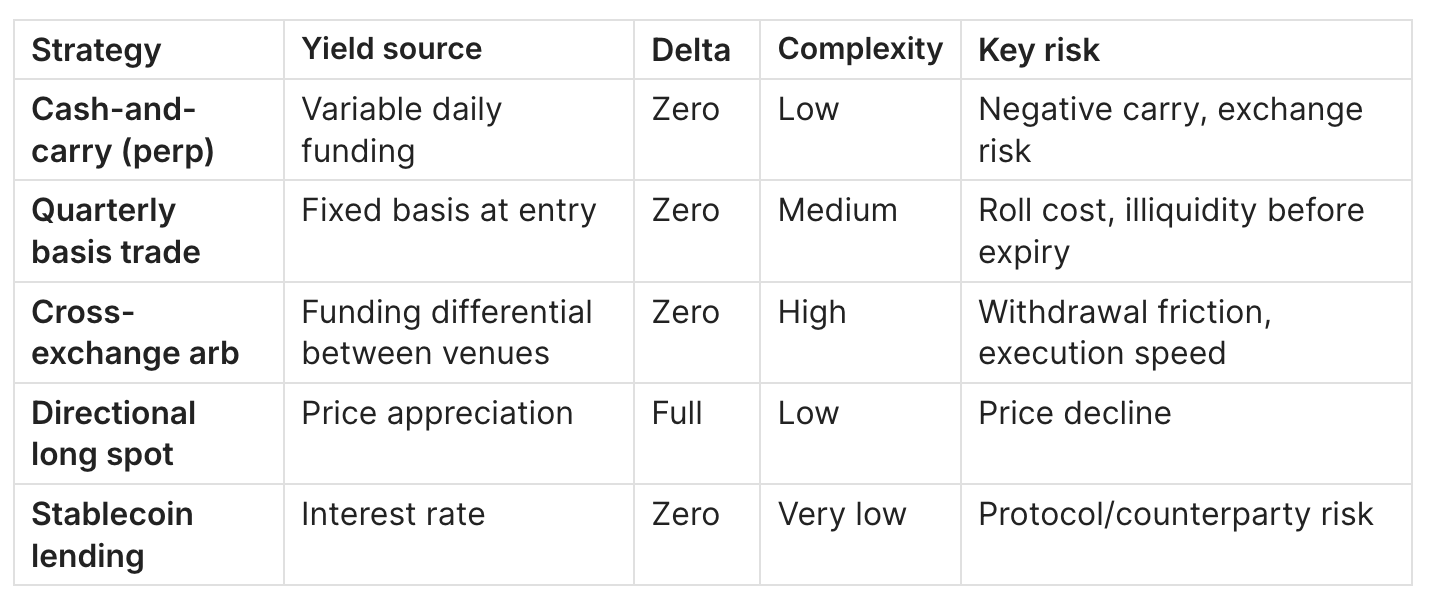
The key practical difference between cash-and-carry via perp vs quarterly basis trade: the perp version is flexible (exit any day, capture daily rate) but carries negative FR risk. The quarterly basis trade locks in a known annualized yield at entry (10-35% in recent bull markets) but cannot exit early without crystallizing a loss. Institutional desks typically prefer quarterly basis for predictability; active traders prefer the perp version for higher potential yield and flexibility.
FAQ
How much capital is needed? No theoretical minimum, but economic minimum around $10,000-50,000 total. Below $10,000, transaction costs eat most of the carry. Above $50,000 in most market conditions, the strategy becomes economically meaningful.
Do I need to rebalance? Periodically, yes. If BTC moves 20%+ from entry, the spot leg value diverges from the perp notional. You are no longer delta-neutral. Rebalance monthly in stable markets, weekly if BTC is moving >10% per week.
What if the short perp gets liquidated? You are now fully long spot with no hedge. Close the spot as quickly as possible or accept the directional exposure explicitly. Prevention: use conservative notional on the short (80-90% of spot value), not 100%.
Is funding income taxed? In most jurisdictions, funding receipts are ordinary income, not capital gains. Tax at marginal rates rather than long-term capital gains rates. A 40% marginal rate on a +100% gross carry year = +60% net. Still excellent, but materially different from the gross figure.
Does this work for altcoins? Yes, and altcoin funding rates are often higher. But risks are proportionally greater: lower spot liquidity, more volatile funding, thinner OI means your position can move the rate itself. BTC is the cleanest implementation by liquidity depth and data reliability.
What happened to the strategy during 2025 and 2026 early? 2025 delivered +208.5% on the funding leg with only 32 negative days (8.8%). Current 2026 data through February 23 shows a significant February deleveraging (12 consecutive negative days Feb 6-17, cumulative -5.32%) followed by a recovery signal on Feb 18-19. The strategy exited in early February per the 3-day rule and re-entered on the turn.
Where do I track funding rates? CoinGlass (coinglass.com) for real-time cross-exchange view. CryptoQuant for historical data and SQL access. Adler AM (axeladlerjr.com) for daily derivatives briefings covering FR, OI, and on-chain signals together.
What to Remember
- Cash-and-carry earns the funding rate structurally - not by predicting prices. The edge exists as long as Bitcoin derivatives markets are net long (74.1% of historical days).
- The strategy has two distinct failure modes: sustained bear markets (2018, 2022) and sudden exogenous shocks (FTX Nov 2022). The 3-day exit rule catches the first; the -1%/day emergency rule limits damage from the second.
- 2024 marked a structural shift - ETF-era demand has compressed negative day frequency to under 5% annually. The strategy has improved, but the exit rules remain important because extremes still occur.
Next step: Bitcoin Open Interest and Funding Rate: The Combined Framework - use OI alongside FR to identify the highest-conviction entry setups for this strategy.
Related Guides
- Bitcoin Funding Rates: Definition, Formula & Cycle Signals - the complete mechanics of funding rate calculation, zone thresholds, and cycle history that underlies this strategy
- Bitcoin Open Interest and Funding Rate: The Combined Framework - how OI + FR together identify optimal entry conditions (Q4 exit = best Setup 2 entry point)
- Bitcoin Open Interest vs Price: 4 Divergence Patterns Every Trader Must Know - companion reading for reading derivatives market structure before entering the strategy
Read daily funding rate and derivatives analysis for free: Adler AM - morning brief covering FR, OI, and on-chain signals every day.
Institutional-grade depth: Adler Premium - weekly deep analysis, SQL models, early signals before they become consensus.
Data: CryptoQuant All Exchanges Funding Rates (daily aggregate) and Coinbase Advanced BTC/USD (daily close). All yield figures represent the funding leg of a theoretical delta-neutral position before transaction costs, taxes, and execution slippage. Not financial advice.