


Over the past week, bitcoin fell from $79K to $76K. The index, which tracks futures activity and price movements, remains weak.
TL;DR
The futures market has yet to show a confirmed sign of recovery, and bitcoin continues to decline.
Bitcoin Futures Flow
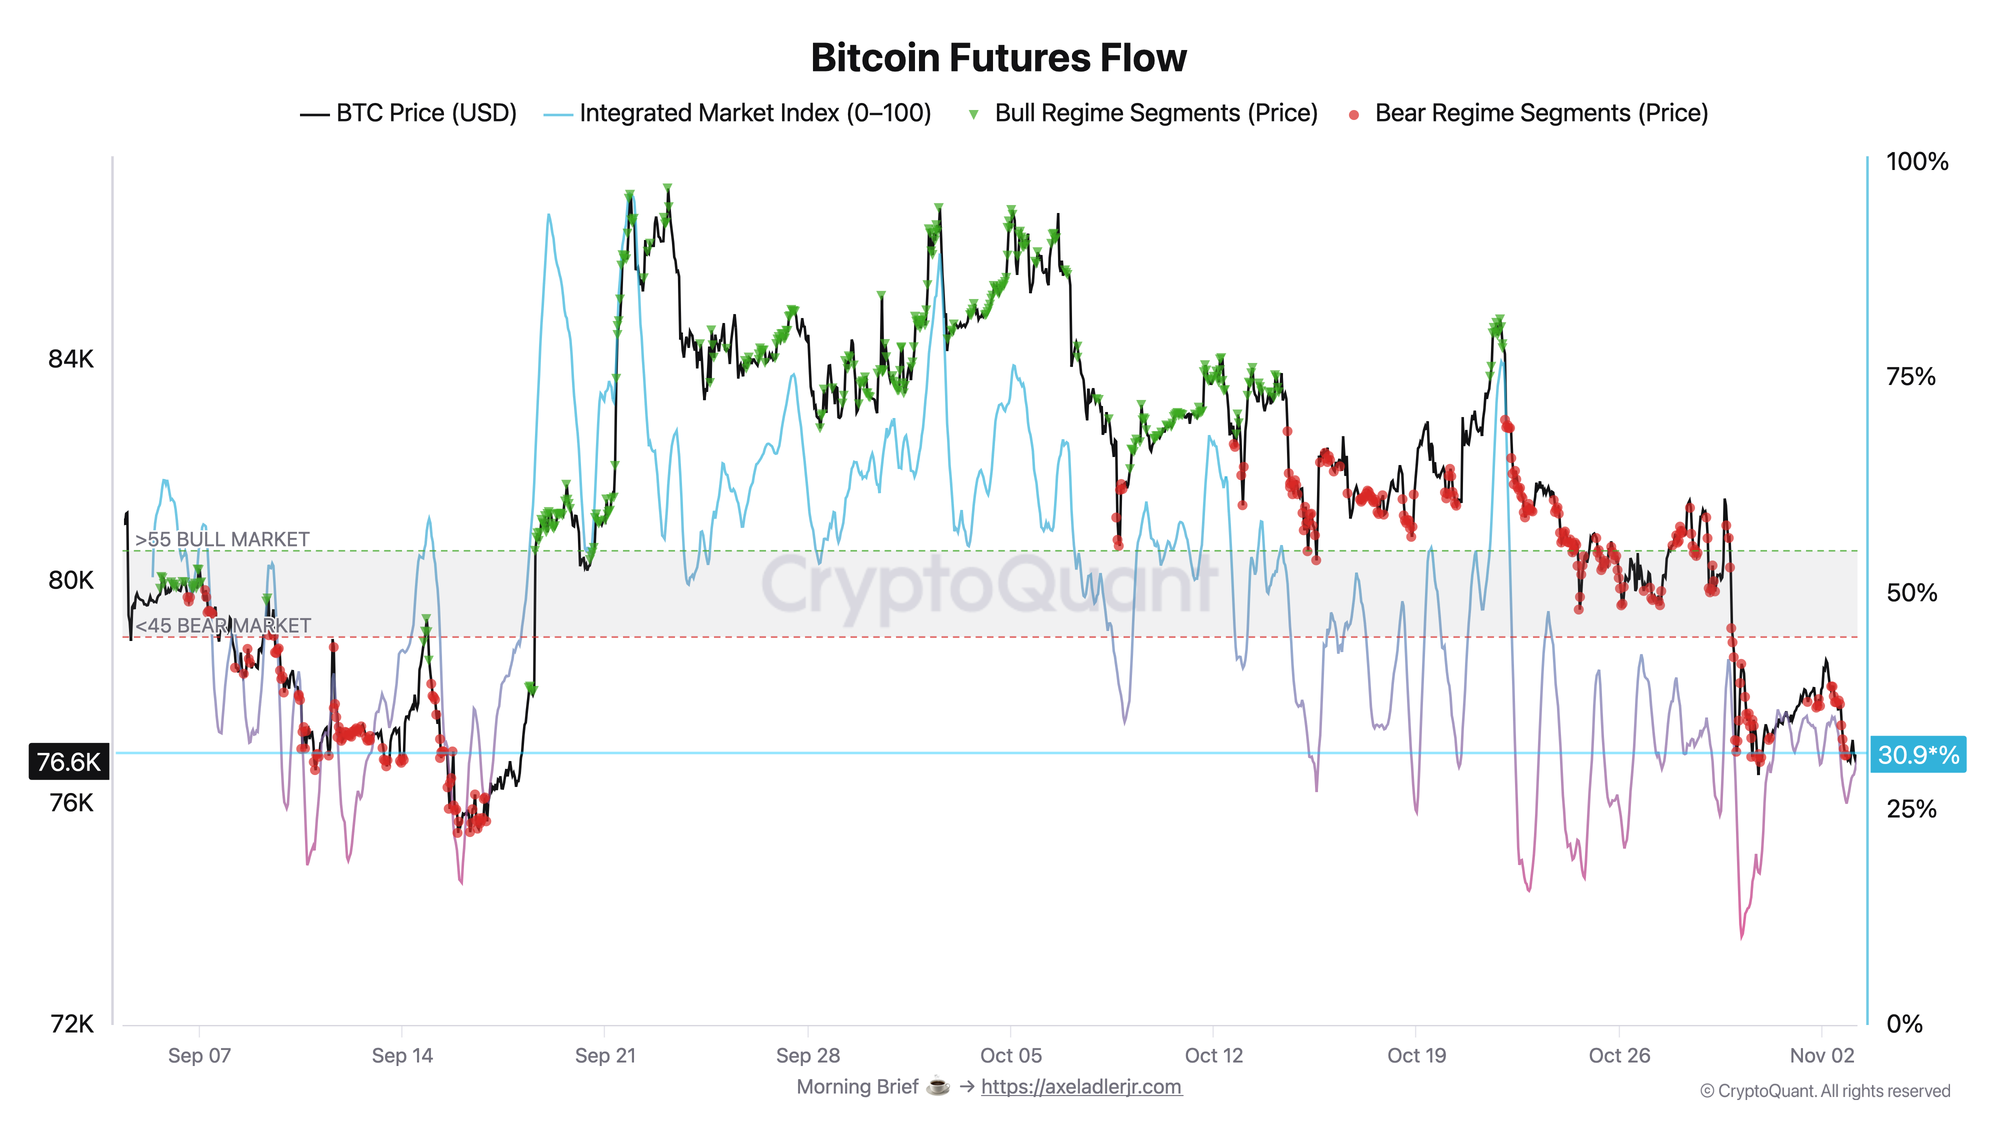
The chart helps assess whether futures activity supports bitcoin's price movement. It accounts for market buys and sells, changes in open interest, and the price itself. The index currently stands at 30.9 points, compared with 32.7 a week ago, and has remained below the 45 threshold since October 23.
After falling to 25 points on November 2, the index began to recover, but the price declined over the same period. A move back above 45 would indicate that the negative signal is weakening. A more convincing improvement would require the index's recovery to be accompanied by a rise in price.
Bitcoin Price Index + Fair Value
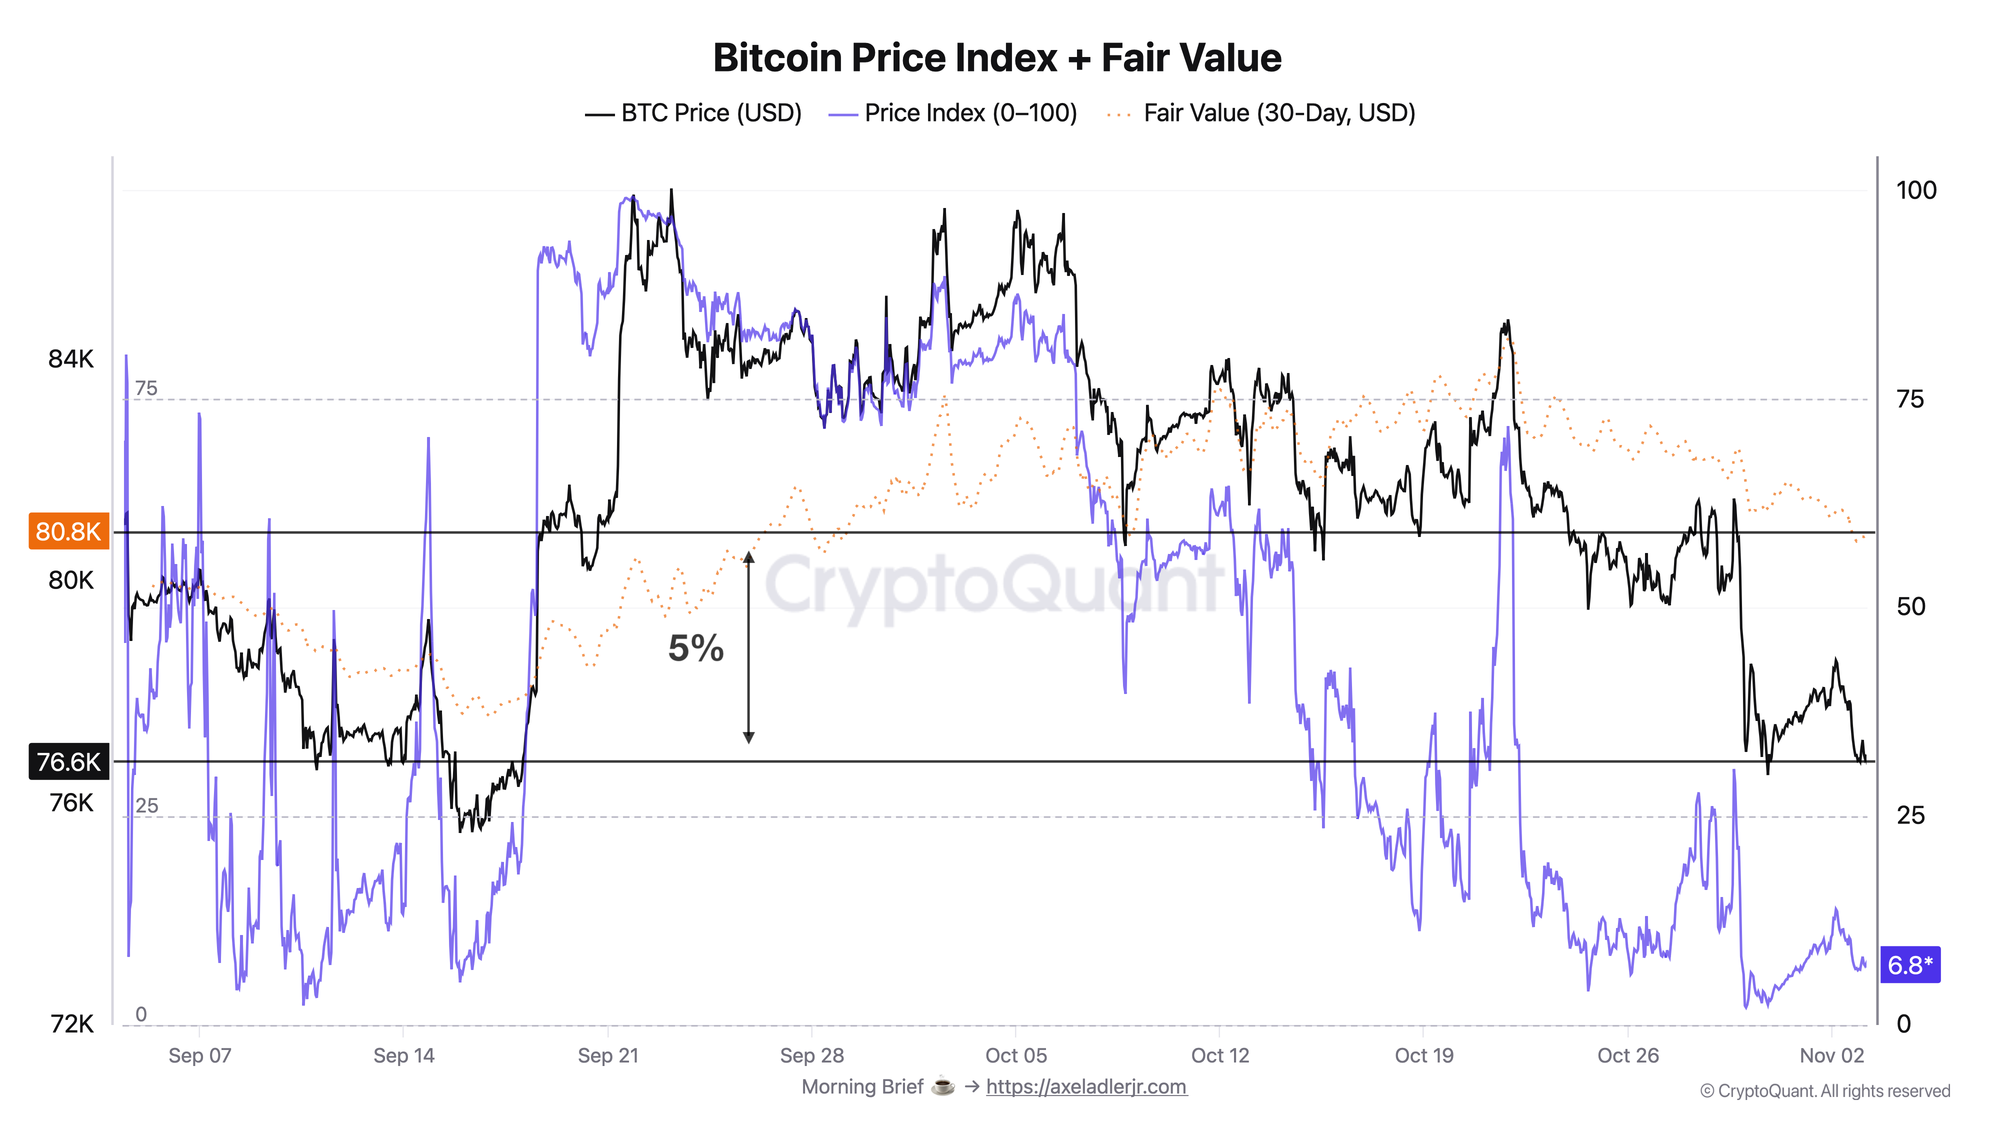
This chart shows how far the current price has deviated from its 30-day averages. The index fell from 12 to 6 over the past day, with 50 marking the neutral level. Bitcoin remains well below its 30-day average.
The calculated Fair Value line stands at $80,850, while the price is $76,696. The gap is 5.1%, compared with 3.2% a week ago. The price is falling faster than the model's estimate. A narrowing of this gap driven by a rise in bitcoin's price would indicate improvement.
FAQ
What does a low futures index reading show? The combination of price movement and futures activity remains weak. A rise in both the index and the price would indicate improvement.
How should Fair Value at $80,850 be interpreted? It is a calculated reference level based on the past 30 days of data. Bitcoin currently trades 5.1% below it, and the reference level itself changes as the data updates.
Conclusions
The futures market index remains below 45 in bearish territory. Bitcoin's price continues to decline and sits 5% below the model's calculated reference level. A move back above 45 in the index, accompanied by a rise in price, would indicate improvement. So far, the recent rise in the index has not been accompanied by a recovery in bitcoin's price.
Live Charts
Explore the metrics behind this brief with live, auto-updating charts:
Open Interest (BTC) - Total futures positioning and 7-day BTC-denominated change.
Funding Rates - Perpetual futures funding to track long-side or short-side leverage pressure.
Coinbase Premium Index - Coinbase vs global market premium as a proxy for US spot demand pressure.