


Over two hours overnight on October 7, Bitcoin fell from $85.5K to $83.9K. The decline was accompanied by a dominance of market sell orders and long liquidations.
TL;DR
Bitcoin’s overnight decline was accompanied by increased market selling and forced closures of long positions. We examine whether this was a one-off shakeout or the start of more sustained pressure.
Bitcoin Taker Order Pressure Oscillator
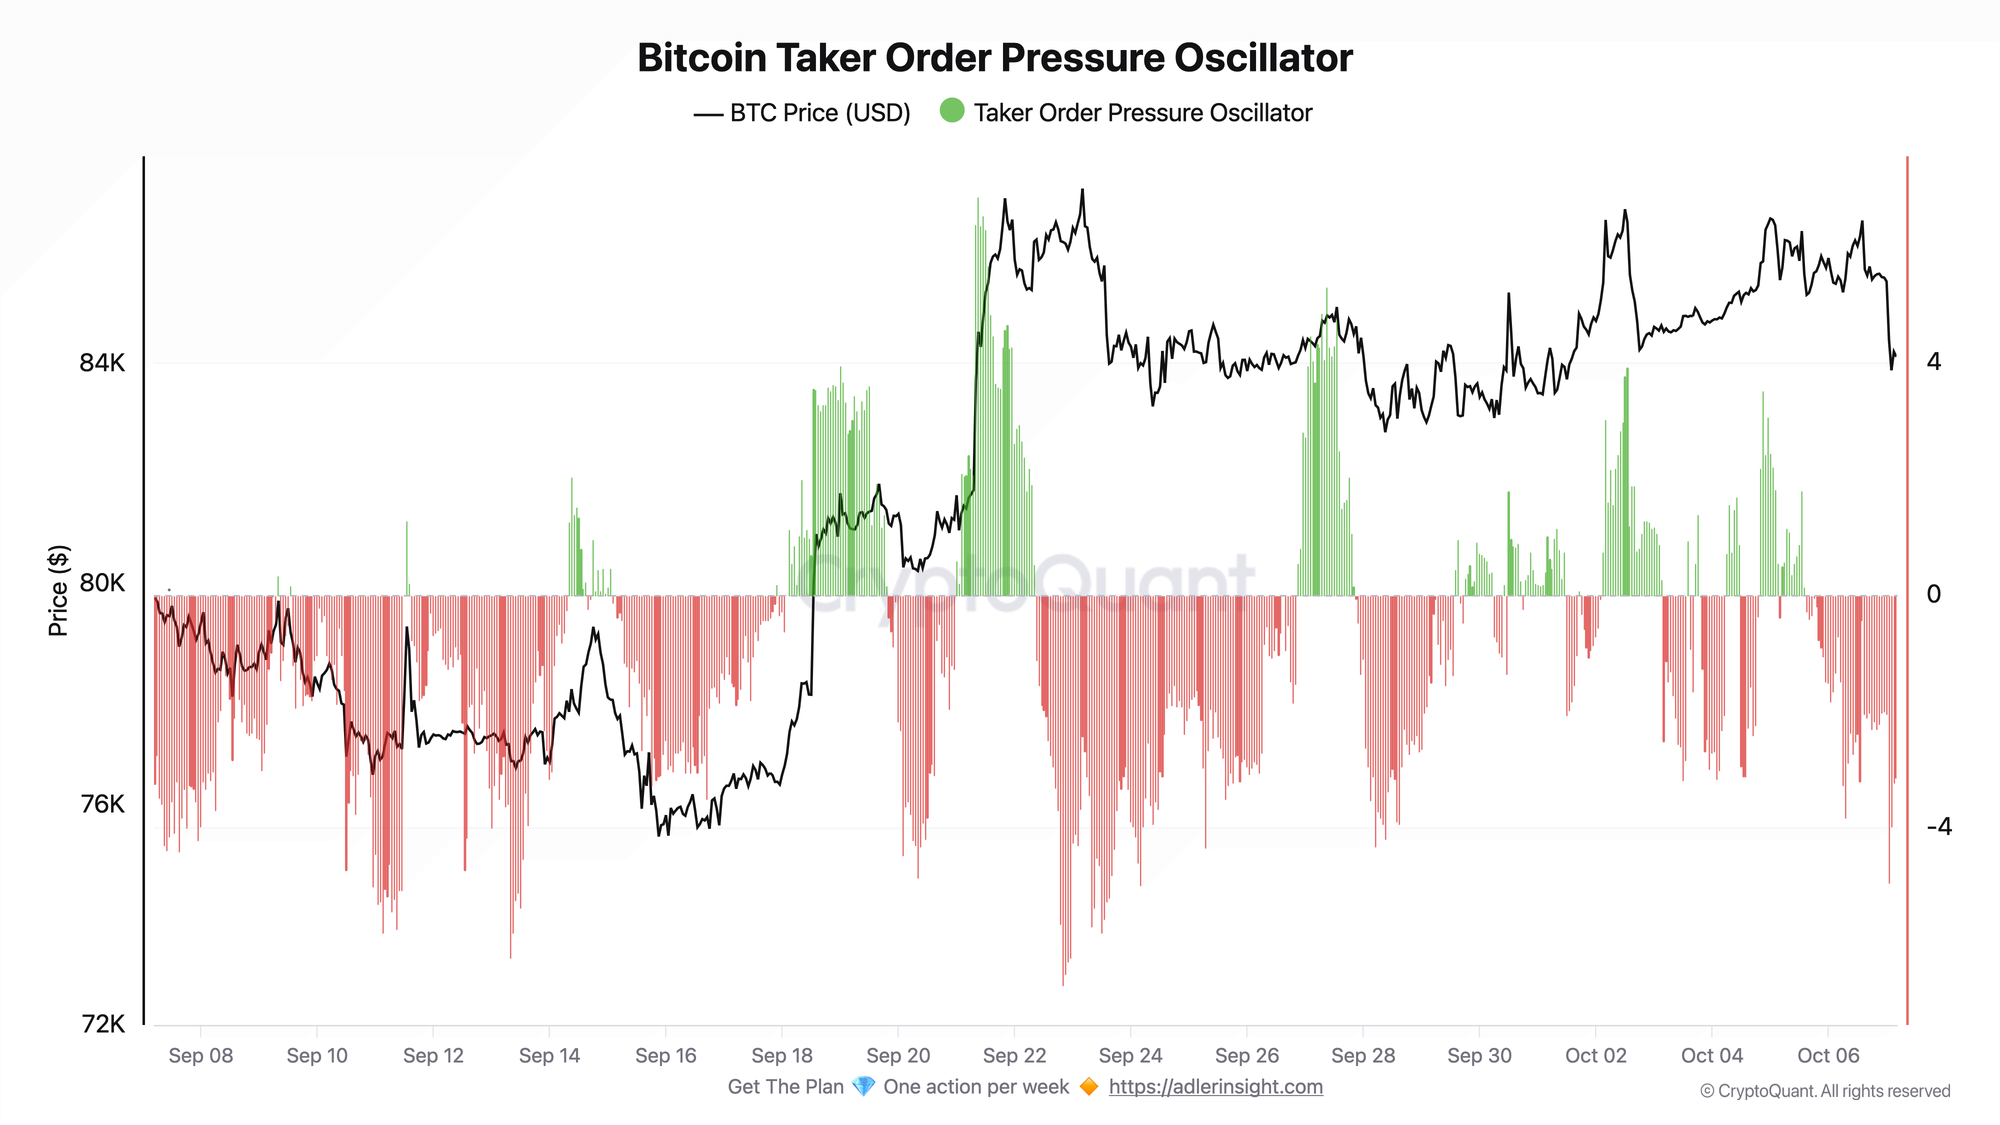
By 02:00 UTC on October 7, Bitcoin had fallen to $83.9K. An hour earlier, the Taker Order Pressure Oscillator had dropped to -4.9, indicating that market selling significantly outweighed market buying. A week earlier, the reading was around +0.7: buyers had a slight edge.
By 04:00 UTC, the price had recovered to $84.1K, and the oscillator had risen to -3.1. Sellers retained the upper hand, but their pressure had eased. A return to zero would indicate that market selling and buying pressure had balanced out.
Bitcoin Liquidation Pressure Oscillator
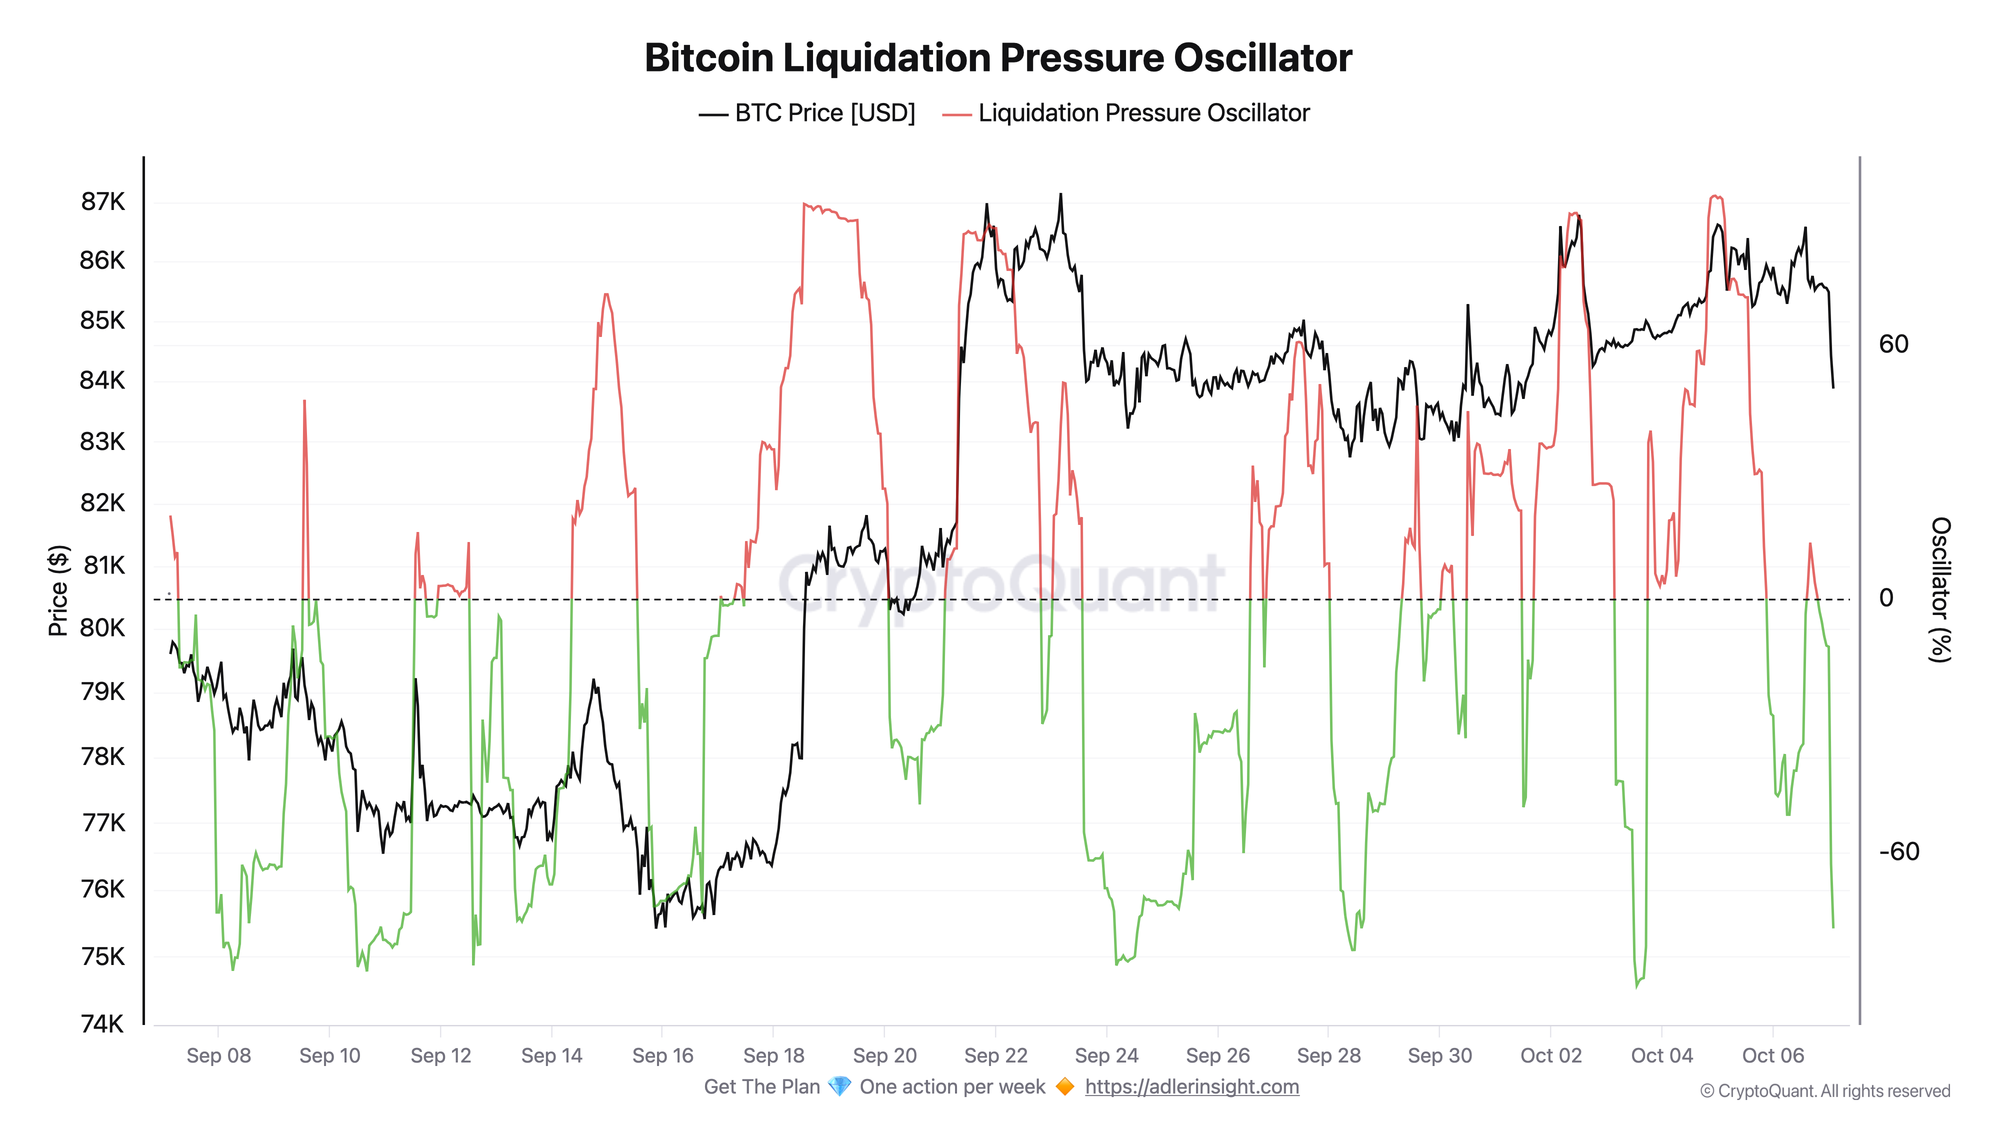
The Liquidation Pressure Oscillator fell from -11 to -78 overnight. The deeply negative reading indicates that long liquidations predominated, as falling prices forced the closure of positions held by traders betting on a rise. A week earlier, the reading was +8.
This was not the month’s low. On October 3, the oscillator dropped to -91, and Bitcoin rose above $86K the following day. Both indicators are linked to the same overnight market move, so their simultaneous decline should not be treated as two independent confirmations.
It would be more concerning if the price held below $83.9K and both oscillators remained deeply negative. In late September, negative readings persisted for several days as Bitcoin fell from $86.6K to $84.4K.
Your biggest Bitcoin loss may come from staying exposed after the market regime has changed. Weekly Engine tells you when to hold, reduce risk, or stay out - with clear triggers, exposure caps, and invalidation levels. Get access.
FAQ
Do liquidations mean traders are selling Bitcoin? Liquidation is the forced closure of a position when the collateral becomes insufficient to maintain it. The liquidation indicator alone does not establish that long-term or short-term holders are selling their coins.
Does a deeply negative liquidation oscillator signal the start of a prolonged decline? Such a spike alone does not confirm this. After the negative reading on October 3, the price rose above $86K the following day. What matters is how long long liquidations continue to dominate and how the price behaves.
Conclusions
After falling to $83.9K, Bitcoin partially recovered, and market selling pressure eased. A return of the Taker Order Pressure Oscillator to zero would show that sellers’ advantage had disappeared. The main risk is the price holding below $83.9K while both indicators remain negative. This would increase the likelihood of more sustained selling pressure.
Live Charts
Explore the metrics behind this brief with live, auto-updating charts:
Open Interest (BTC) - Total futures positioning and 7-day BTC-denominated change.
Funding Rates - Perpetual futures funding to track long-side or short-side leverage pressure.
Fear & Greed Index - Composite market sentiment for risk appetite and sentiment extremes.
Derivatives - All funding, open-interest, and leverage charts in one view.