
Funding Rate - a mechanism of periodic payments between longs and shorts in perpetual futures that keeps the contract price close to Bitcoin's spot price. It is simultaneously an operational cost of holding a position and one of the most accurate indicators of market sentiment in derivatives.
Last updated: April 5, 2026
Current Bitcoin Funding Rate
| Avg Funding Rate (Daily, All Exchanges) | -0.1135% |
| 7-Day Average | +0.0727% |
| 30-Day Average | -0.2153% |
| Zone | 📉 Negative — shorts paying longs, bearish sentiment dominates |
Updated April 5, 2026 · Want daily funding rate signals? Join Adler AM
TL;DR
- What it measures: The degree of imbalance between long and short positions in perpetual futures
- Key thresholds (daily aggregate, all exchanges): Neutral: +-0.1%/day; Bull overheating: >1.0%/day; Extreme: >3.0%/day; Bear overheating: <-0.5%/day
- Best use case: Contrarian filter at cycle extremes + overleverage detector
- Main limitation: Signal fails in trending markets; high funding can persist for weeks during a strong trend
- Best combinations: Open Interest, Liquidation Heatmap, CVD (Cumulative Volume Delta)
Table of Contents
- What Is Funding Rate?
- Formula
- Step-by-Step Calculation
- Interpretation Zones - with Real Data
- Historical Cycle Examples
- Practical Application
- Funding Rate vs Open Interest vs CVD
- How Funding Rate Relates to Other Indicators
- Limitations
- FAQ
- Conclusion
What Is Funding Rate?
Funding Rate - a periodic payment transferred directly between participants in the perpetual futures (perpetual swaps) market. Unlike traditional futures with an expiration date, perpetual contracts have no convergence mechanism to spot through expiry. The Funding Rate replaces this mechanism: it economically incentivizes traders to close the "overloaded" side.
In one line: Funding Rate = the cost of renting a position in the direction that pushes the market away from spot.
When most traders hold longs, the perpetual trades at a premium to spot. The Funding Rate turns positive: longs pay shorts. This makes holding a long more expensive and incentivizes some traders to close their position. When shorts dominate, the perpetual trades at a discount: the Funding Rate goes negative, shorts pay longs.
Most exchanges calculate and apply the Funding Rate every 8 hours (Binance, Bybit, OKX). Some (Hyperliquid, dYdX) - every hour or continuously.
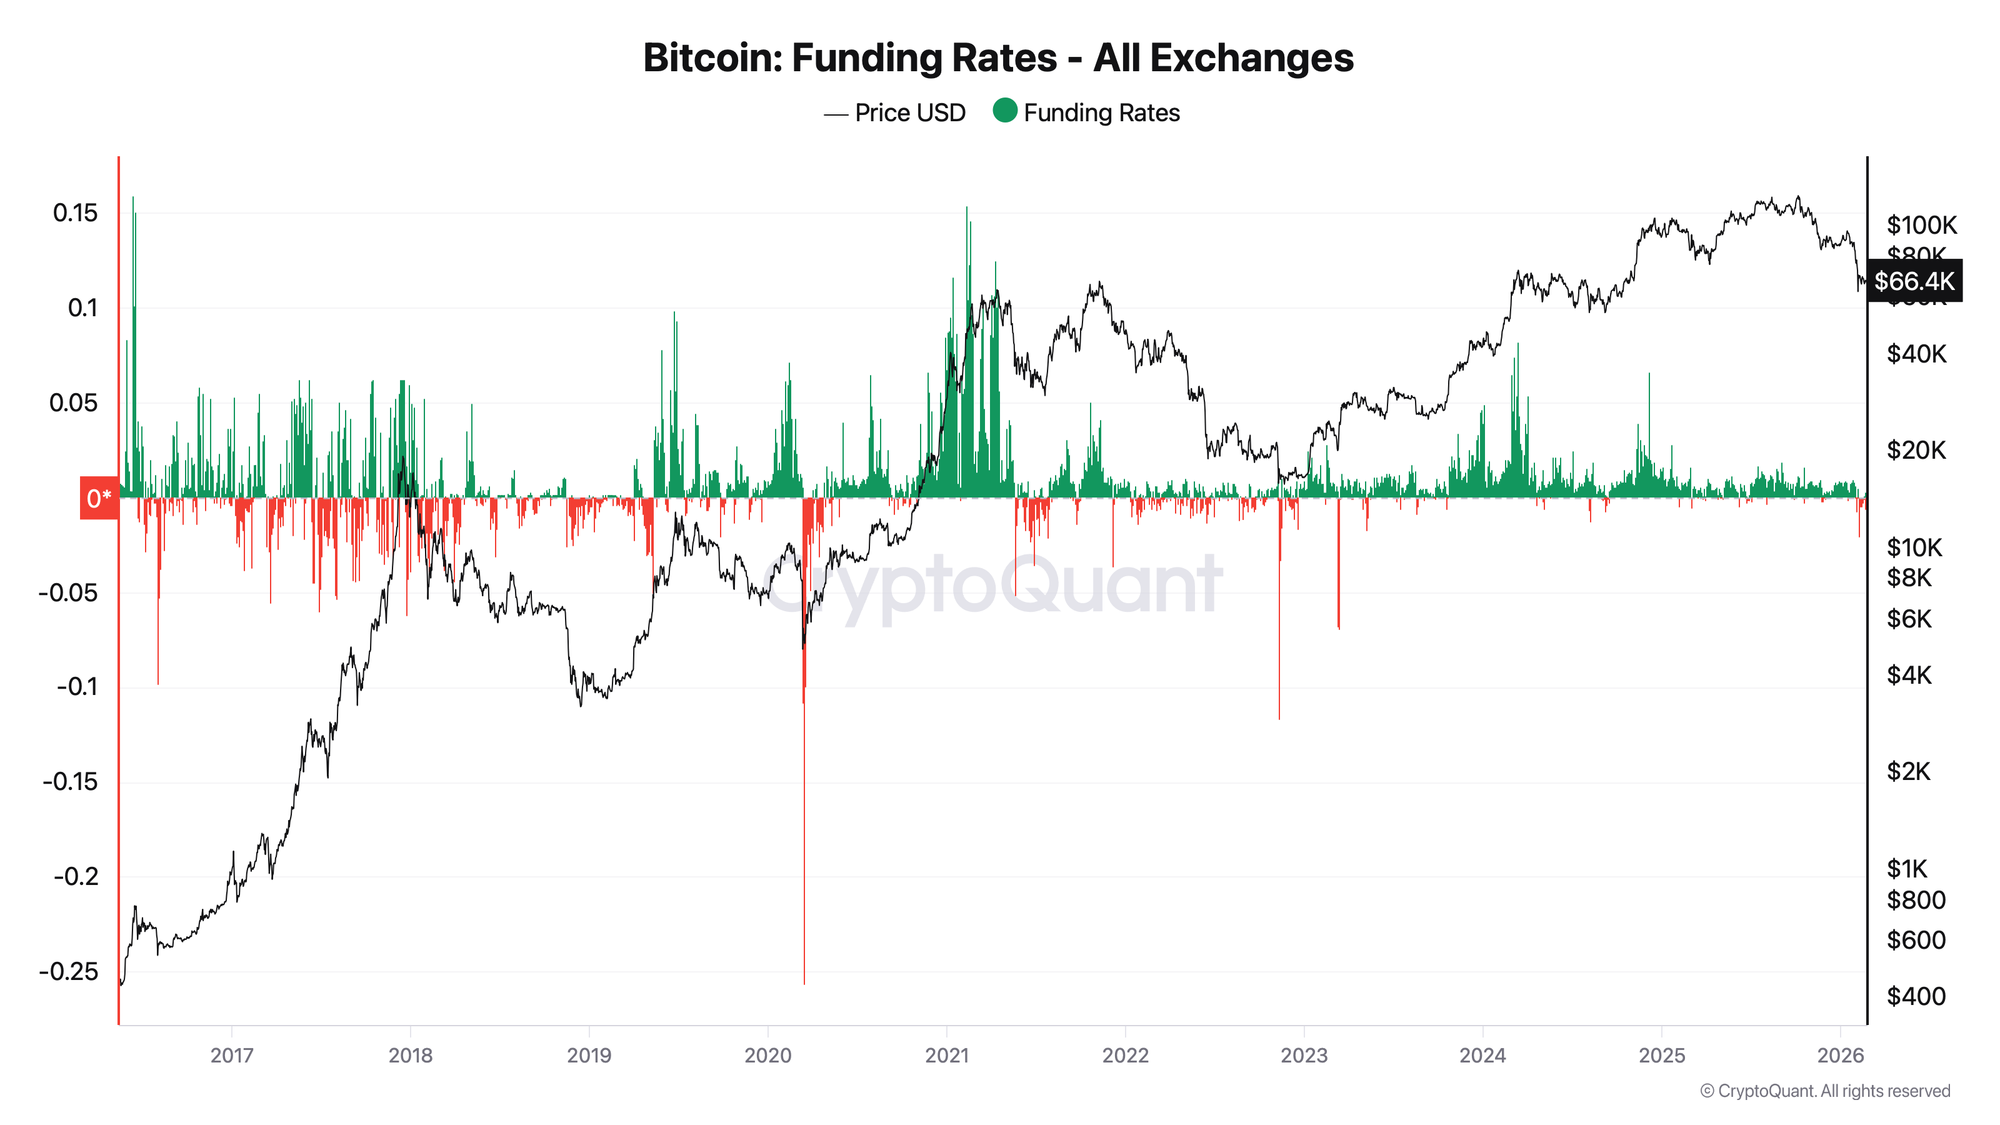
Note on data in this guide: All historical values are aggregated daily data across all exchanges (CryptoQuant All Exchanges, May 2016 - Feb 2026, n=3,572 days). Aggregated daily funding differs from the "standard" per-8h value of a single exchange. To approximate per-8h: divide by 3.
Key Concepts
Mark Price - the fair contract price, weighted across multiple spot exchanges + basis. Liquidations and funding are calculated from this price.
Index Price - the aggregated spot price of the asset from external sources.
Premium Index (P) - the difference between Mark Price and Index Price, normalized to Index Price. The main driver of the variable component of Funding Rate.
How Perpetual Swaps Differ from Traditional Futures
To fully understand why Funding Rate exists, it helps to contrast perpetual swaps with regular quarterly futures.
Traditional futures have a fixed expiry date. As expiry approaches, the contract price is forced to converge toward spot - arbitrageurs close the gap automatically. No additional mechanism is needed.
Perpetual swaps have no expiry. Without a convergence mechanism, the contract price could drift indefinitely away from spot. A perpetual trading at a 5% premium to spot for weeks would disconnect derivatives from the underlying asset entirely - making them useless for hedging and dangerous for price discovery.
Funding Rate is the engineering solution. It creates a continuous economic incentive: if the contract is above spot, longs pay shorts - applying downward pressure on the contract price. If it is below spot, shorts pay longs - applying upward pressure. The result is a self-correcting system that keeps perpetuals anchored to spot without needing an expiry date.
This is why perpetual swaps became the dominant Bitcoin trading instrument. They combine the leverage and flexibility of futures with the indefinite holding period of spot. As of 2024, perpetual swap volume on major exchanges consistently exceeds spot volume by a factor of 3-5x on active trading days.
Formula
Standard Formula (Binance / Bybit)
Funding Rate (F) = Premium Index (P) + clamp(Interest Rate - P, -0.05%, +0.05%)
Variable definitions:
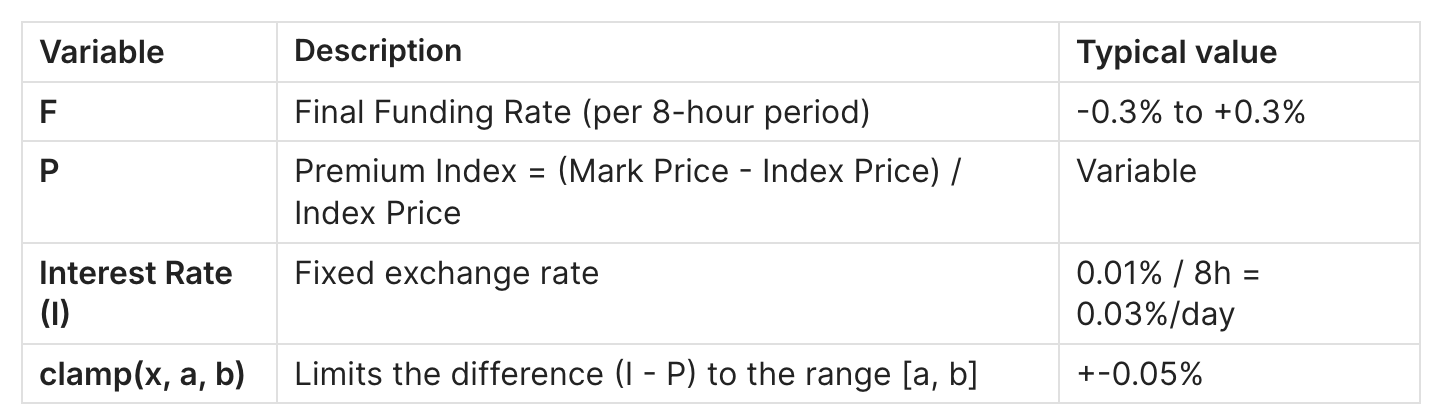
Annualized funding cost (per-8h rate):
Annual Cost = F_per8h x 3 x 365
At F = +0.01%/8h -> approx. 10.95% per year. At F = +0.05%/8h -> approx. 54.75% per year - the sustainability threshold without a strong trend.
Actual Payment
Funding Payment = Position Size x F
Example: $100,000 long position, F = +0.01%/8h -> $10 per 8 hours = $30/day = $10,950/year.
Deribit Formula (with dampener)
How Funding Intervals Vary Across Exchanges
The 8-hour interval is an industry standard but not a universal rule. Understanding the differences matters when comparing funding data across platforms.
F = max(0.025%, Premium Rate) + min(-0.025%, Premium Rate)
Capped at +-0.5% per 8h for BTC
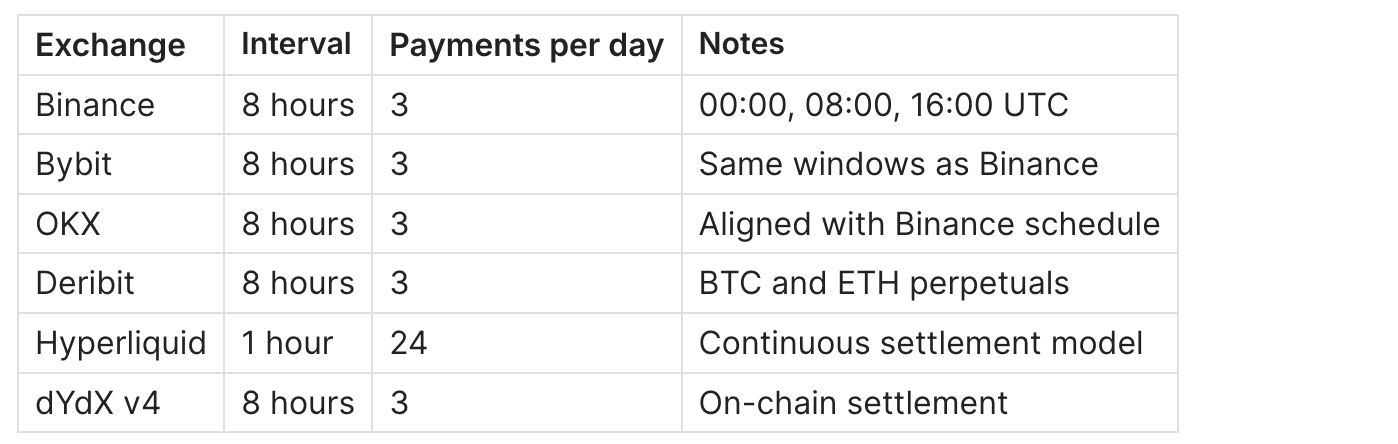
The practical implication: when comparing funding rates between exchanges, always normalize to the same time base. A Hyperliquid hourly rate of +0.005%/h equals +0.04%/8h - a direct comparison with Binance's 8-hour rate is only valid after this conversion.
Aggregated data sources like CryptoQuant and CoinGlass handle this normalization automatically, which is one reason institutional analysts prefer aggregated metrics over single-exchange values.
Data Sources
- CoinGlass - Free / Paid
Aggregated view, heatmap, historical data - CryptoQuant - Paid
SQL access, all-exchange aggregate, custom indicators - Coinalyze - Free / Pro
Multi-exchange comparison, CSV export - Glassnode - Paid
Institutional metrics, API - Exchange dashboards - Free
Step-by-Step Calculation
Step 1: Get Mark Price and Index Price
- Mark Price BTC: $95,200 (Binance perpetual, liquidity-weighted)
- Index Price BTC: $95,000 (spot aggregate: Coinbase, Kraken, Bitstamp)
Step 2: Calculate Premium Index
P = (Mark Price - Index Price) / Index Price
P = (95,200 - 95,000) / 95,000 = +0.2105%
Step 3: Apply the clamp function
Interest Rate I = 0.01%
clamp(0.01% - 0.2105%, -0.05%, +0.05%) = -0.05%
Step 4: Final Funding Rate
F = 0.2105% + (-0.05%) = +0.1605% per 8h
At a $100,000 position -> payment = $160.50 per 8 hours.
Process:
Spot Index --> Premium Index (P)
                     |
Interest Rate --> clamp(I - P)
                     |
              P + clamp = Funding Rate (F)
                     |
         Longs <--pay--> Shorts (if F > 0)
         Longs -->receive<-- Shorts (if F < 0)
Interpretation Zones
Zones are calibrated against real aggregated daily funding data (CryptoQuant All Exchanges, 3,572 days, May 2016 - February 2026).
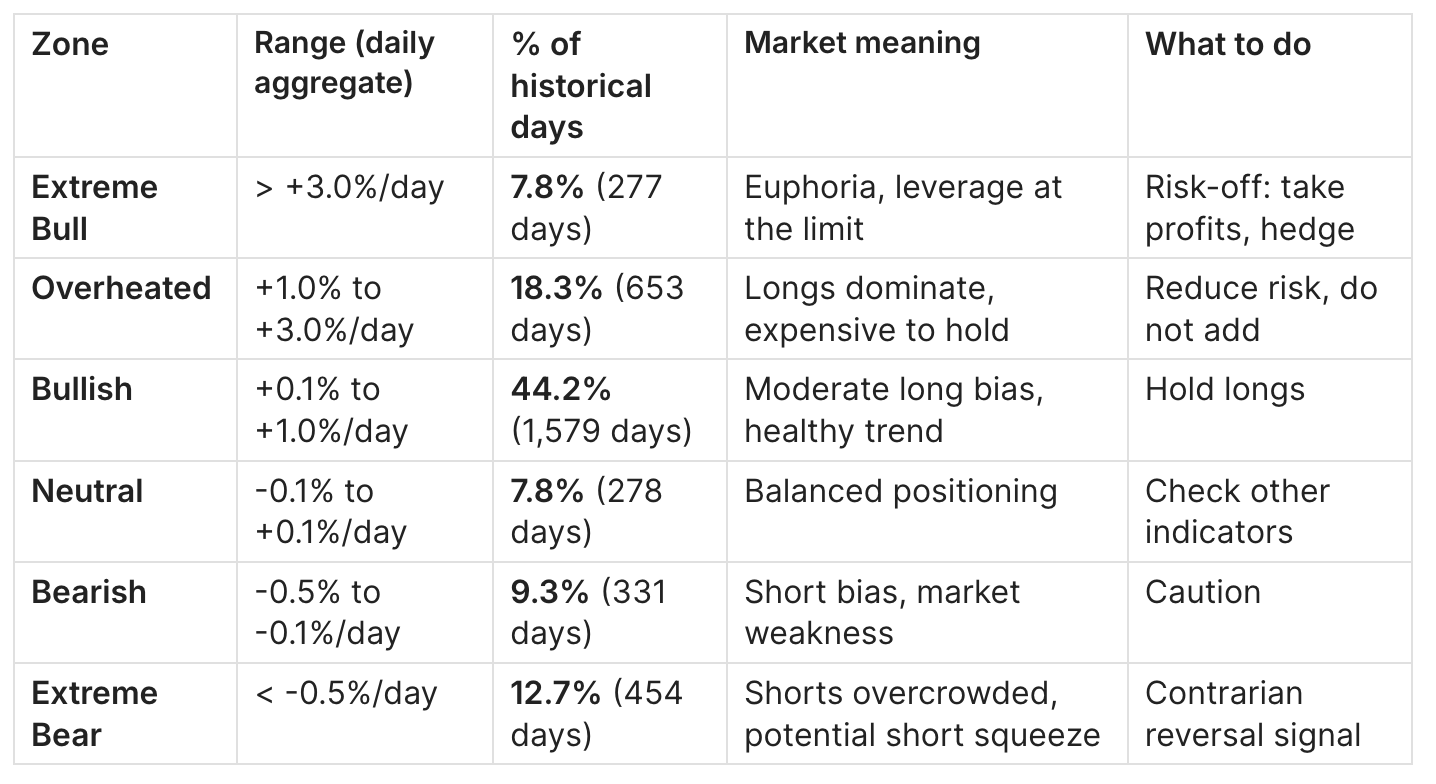
Structural insight from data: Over 9+ years the market spent 74.1% of the time in positive territory. The historical mean daily funding is +0.697%/day. This is not a coincidence: Bitcoin's long-term bull trend creates persistent structural demand for derivative longs.
Funding Rate > +1.0%/day: "Exchange Greed"
When daily funding holds above +1.0%/day, the market is in a state of leverage overhang. Real data confirms:
November 2021 ATH ($69K):
- November 8: +3.74%/day
- November 9: +3.56%/day
- November 10: +4.12%/day - peak. ATH on the same day, -55% over the next 60 days.
March 2024 ATH ($73K):
- March 10: +5.37%/day
- March 11: +8.22%/day - ETF-era maximum
- March 12: +6.76%/day. ATH on March 14, -23% correction over the next 6 weeks.
Typical mistake: entering a short at the first day above +3%/day. In the March 2024 spike, values held for 5 consecutive days before the correction.
Funding Rate < -0.5%/day: "Exchange Fear"
Negative funding below -0.5%/day occurs on 12.7% of historical days. Shorts pay longs. Every instance - a potential reversal:
FTX collapse, November 2022:
- November 9: -3.02%/day
- November 10: -11.67%/day - cycle bottom at $15,500
- November 11: -6.73%/day. +130% over the next 5 months.
August 2024 (yen carry unwind):
- August 5: -0.68%/day
- August 6: -1.31%/day - bottom at $49,000
- August 7: +0.91%/day - rapid recovery. +83% over 4 months.
COVID crash, March 2020:
- March 13: -25.70%/day - historical minimum across the entire data history. Bottom at $3,850. >1000% gain over the next 20 months.
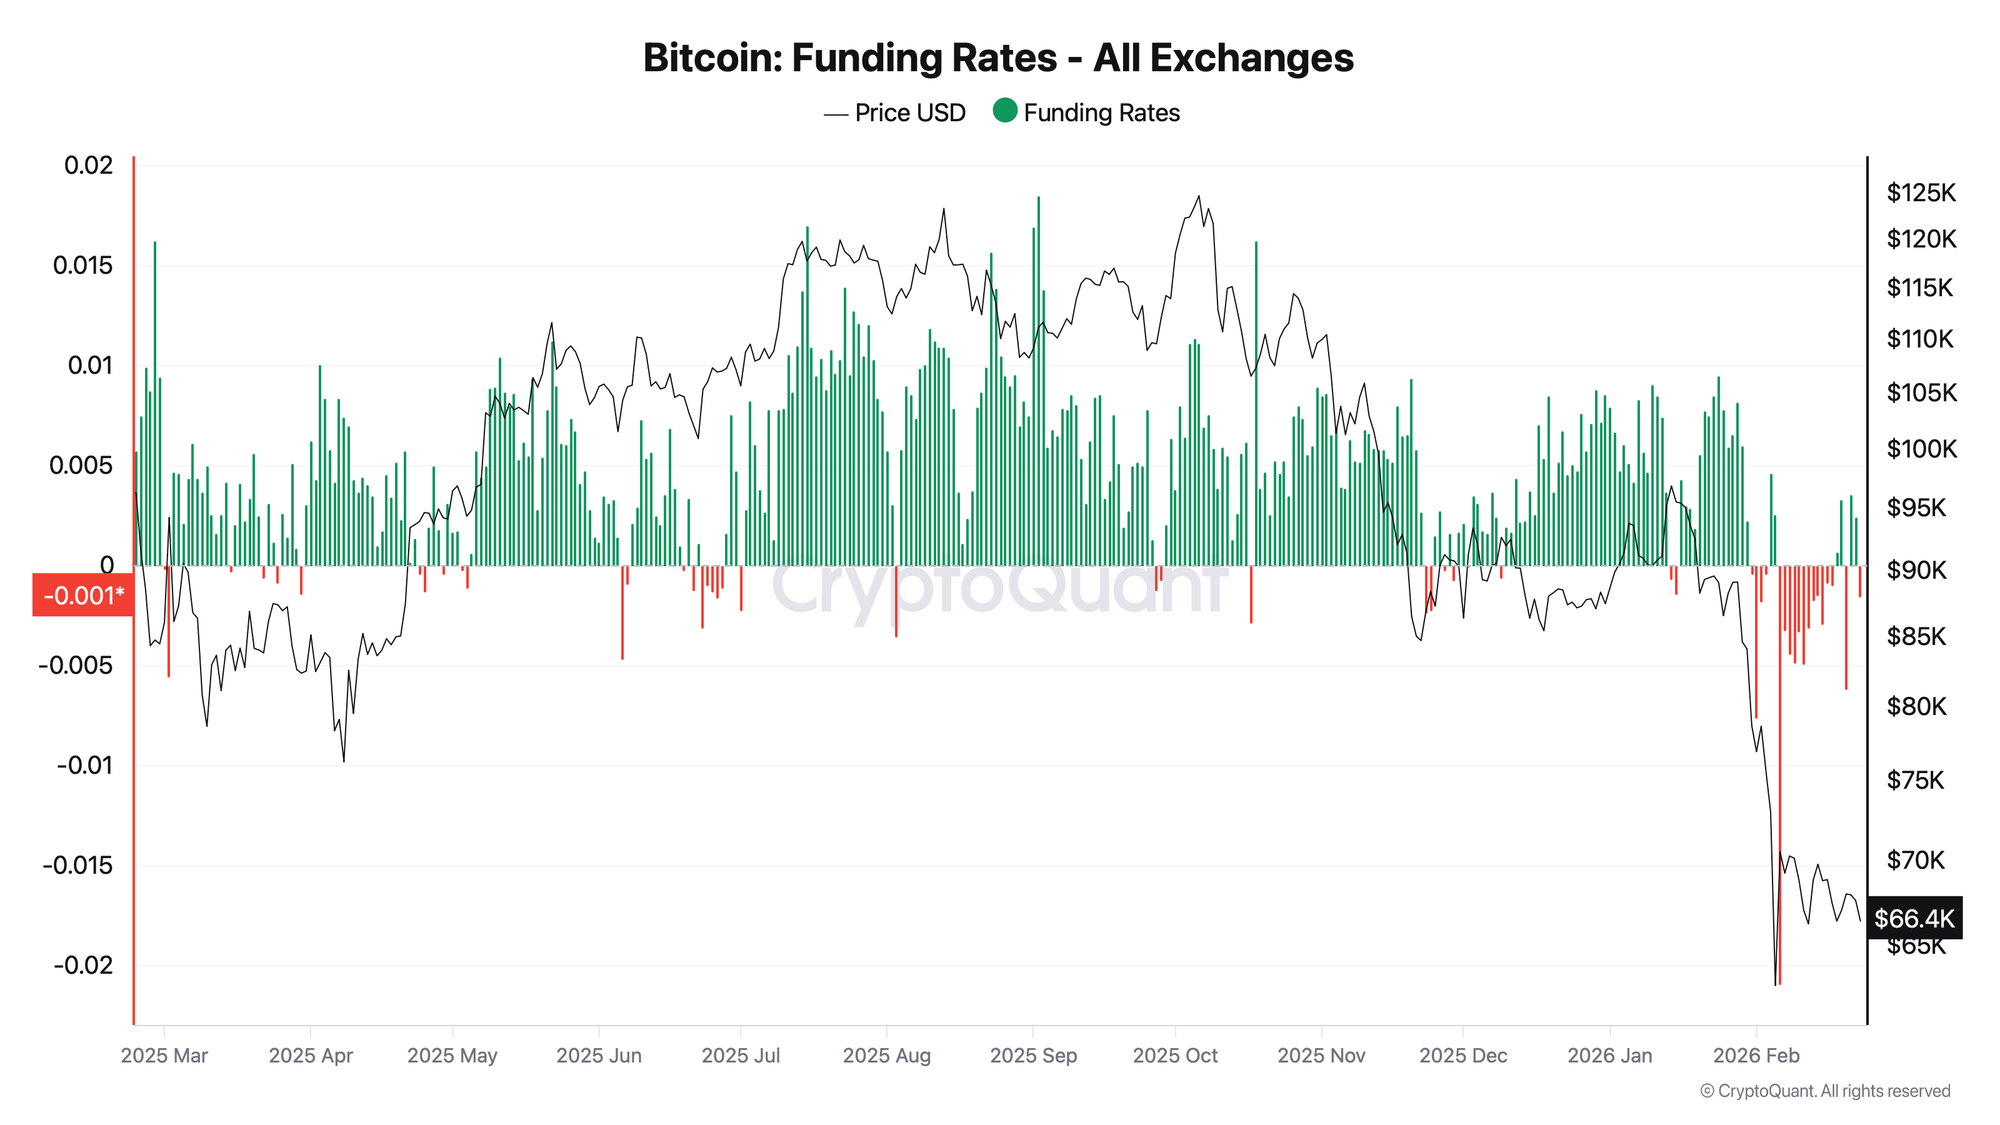
February 2026 (current period):
- February 6: -2.10%/day
- Sustained -0.1% to -0.5%/day for 2 weeks (February 7-17)
- Recovery beginning February 18-19 (+0.07%, +0.33%/day)
Neutral Zone
Only 7.8% of days - a transitional period. Typically: after a deleveraging event or in the early phase of a new trend. No signal - switch to on-chain.
Reading Funding Rate Dynamics, Not Just Levels
A common mistake is treating Funding Rate as a static threshold indicator - "above X is bearish, below Y is bullish." In practice, the direction of change and the speed of change carry as much information as the absolute value.
Rising funding into an uptrend - the most common pattern. Funding increases gradually as the market moves up. This is healthy price action. The signal becomes relevant only when funding accelerates sharply, compressing weeks of increase into 1-3 days.
Falling funding during a price rally - a hidden divergence. Price is rising but derivatives traders are cautious or actively shorting. This pattern often precedes strong continuation moves, as the lack of overleveraged longs reduces liquidation risk. The early stages of the January 2023 rally showed this pattern.
Spike and rapid normalization - the most tradeable pattern. A sharp spike into extreme territory (-11.67%/day during FTX, -1.31%/day in August 2024) followed by a quick return toward neutral within 1-3 days signals capitulation rather than a sustained trend shift. The speed of recovery matters: a return to neutral within 48 hours is structurally bullish.
Funding plateau at elevated levels - the most dangerous pattern for longs. Funding stays in the Overheated zone (+1-3%/day) for an extended period without a correction. This indicates a crowded trade where everyone is already long. Any catalyst that triggers initial selling creates a cascade: forced liquidations push price down, which triggers more liquidations. The March 2024 plateau (5 days above +2%/day) is the cleanest recent example.
Historical Cycle Examples
Example 1: November 2021 Top ($69K ATH)
Situation: Peak cycle euphoria. All-time high OI at the time.
Funding Rate (real data): +2.04% -> +3.74% -> +3.56% -> +4.12%/day (November 7-10).
Price: ATH $69,000 reached November 10. -55% over 60 days.
Conclusion: Three consecutive days of funding above +3%/day before the ATH - a classic overleverage signal. Combined with on-chain distribution (NUPL > 0.7, SOPR > 1.05), it provided a clear risk signal.
Example 2: FTX Collapse, November 2022
Situation: Collapse of the third-largest exchange. Bitcoin fell to $15,500.
Funding Rate (real data): -0.19% -> -3.02% -> -11.67% -> -6.73% -> -3.36%/day (November 8-12).
Price: $15,500 - cycle bottom. +130% over the next 5 months.
Conclusion: The extreme negative spike lasted 1 day (-11.67%/day) - this is panic, not a sustained trend. The rapid recovery to -3% the next day signaled capitulation.
Example 3: March 2024 - ETF Era, ATH $73K
Situation: First full quarter after the launch of the Bitcoin Spot ETF.
Funding Rate (real data): +2.09% -> +5.37% -> +8.22% -> +6.76% -> +3.77%/day (March 9-13).
Price: ATH $73,777 - March 14. Correction to $56,500 (-23%).
Conclusion: In the ETF era, peak funding exceeded 2021 levels (+8.22% vs +4.12%/day). But the signal logic did not change. What is new: after the correction, ETF purchases created V-shape recoveries - a new pattern absent in 2021-2022.
Example 4: August 2024 - Yen Carry Unwind
Situation: Bank of Japan raised rates. Bitcoin fell from $65K to $49K in 3 days.
Funding Rate (real data): +0.70% -> -0.68% -> -1.31% -> +0.91% -> +0.67%/day (August 4-8).
Price: Bottom at $49,000 (August 5-6). +83% over 4 months.
Conclusion: The spike was short (2 days) and sharp - typical of macro-driven panic. The quick return to positive funding on day 3 (August 7, +0.91%/day) was an early reversal signal.
Example 5: COVID Crash, March 13, 2020
Situation: Global panic, BitMEX forced liquidations.
Funding Rate (real data): -10.85% -> -25.70% -> -16.25%/day (March 12-14).
Price: Bottom at $3,850 - absolute cycle low. >1000% gain over the next 20 months.
Conclusion: The most extreme negative funding in Bitcoin history coincided with the absolute cycle bottom. Historical pattern: black swan events create the deepest funding anomalies and the best entry points.
Practical Application
Buy / Accumulation Signal
Funding condition:
- Daily aggregate < -0.5%/day (ideally spike < -1.0%/day)
- Return to positive funding within 1-3 days after the spike
Confirmations:
- Open Interest declining or stabilizing
- MVRV Ratio < 1.5 (medium-term zone)
- Spot CVD rising during sideways or falling price
Traps:
- Do not enter during negative funding on exogenous catalysts without waiting for reversal confirmation (see FTX: -3.02% -> -11.67% -> -6.73% over 3 days)
- Wait for return to neutral or positive zone
Risk guidance: Standard position size. Stop below the last swing low. Target - return to Bullish zone (+0.1% to +1.0%/day).
Risk-Off / Distribution Signal
Funding condition:
- Daily aggregate > +3.0%/day
- 3+ consecutive days
Confirmations:
- Open Interest at historical highs
- SOPR > 1.05
- Exchange Inflows rising
Traps:
- Do not short immediately on the first day above +3%/day - the March 2024 spike held for 5 days
- High funding does not equal immediate correction. Lag: 3-10 days
Risk guidance: Reduce exposure by 20-30%. Hedge via options. No full exit without on-chain confirmation.
Neutral / Wait Mode
Condition: Daily aggregate -0.1% to +0.1%/day with no clear trend.
What to do: Switch to on-chain (MVRV, NUPL, Realized Price) and macro context (DXY, Fed rates, ETF net flows). Derivatives offer no signal - do not force a position.
Position Sizing Based on Funding Zones
Most trading guides describe funding as a binary signal - either trade or do not trade. A more precise approach uses funding zone to calibrate position size, not just trade direction.
The logic is straightforward: the further funding is from neutral, the higher the mean-reversion probability. Higher probability justifies a larger position. But extreme funding also coincides with elevated volatility, which requires wider stops and thus smaller position size in absolute terms.
A practical framework:
Neutral zone (+-0.1%/day): No funding edge. Size according to your base rules without any funding-based adjustment.
Bullish zone (+0.1 to +1.0%/day): Modest long bias. Standard position size. Funding is not a concern.
Overheated zone (+1.0 to +3.0%/day): Begin reducing long exposure. If initiating a new long, size at 50-70% of standard. The probability of a near-term correction is elevated.
Extreme Bull zone (>+3.0%/day): Maximum caution for longs. If holding an existing position, consider taking partial profits. New longs should be sized at 25-40% of standard with tight stops.
Bearish/Extreme Bear zone (<-0.5%/day): Contrarian long opportunity. Size at 50-75% of standard on the first day of spike. Add the remaining size once funding begins recovering toward neutral. This staged entry reduces the risk of catching a falling knife on events like FTX where funding spiked to -11.67% before the final bottom.
This framework does not override your primary analysis. It functions as a multiplier on conviction: strong on-chain signal + extreme funding = maximum size. Weak signal + extreme funding = pass.
Funding Rate vs Open Interest vs CVD
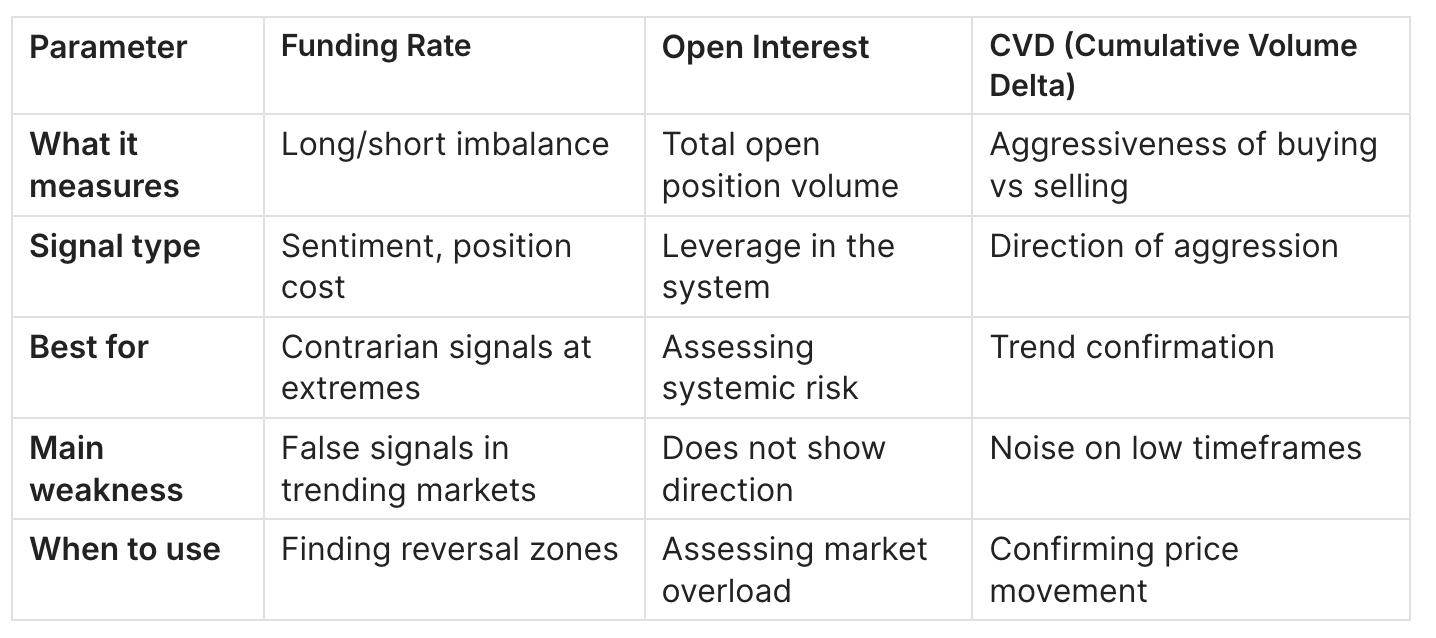
Recipe 1 - "Bear Trap": Funding < -0.5%/day + OI declining + CVD rising -> Shorts being liquidated, hidden buying. Pattern: August 2024 (-1.31%/day on Aug 6 -> +0.91%/day on Aug 7, OI dropped, price bounced from $49K).
Recipe 2 - "Derivatives Bubble": Funding > +3.0%/day + OI at historical high + CVD falling -> Buying climax. Pattern: March 2024 (+8.22%/day -> ATH $73K -> -23%).
Funding Rate and the ETF Era: What Changed in 2024
The launch of U.S. Bitcoin Spot ETFs in January 2024 introduced a structural shift in how Funding Rate behaves as a cycle indicator. Understanding this shift is essential for anyone using funding signals in the current market environment.
Before ETFs (pre-2024): The primary channel for large-scale Bitcoin exposure was derivatives. Institutional traders, hedge funds, and high-net-worth participants who wanted leveraged long exposure accessed it through perpetual swaps and quarterly futures. This meant that major capital inflows showed up directly in Funding Rate. A large institution going long Bitcoin in 2021 typically showed up as elevated funding within hours.
After ETFs (2024+): Spot ETFs created a parallel channel. BlackRock IBIT, Fidelity FBTC, and other ETF products allow institutions to gain Bitcoin exposure through regulated equity markets without touching derivatives at all. A $500 million ETF inflow hits the Coinbase spot order book - not the Binance perpetual market. Funding Rate does not capture this flow.
The evidence is visible in the data. During the January-February 2024 ETF launch period, Bitcoin rallied from $42,000 to $52,000 while daily aggregate funding remained relatively moderate at +0.28 to +0.59%/day - levels associated with a healthy Bullish zone, not the Overheated readings that accompanied similar price moves in prior cycles. The buying pressure was real, but it was flowing through a channel that funding does not see.
The practical implication for cycle analysis: in the ETF era, the absence of extreme positive funding during a price rally is no longer a bearish signal. It may simply mean that institutional demand is being expressed through spot ETFs rather than derivatives. Conversely, when funding does spike to extreme levels (as in March 2024 at +8.22%/day), it indicates that retail and leveraged participants have piled in on top of the ETF-driven base - a genuinely crowded trade with elevated correction risk.
The recommended adjustment: pair Funding Rate analysis with ETF net flow data (available from Bloomberg, Farside Investors, and CoinGlass) as a complementary signal. When both ETF flows are positive AND funding is elevated, the overheating signal is stronger. When ETF flows are positive but funding is moderate, the rally likely has more room to run.
How Funding Rate Relates to Other Indicators
Relationship with Basis (futures/spot spread):
Annualized Basis ~ F_per8h x 3 x 365
Normal market: Basis 10-20% per year. Overheated: >50% per year. At F = +0.05%/8h -> Basis ~ 54.75% per year - the threshold where arbitrageurs actively open cash-and-carry trades.
Structural positivity - a historical fact: Mean over 9+ years = +0.697%/day aggregate. Median = +0.485%/day. This means that a strategy of continuously shorting perpetual + longing spot has historically generated positive carry. This is why cash-and-carry is the base strategy for institutional BTC traders.
Funding Rate -> Liquidation Cascade: High positive funding = many leveraged longs = high liquidation risk on price decline. Liquidation cascades reset funding sharply - a 1-2 day spike down as seen during FTX (-0.19% -> -11.67% -> -3.36%). After the spike, funding normalizes quickly.
-> See also: Bitcoin Liquidation Cascade: How It Works, Why It Happens & How to Predict It
-> See also: Bitcoin Open Interest vs Price: 4 Divergence Patterns Every Trader Must Know
Limitations
1. False signals in trending markets High funding can hold for 5-10 days without a correction. March 2024 spike: +2.09% -> +5.37% -> +8.22% -> +6.76% -> +3.77%/day - 5 consecutive days. Solution: require on-chain confirmation (SOPR, Exchange Flows).
2. ETF effect (2024+) Institutional purchases via spot ETFs do not appear in funding. In January 2024 (first weeks of ETF), funding was moderate (+0.28%/day) while ETF purchases were routed through spot Coinbase - not derivatives. Solution: add ETF Net Flow analysis.
3. Cross-exchange divergence Funding on Binance does not equal Bybit does not equal Hyperliquid at the same time. Use aggregated all-exchange funding as the primary signal.
4. Black swan spikes COVID -25.70%/day and FTX -11.67%/day are anomalies that do not repeat under normal conditions. Working thresholds for daily analysis: +-3%/day for extremes, +-0.5%/day for signals.
5. Rate capping on individual exchanges Most exchanges cap the per-8h rate at +-0.3-0.5%. Aggregated data is not limited by these caps, so it provides a more complete picture of systemic imbalance.
FAQ
What happens when funding rate is negative?
When Funding Rate goes negative, short position holders pay long position holders at each settlement interval. This is the market's self-correction mechanism working in reverse: the perpetual contract is trading below spot price, so the system incentivizes traders to buy the discounted contract (go long) and disincentivizes holding shorts.
From a sentiment perspective, negative funding means that a majority of leveraged participants are positioned for further price decline. They are paying a cost to maintain that view. The longer negative funding persists and the deeper it goes, the higher the cost of being short - eventually forcing weaker short positions to close. When shorts close, they buy back the contract, pushing price higher. This is the mechanical foundation of a short squeeze.
Historically, sustained negative funding has been one of the most reliable contrarian signals in Bitcoin derivatives. The key qualifier is "sustained" - a single day of slightly negative funding carries little weight. What matters is depth (below -0.5%/day aggregate) and duration (2+ days), or a sharp spike to extreme negative values followed by rapid normalization, as observed in August 2024.
What is a normal Bitcoin funding rate?
Based on 3,572 days of aggregated all-exchange data (May 2016 - February 2026), the statistical normal range for Bitcoin funding is approximately +0.1% to +1.0%/day in aggregate terms. This range accounts for 44.2% of all historical days - the single largest zone by frequency.
The mean is +0.697%/day and the median is +0.485%/day, both firmly positive. This structural positivity reflects Bitcoin's long-term appreciation trend: as long as the market expects BTC to go up over time, there will always be net demand for leveraged long exposure in derivatives.
For traders monitoring single-exchange per-8h rates (the format shown on Binance and Bybit dashboards), the equivalent normal range is approximately +0.03% to +0.33%/8h. Values persistently above +0.10%/8h on a single exchange signal elevated conditions worth monitoring.
How do you use funding rate for trading?
Funding Rate is most useful as a risk filter rather than a standalone entry signal. The core application is asymmetric: it tells you when NOT to trade more reliably than it tells you when TO trade.
The highest-conviction use cases, supported by historical data:
Avoiding overextended longs: When daily aggregate funding exceeds +3.0%/day for 3 or more consecutive days, the probability of a near-term correction is historically elevated. This is not a short signal - it is a signal to stop adding long exposure and begin reducing existing positions. Both the November 2021 ATH (+4.12%/day peak) and March 2024 ATH (+8.22%/day peak) were preceded by 3-5 day periods of extreme funding.
Identifying capitulation zones: When funding drops below -0.5%/day aggregate, particularly with a sharp spike below -1.0%/day, the market is in a state of fear-driven overleveraged shorting. The historical record from 2016 to 2026 shows that every major cycle bottom was accompanied by extreme negative funding. This does not mean you should buy immediately - it means you should be looking for a long entry rather than adding shorts.
Confirmation within a trend: When funding is in the Bullish zone (+0.1 to +1.0%/day) and trending upward gradually alongside rising price, this confirms a healthy trend with manageable leverage. No action required beyond maintaining existing positions.
The most important rule: always require at least one additional confirmation before acting on a funding signal alone. The standard confirmation stack is Funding Rate + Open Interest direction + one on-chain metric (MVRV, SOPR, or Exchange Flows).
What is Funding Rate in simple terms? A fee that traders on the "overloaded" side of the market pay traders on the opposite side, to keep perpetual futures close to Bitcoin's real price.
Where to check the current Funding Rate? CoinGlass.com -> Funding Rate (aggregated). For a specific exchange: Binance/Bybit/OKX dashboards -> Futures Market Info. CryptoQuant for historical SQL analysis.
How often is Funding Rate paid? Standard: every 8 hours (3 times per day). Some exchanges: every 4 hours, 1 hour, or continuously (Hyperliquid).
How often does negative funding occur? Based on 2016-2026 data: 25.9% of days (925 out of 3,572). Deeply negative (< -0.5%/day aggregate): 12.7% of days (454 days).
What is the most extreme historical Funding Rate? Based on aggregated all-exchange data: -25.70%/day - March 13, 2020 (COVID crash). Highest positive in modern history: +8.22%/day - March 11, 2024 (BTC ATH run). Most negative in modern history: -11.67%/day - November 10, 2022 (FTX collapse).
Why was funding high for several days but price did not fall? In trending markets, high funding can persist for 5-10 days. The March 2024 peak held above 2%/day for 5 days before the correction. One day of high funding is not a signal. You need a combination: 3+ days + on-chain confirmation.
What does the historical mean of +0.697%/day mean? Crypto derivatives are structurally positive - the market longs Bitcoin most of the time. This creates a constant income stream for cash-and-carry participants and structural shorts.
Can Funding Rate be used for altcoins? Yes, but with less precision. Altcoin funding is more volatile and less readable as a cycle indicator due to lower liquidity.
What is cash-and-carry based on Funding Rate? A market-neutral strategy: Long Spot BTC + Short BTC Perpetual. You collect funding without market risk. Historical mean of +0.697%/day aggregate is theoretically attractive. More detail in the next guide in this cluster.
Conclusion
5 key takeaways from real data (2016-2026):
- Funding Rate - a balancing mechanism for perpetual futures and a derivatives sentiment indicator. Over 9+ years the market spent 74.1% of the time in positive territory. Mean funding: +0.697%/day.
- Extremely high funding (>+3%/day aggregate) preceded every major top: November 2021 (+4.12%/day before $69K ATH), March 2024 (+8.22%/day before $73K ATH). Lag from funding peak to top: 1-5 days.
- Extremely negative funding (<-0.5%/day) historically coincided with bottom zones: COVID crash (-25.70%/day -> $3,850), FTX collapse (-11.67%/day -> $15,500), August 2024 (-1.31%/day -> $49,000). Every instance - a signal to consider a contrarian position.
- In the ETF era (2024+), funding has partially lost its predictive power on higher timeframes - institutional flow through spot ETFs is not visible in derivatives. But on the days-to-weeks horizon the signal still works.
- Maximum value comes from combining with Open Interest, on-chain flows, and CVD. Never use in isolation.
Next guides in this cluster:
- Funding Rate Strategies: Cash-and-Carry, Basis Trading & Arbitrage - how to profit from funding regardless of market direction
- Funding Rate + Open Interest: Advanced Derivatives Framework - building a complete picture of the derivatives market
Read daily analysis for free: Adler AM - Bitcoin morning brief every day.
Institutional-grade depth: Adler Premium - weekly deep analysis, SQL models, early signals.