


🎧 Morning Brief #213 - audio debate
Bitcoin rose from $62.7K to $64.7K over the past 24 hours, but two oscillators provide different answers about what drove the move. Takers shifted to the buy side for the first time in several days, while liquidations continue to fall predominantly on long positions.
TL;DR
We examine what powered the daily move: aggressive market buying or the forced closing of short positions. The logic is simple: if liquidations do not confirm a short squeeze, real market demand remains the primary fuel behind the move.
Bitcoin Taker Order Pressure Oscillator
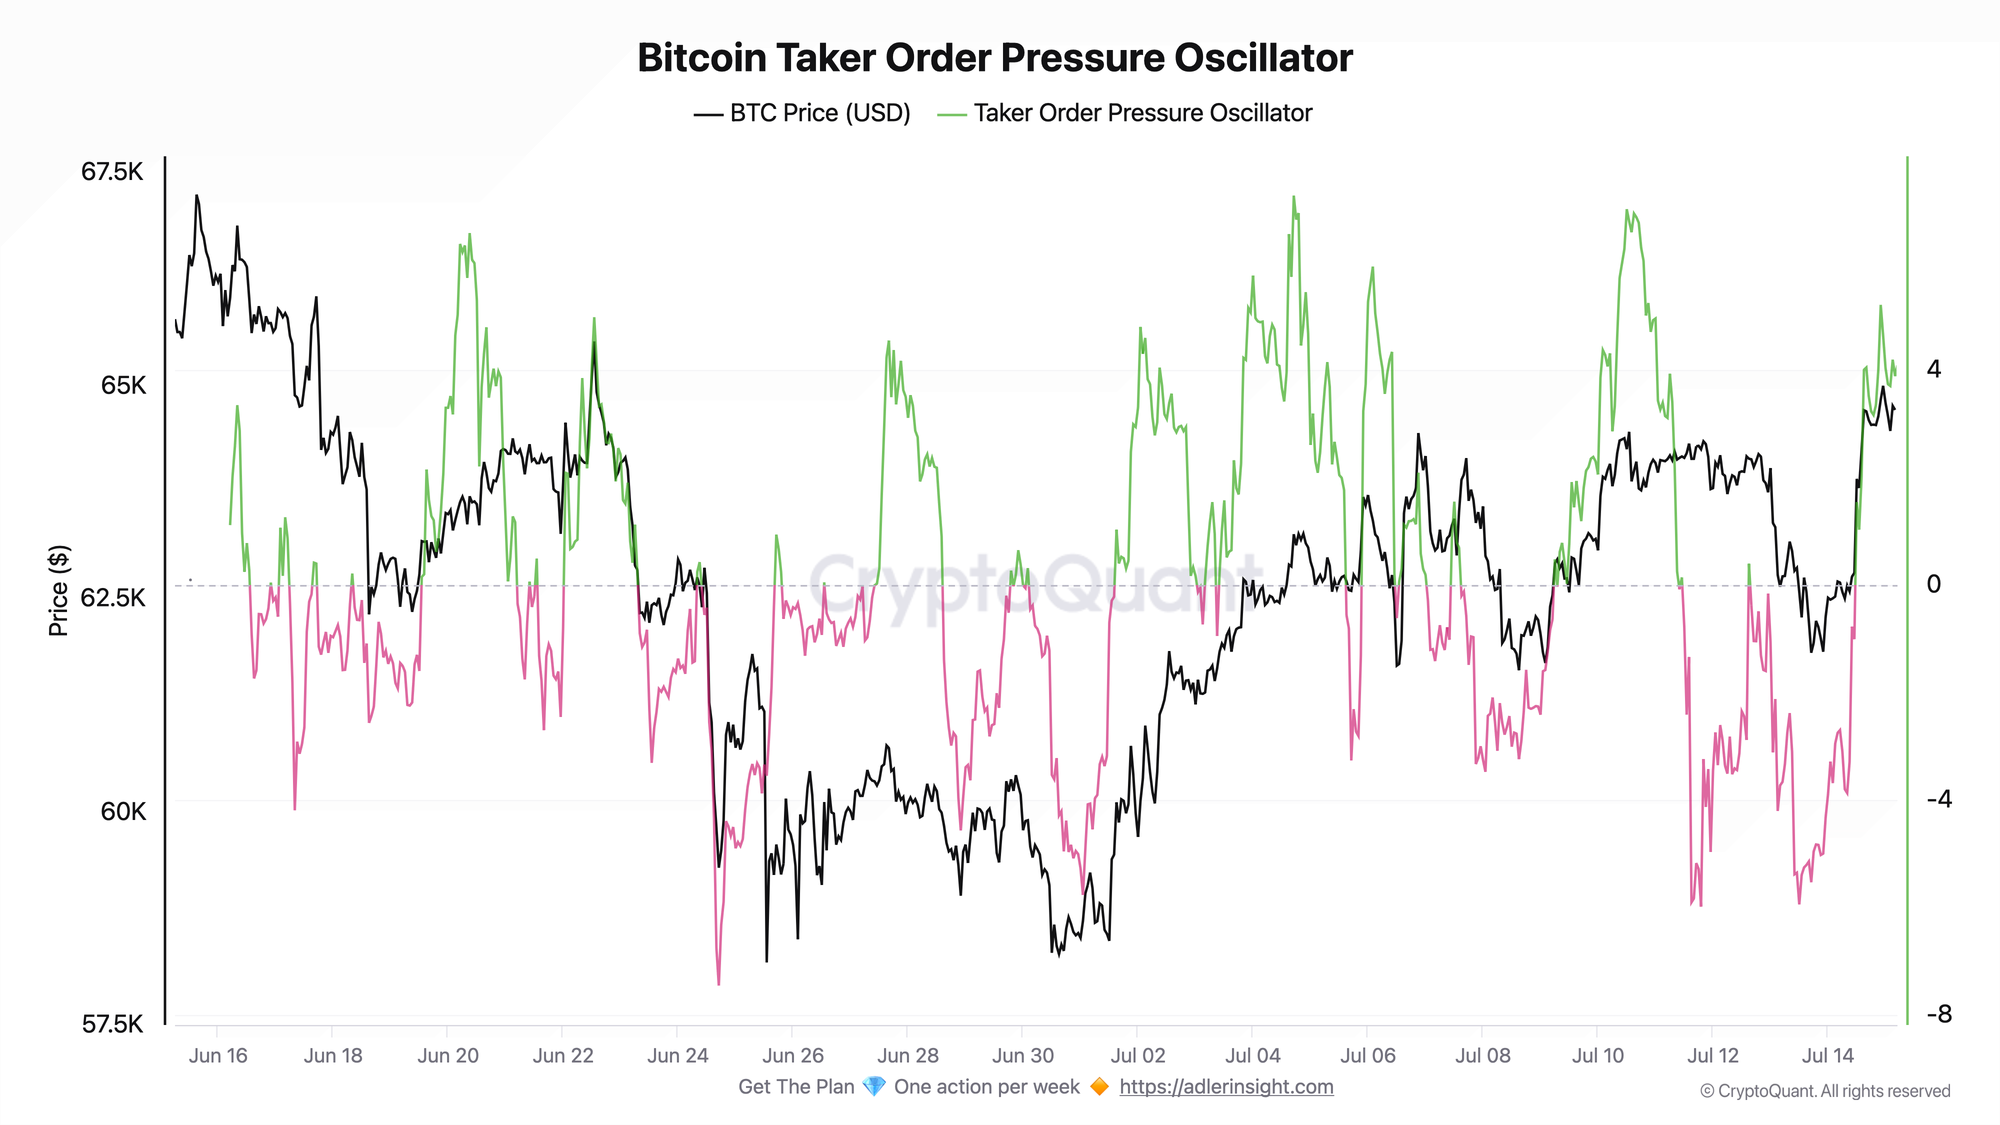
The oscillator measures the 24-hour excess of taker buying over taker selling as a percentage of total taker volume.
The metric spent almost all of last week below zero, falling as low as -3.9, but moved into positive territory around 12:00 UTC on July 14, just as the price impulse began. It currently stands at +4.1, up from -2.7 a day earlier, while the intraday high reached +5.2. This places it in the top 14% of its monthly range, with the 30-day high near +7.3.
The reversal in taker flow occurred alongside the rise in price, not after it. This is typical of a move supported by aggressive market buying rather than merely a technical position flush.
Confirmation would come from the oscillator remaining above zero over the next 24 hours. A move back below zero while price stalls would indicate that the buying impulse has faded.
Bitcoin Liquidation Pressure Oscillator
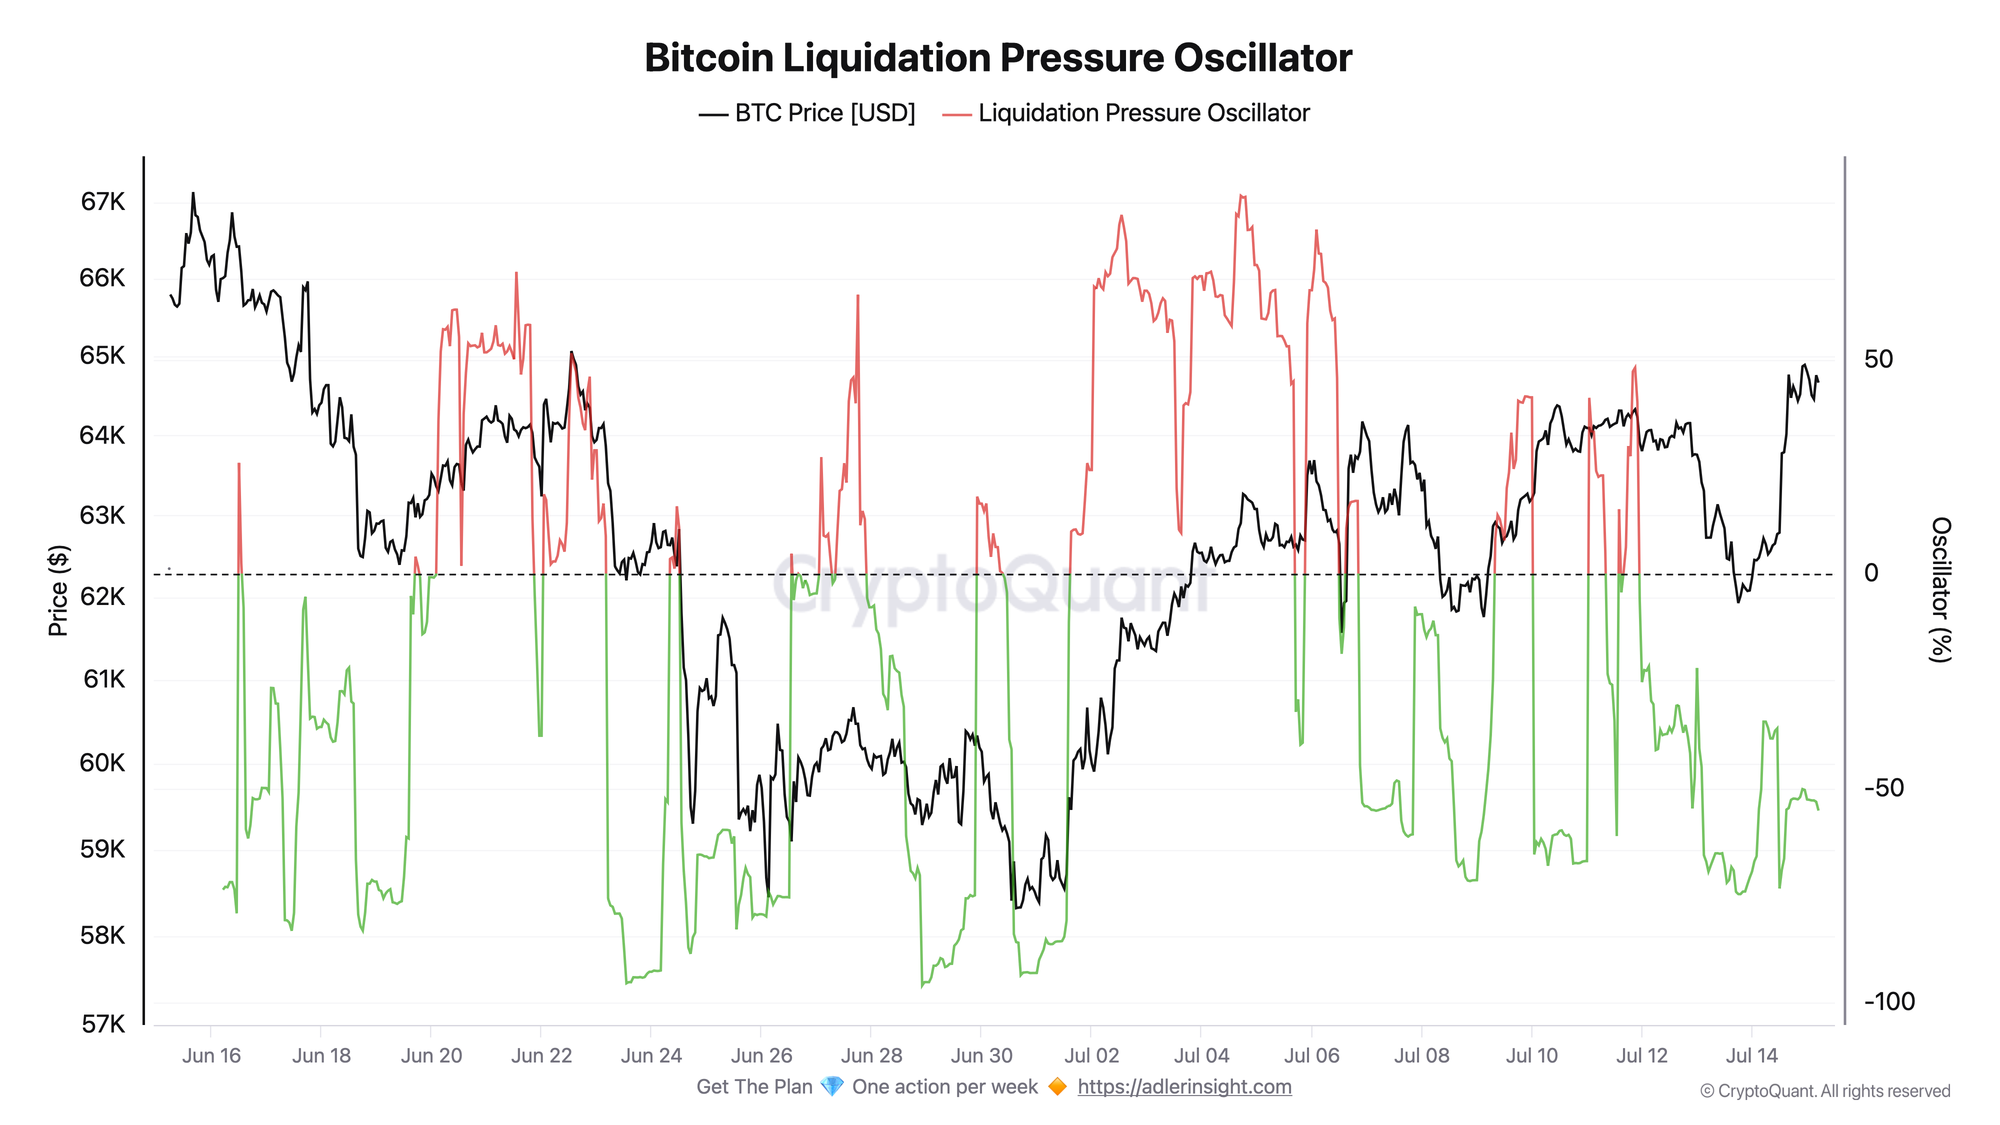
The oscillator measures the excess of short liquidations over long liquidations during the past 24 hours. Values below zero mean that long positions are being forcibly closed more heavily.
The metric currently stands at -55.2 and was last above zero on July 11. Rather than improving during the rally itself, it fell as low as -73.4. The 30-day low stands at -96.0.
In other words, long positions were being liquidated throughout the entire move higher. Price continued to rise despite the selling pressure created by the forced closing of longs. This rules out a short squeeze as the primary driver of the move.
The negative scenario would be a decline toward the monthly low alongside a reversal in price. That would signal the start of a full-scale long-liquidation cascade without sufficient demand on the other side.
Together, the two metrics provide a clear picture: the taker oscillator identifies aggressive demand, while the liquidation oscillator confirms that this demand was not generated by forced short covering.
The key point today is that the 3.1% rally was driven by market buying, not by short-squeeze mechanics.
Invest in Bitcoin without emotional decisions - Start free. Deterministic signals built to remove fear, FOMO, and panic selling.
FAQ
Why is a rally without a short squeeze considered higher quality? A short squeeze is driven by the forced closing of positions and ends once the supply of shorts has been exhausted. Taker demand reflects voluntary market buying and can continue as long as buyers consider the current price acceptable.
What would signal a regime change? A move back below zero in the taker oscillator while price remains stuck near current levels would indicate that the aggressive buyer has left. A move above zero in the liquidation oscillator, by contrast, would show that further upside is beginning to be supported by forced short covering rather than underlying demand.
CONCLUSIONS
Takers shifted to the buy side at the same time price began to rise, and the oscillator remains in the top 14% of its monthly range. Meanwhile, the liquidation oscillator stands near -55 and has not moved above zero since July 11, meaning that the market has been liquidating predominantly long positions.
This rules out a short squeeze as the primary explanation for the 3.1% daily gain. The move was driven by aggressive market demand that absorbed the selling pressure created by long liquidations.
The regime has shifted toward cautious risk-on. The main trigger is for the taker oscillator to remain above zero over the next 24 hours. The main risk is a return below zero while price stalls, which would leave the market with crowded long positioning and a weaker buyer.
Live Charts
Explore the metrics behind this brief with live, auto-updating charts:
Funding Rates - Perpetual futures funding to track long-side or short-side leverage pressure.
Open Interest (BTC) - Total futures positioning and 7-day BTC-denominated change.
Coinbase Premium Index - Coinbase vs global market premium as a proxy for US spot demand pressure.
Fear & Greed Index - Composite market sentiment for risk appetite and sentiment extremes.
Derivatives - All funding, open-interest, and leverage charts in one view.