


🎧 Morning Brief #212 - audio debate
Adjusted NUPL for the broader market and its key holder cohorts remains in unrealized loss territory. Bitcoin has fallen about 20% over the past two months, pushing the average holder cost basis above the current price.
At the same time, the acute phase of market stress has eased: the metric has rebounded from its June lows, while unrealized losses have steadily narrowed. However, none of the three readings has returned above breakeven, so it is still too early to call a confirmed regime shift.
TL;DR
The market has remained in unrealized loss territory for six weeks. STH moved underwater first and were also the first to begin recovering, while the aggregate Adjusted NUPL and LTH readings reached their lows later. All three metrics have now converged near -0.13 and are recovering in sync.
This points to easing capitulation pressure, but not a completed reversal. Confirmation will come only after the aggregate Adjusted NUPL makes a sustained return above zero.
Bitcoin Adjusted Net Unrealized Profit/Loss
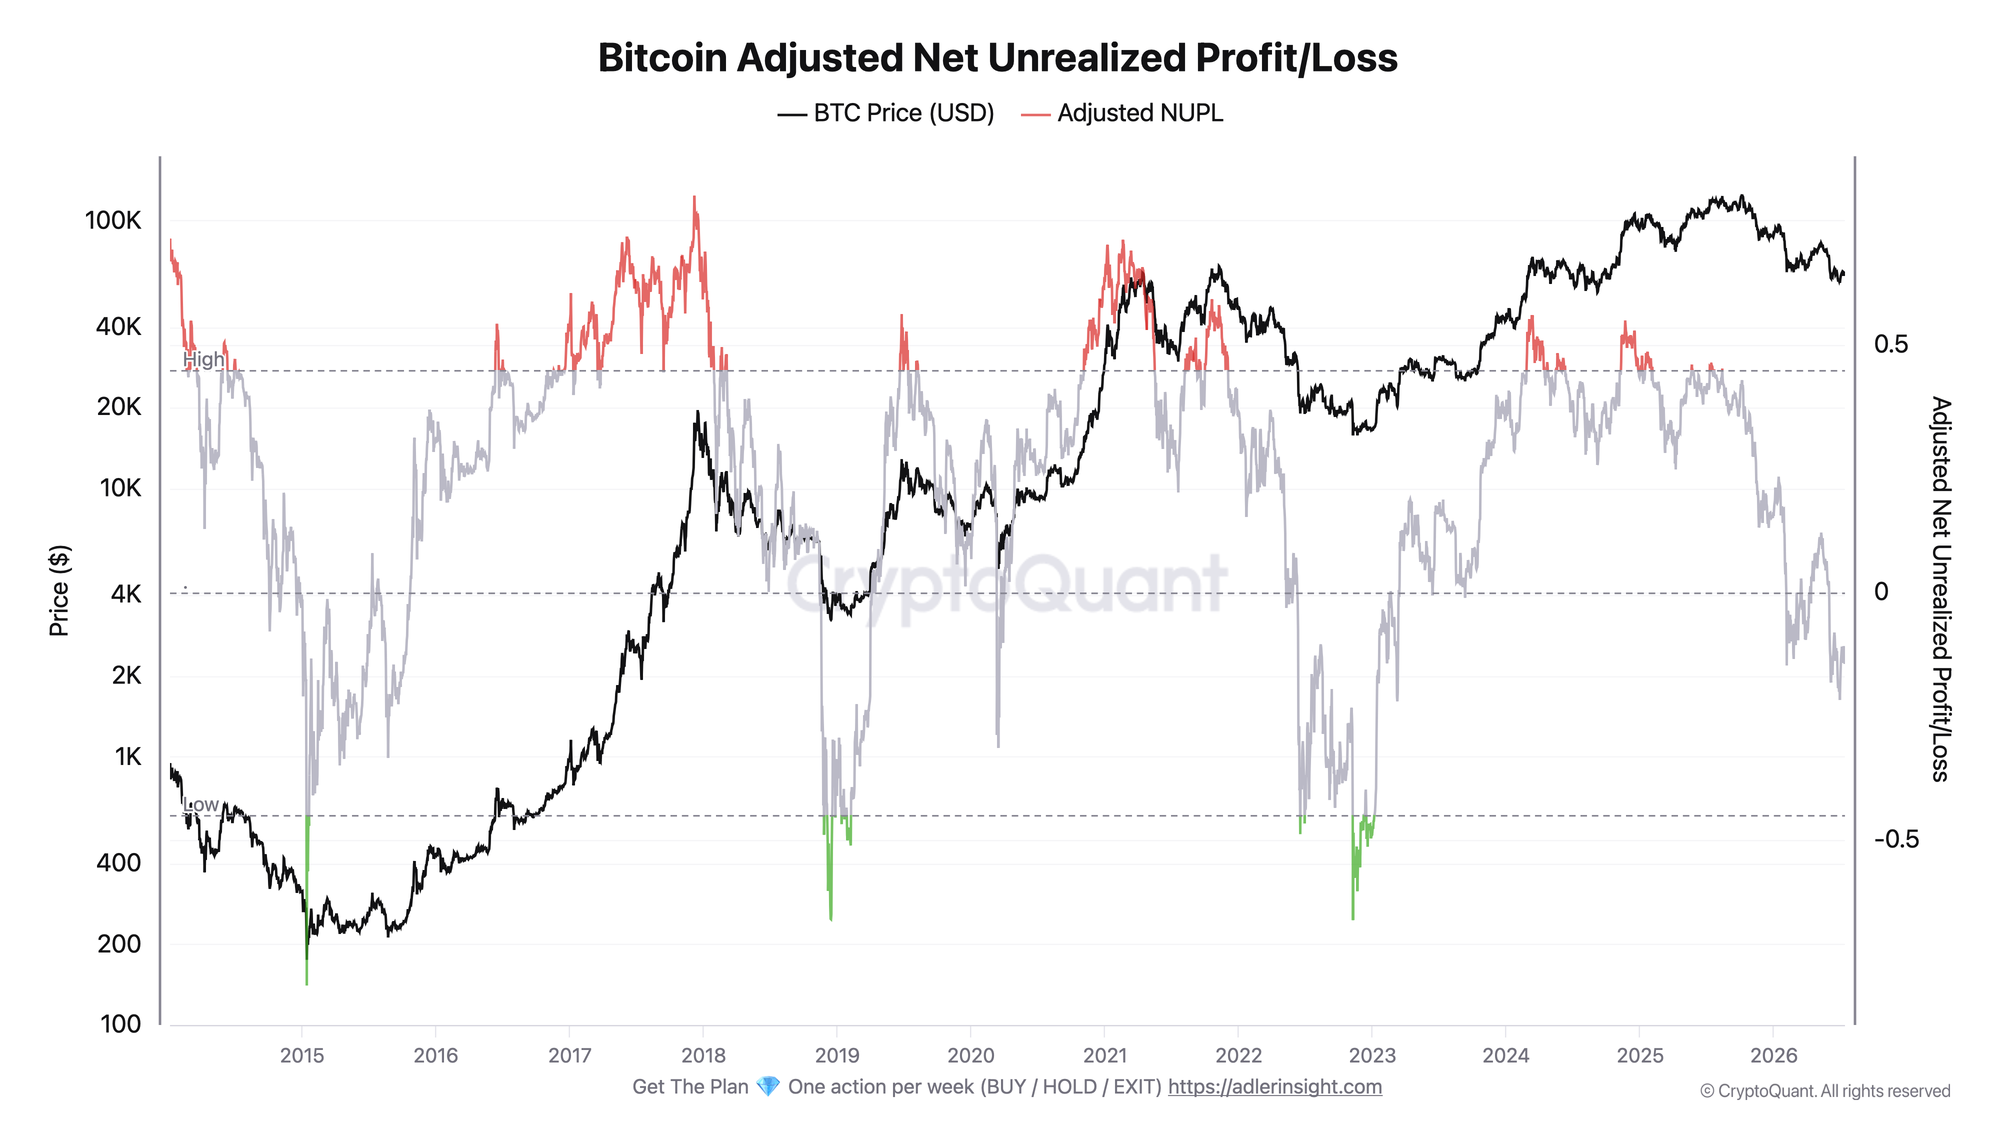
Adjusted NUPL currently stands at -0.13 and has remained continuously negative since early June. The metric closed below zero on 44 of the past 60 days. It reached its low on June 30 at around -0.22, when Bitcoin was trading near its local bottom.
Since then, the indicator has steadily recovered despite sideways price action. This means the depth of unrealized losses is narrowing, although the market has yet to return to its average breakeven point.
Negative NUPL is associated with zones of market stress and accumulation. However, moving out of deeply negative territory does not confirm a reversal on its own. The key signal of improvement is a sustained move above zero. The main risk is another decline below -0.22 and a new low beneath the June bottom.
Bitcoin LTH Adjusted Net Unrealized Profit/Loss
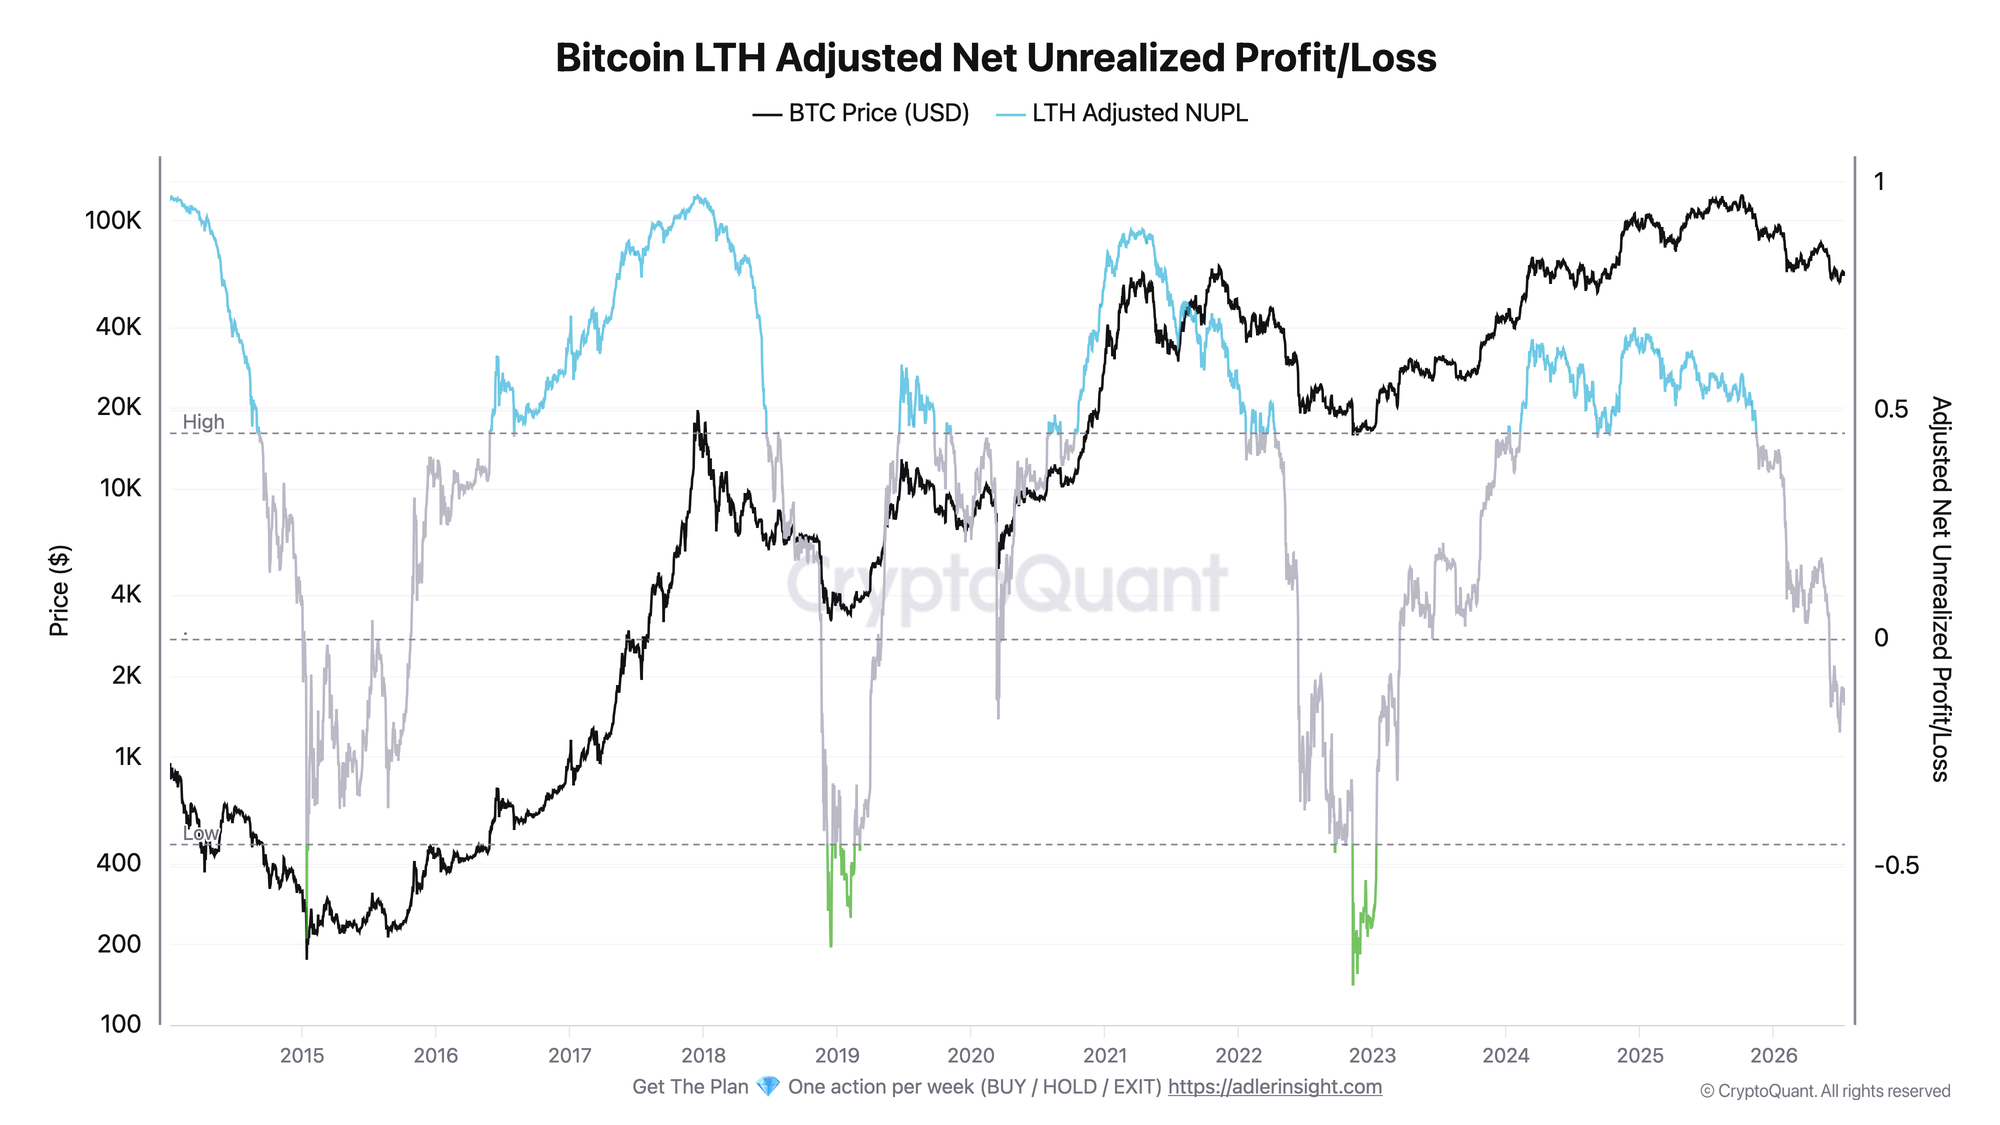
Adjusted NUPL for long-term holders, calculated across age bands ranging from 6 months to 7 years.
Two months ago, the LTH reading was firmly in profit territory near +0.13. It has since fallen to approximately -0.14 and now sits slightly below the STH reading. The cohort reached a local low near -0.21 on June 30.
This means the current price has fallen below the average cost basis of even the portion of supply that typically enters short-term corrections with a substantial cushion of unrealized profit.
Negative LTH Adjusted NUPL points to market stress that extends beyond recent buyers. As long as the metric remains below zero, long-term capital lacks the usual profit cushion that helps absorb pressure during renewed waves of selling.
The first sign of normalization will be a return of the LTH reading to breakeven. Until then, the recovery remains incomplete.
Bitcoin STH Adjusted Net Unrealized Profit/Loss
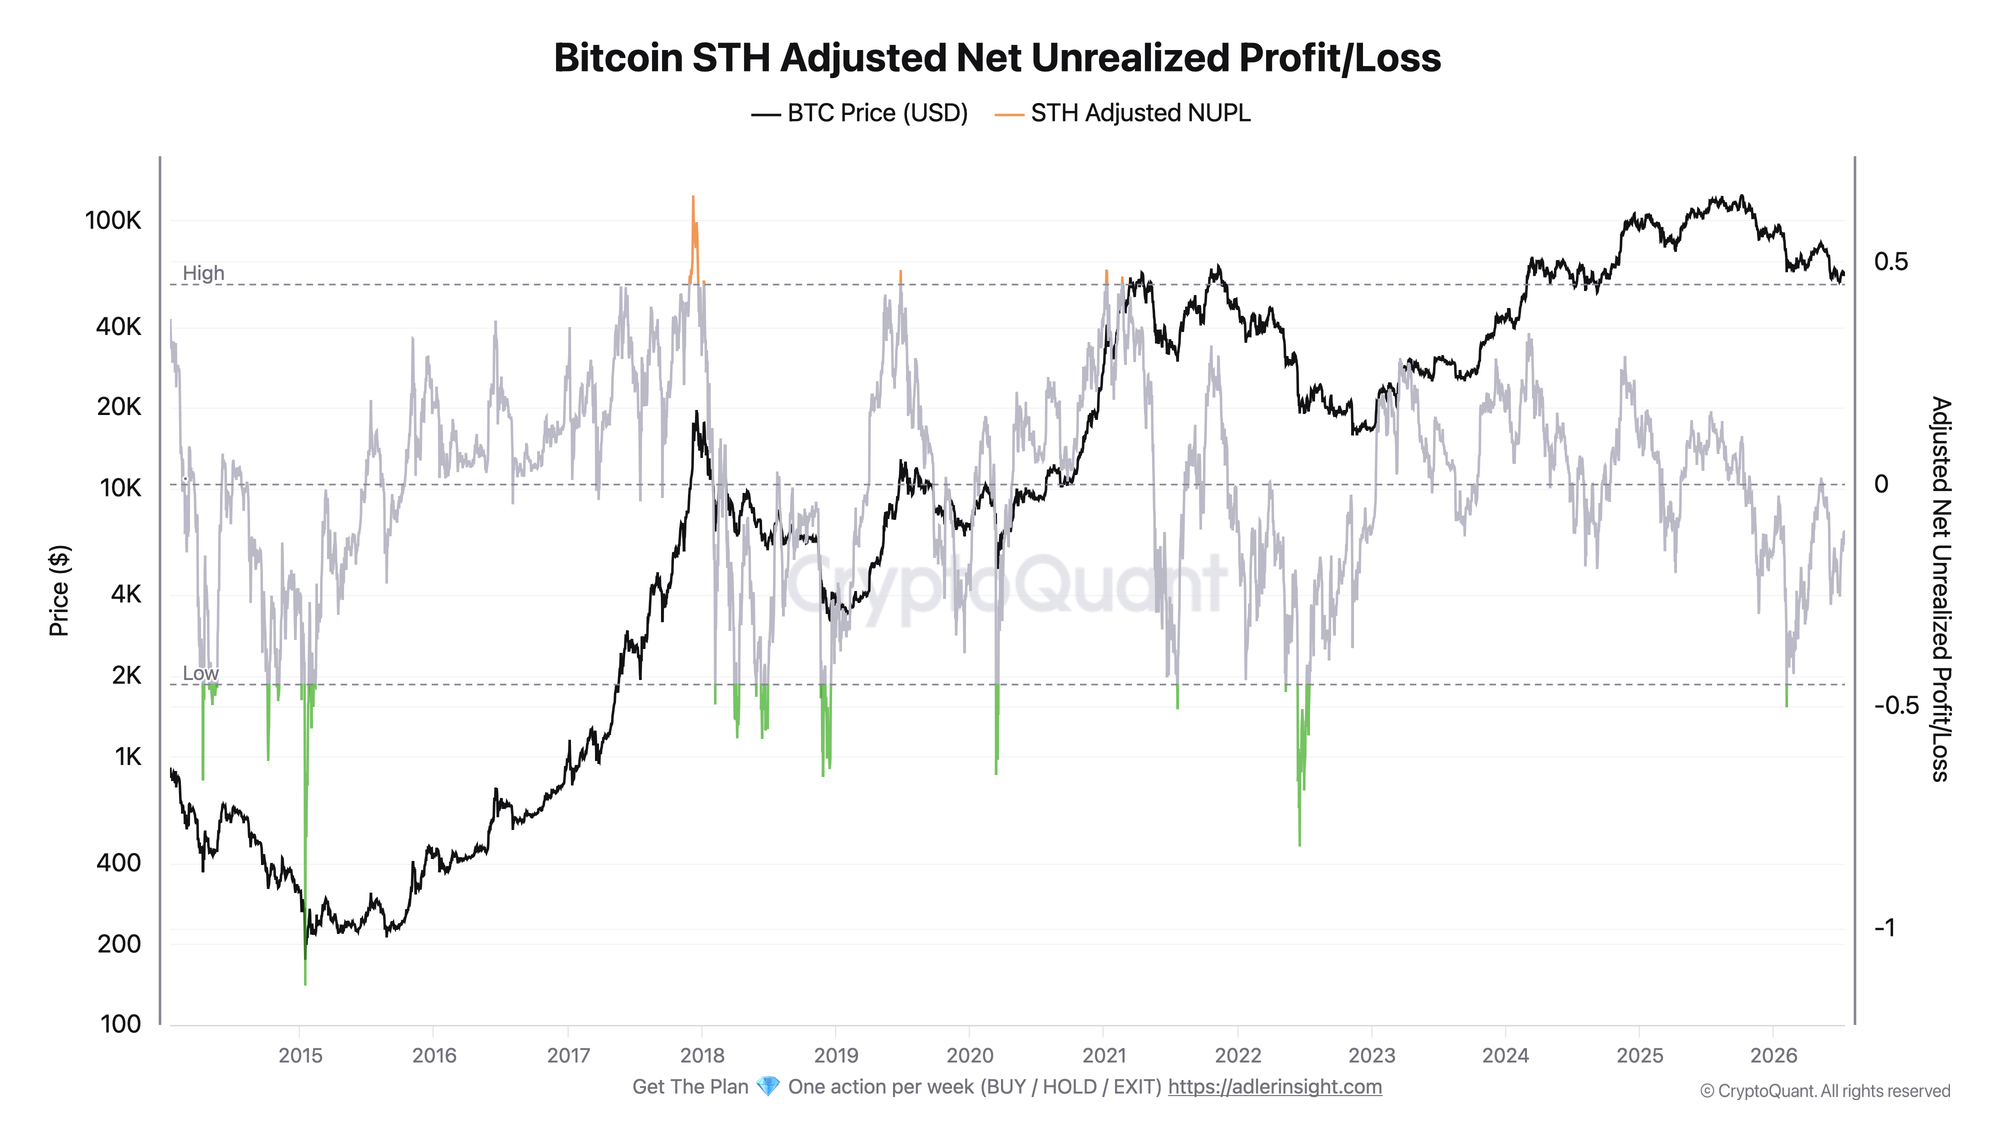
Adjusted NUPL for short-term holders, calculated across age bands ranging from 1 day to 6 months.
The STH reading was the first to move into negative territory and the first to form a local bottom. It had already fallen to -0.27 by June 5. It has since recovered to around -0.13 and is now almost level with the aggregate and LTH readings.
Losses among short-term holders confirm weakness in the market structure, as the average cost basis of recent buyers remains above the spot price. At the same time, these are often the conditions in which a local bottom begins to form: weaker participants realize losses, selling pressure gradually fades, and the remaining supply shifts into stronger hands.
However, as long as STH Adjusted NUPL remains below zero, recent buyers are still underwater. Meaningful improvement will begin once their average cost basis returns to breakeven.
All three readings have now compressed into a narrow range near -0.13. The gap between the cohorts has almost disappeared, while unrealized losses are spread broadly across the market rather than concentrated in one segment.
STH led the move lower and reached their bottom first on June 5. The aggregate Adjusted NUPL and LTH readings reached their lows later, on June 30. All three indicators are now recovering in sync, but none has returned to positive territory.
The key signal in the current structure is a synchronized reduction in unrealized losses without a confirmed exit from the stress regime.
Outperform Buy & Hold with a rules-based strategy - Start free. One weekly action, clear triggers, and invalidation levels. No guessing.
FAQ
Why is negative NUPL not automatically a bearish signal? A negative reading means the average holder cost basis is above the current price. These conditions occur in zones of market stress and accumulation, not near market peaks. The bearish scenario strengthens not because the metric is negative, but when losses deepen again and new lows are formed.
What level would confirm a regime shift? The main trigger is a sustained return of the aggregate Adjusted NUPL above zero. This would mean that the analyzed holder base has moved from unrealized loss territory back into profit. The opposite signal would be a decline below -0.22 and a new low beneath the June bottom.
CONCLUSIONS
All three Adjusted NUPL readings - aggregate, LTH, and STH - remain in unrealized loss territory near -0.13. At the same time, the depth of those losses has already narrowed significantly from the June lows.
The data points to an easing of the acute phase of market stress, but it does not confirm a full reversal. The market is recovering in sync across all cohorts, although none has yet returned above breakeven.
The main improvement trigger is a sustained return of the aggregate Adjusted NUPL to positive territory. The main risk is another decline below -0.22, a new low beneath the June bottom, and a shift into a deeper unrealized loss regime.
Live Charts
Explore the metrics behind this brief with live, auto-updating charts:
NUPL - Net unrealized profit/loss across holders, mapped into cycle sentiment phases.
Supply in Loss - Share of supply held at a loss to flag stress and capitulation zones.
STH-SOPR - Short-term holder profit/loss behavior around the 1.0 breakeven threshold.
LTH-SOPR - Long-term holder profit/loss realization around the 1.0 breakeven threshold.
Holder Behavior - All holder profitability and supply-cohort charts in one view.