


Bitcoin has fallen 6% from its early October high and approached the lower boundary of its three-week range. The price structure signal has cooled into neutral territory, while futures buyers still trail sellers.
TL;DR
Bitcoin is correcting after September’s rally, with the price approaching support. I examine where the line lies between a correction and a deeper decline.
Bitcoin Price Structure
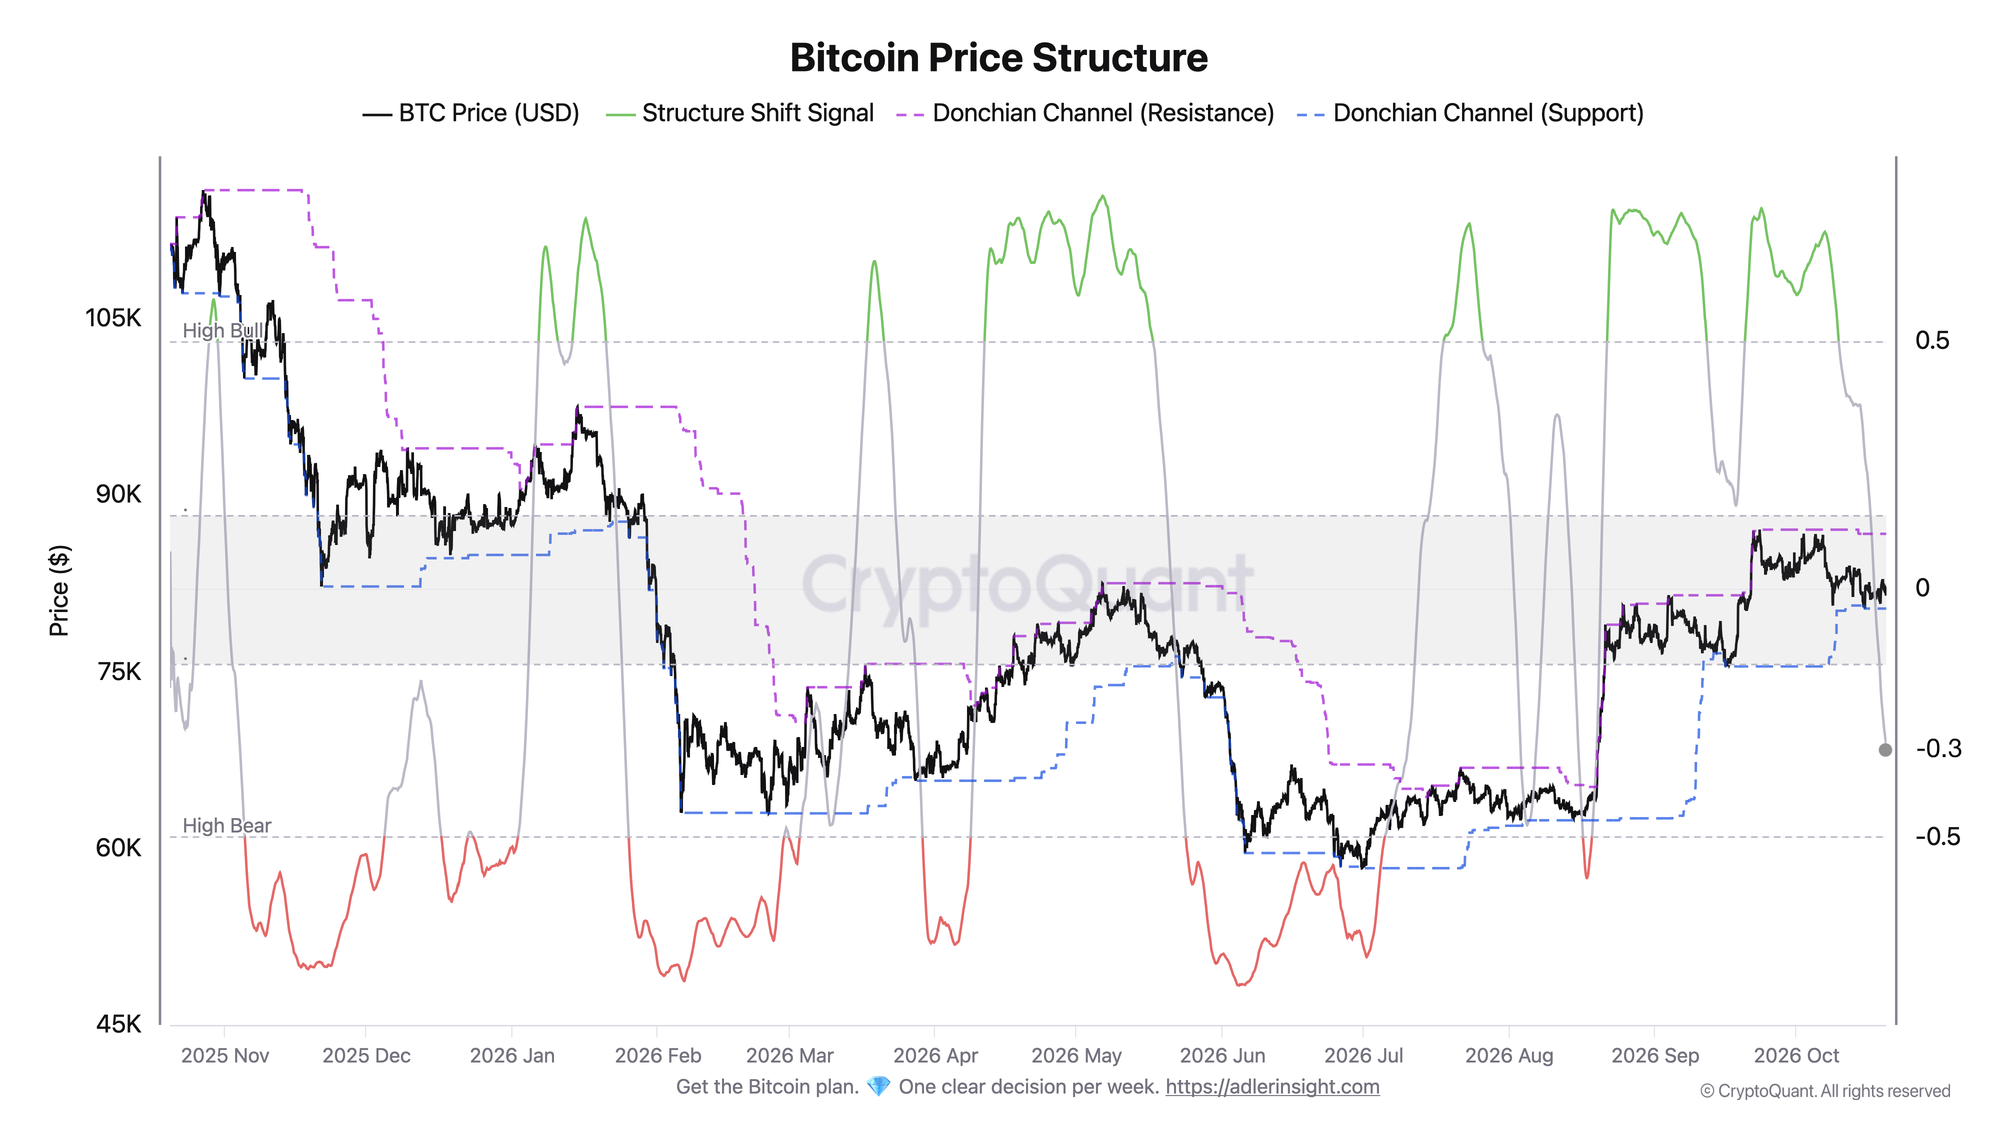
Bitcoin traded at $86.7K on October 2 and is trading at $81.6K on October 20, down 6%. The structure signal has declined from +0.37 a week ago to -0.32. It has left bullish territory but remains in the neutral zone and has not reached bearish territory below -0.5.
The lower boundary of the past three weeks’ range sits at $80.4K. As long as the price holds above it, this remains a correction within the range. If the price falls below $80.4K and the signal drops below -0.5, the correction will begin to turn into a downtrend.
Bitcoin Futures Flow
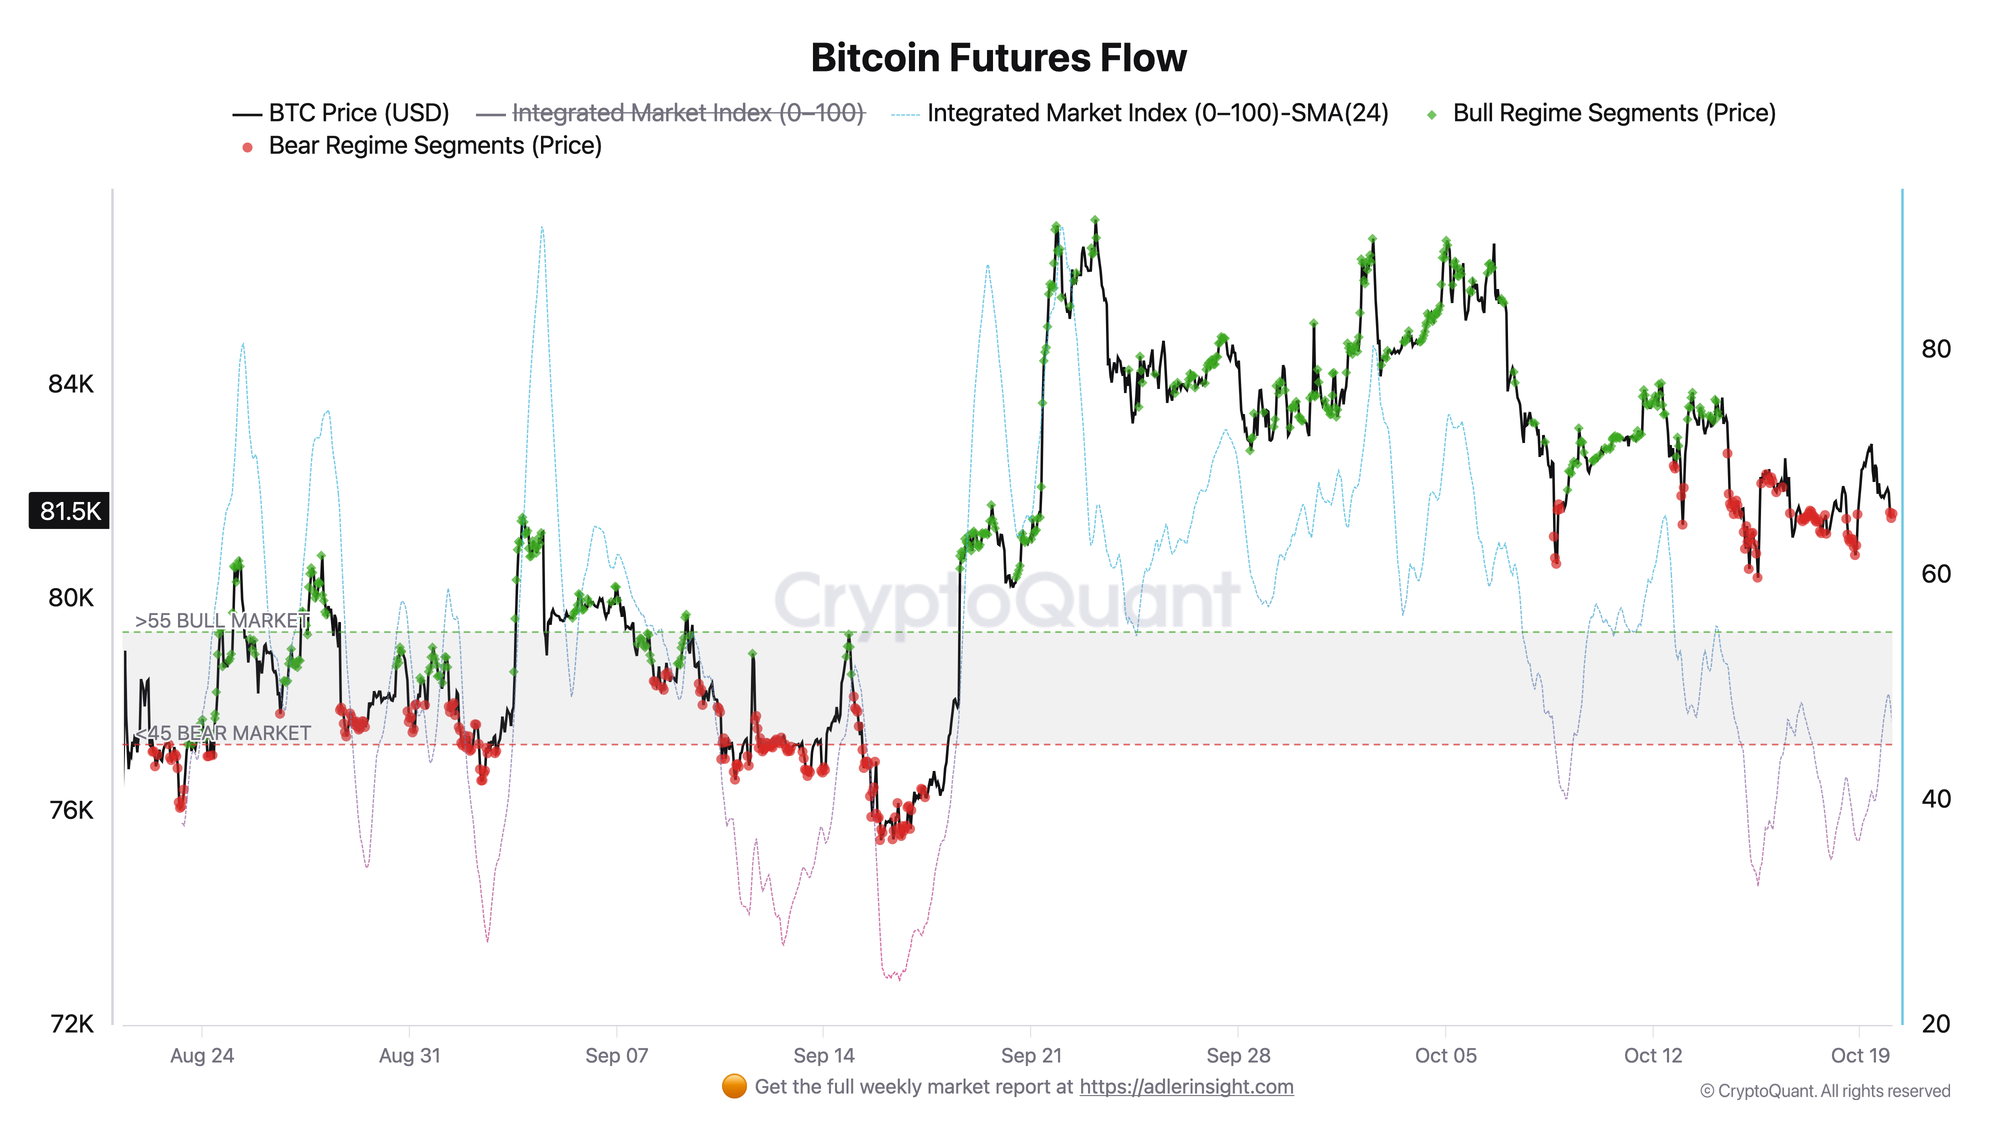
The index line shows which side has the upper hand in the futures market: buyers above 50, sellers below 50. The line has remained below 50 since October 17. On October 19, it almost reached 50 but failed to break above that level and has now fallen back to 46.
A decisive move above 50 would be the first sign that buyers are returning. Sellers still have the upper hand, so futures demand is lacking the strength to help lift the price.
Reading the signal is not enough - you need to act on it. Weekly Engine turns on-chain data into one clear decision per week, with risk caps and invalidation built in. Start free.
FAQ
Does a negative structure signal mean a bear market has begun? No. The signal is in the neutral zone; bearish territory begins below -0.5. It currently indicates a correction following September’s rally.
Does a reading below 50 mean heavy selling? The line shows that futures sellers are more active than buyers.
Conclusions
Bitcoin is correcting near the lower boundary of its three-week range, while futures buyers trail sellers. A move back above 50 in the futures index and a rise in the structure signal would improve the picture. The main risk is a drop below $80.4K alongside a signal reading below -0.5. That would mean the correction is turning into a downtrend.
Live Charts
Explore the metrics behind this brief with live, auto-updating charts:
Open Interest (BTC) - Total futures positioning and 7-day BTC-denominated change.
Funding Rates - Perpetual futures funding to track long-side or short-side leverage pressure.
Bitcoin Analysis Framework - Multi-layer decision stack for cycle position, participant behavior, and momentum timing.
Fear & Greed Index - Composite market sentiment for risk appetite and sentiment extremes.