


Since late July, long-term holder supply has declined by 345,000 BTC to 16.06 million BTC. In early October, they were spending coins almost every day, but the pace has slowed in recent days.
TL;DR
Long-term holders continue to gradually reduce their holdings, but their spending frequency has eased from a one-year high. We examine what this means for bitcoin supply.
Bitcoin Long-Term Holder Spending Binary Indicator
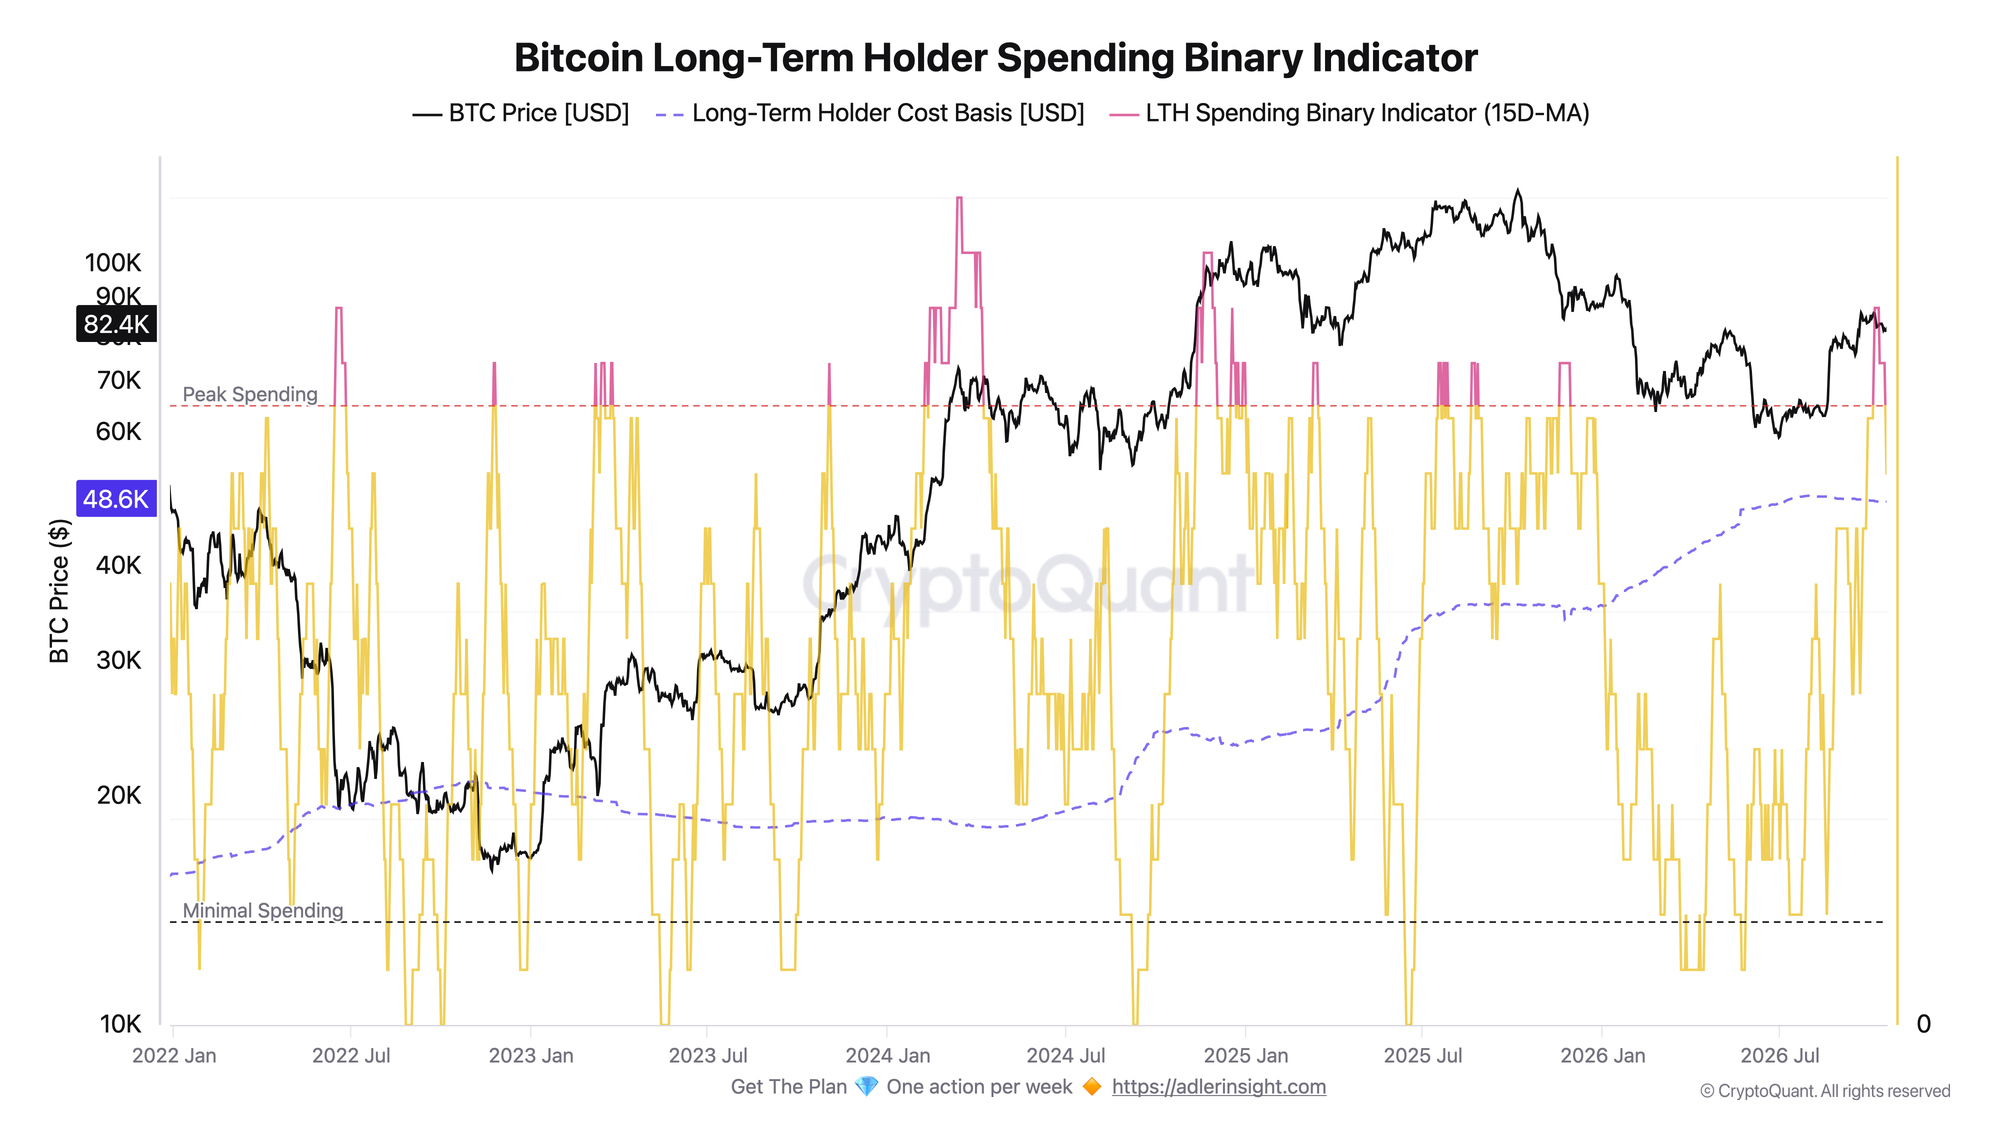
The indicator shows how many of the past 15 days long-term holder supply declined. From October 6 to 10, the reading was 13 out of 15 days, the highest in the past year. By October 19, it had fallen to 10 out of 15: the group's holdings increased over the past three days. Meanwhile, bitcoin is trading at $82,800, while the average purchase price for long-term holders is $48,600, leaving the group 70% in profit.
If the indicator returns to its usual level of 7 out of 15 days, long-term holders will be spending coins noticeably less often. This will ease supply pressure from the group. If the reading rises back to 13-15 days, daily spending will resume.
Bitcoin Long-Term Holder Supply
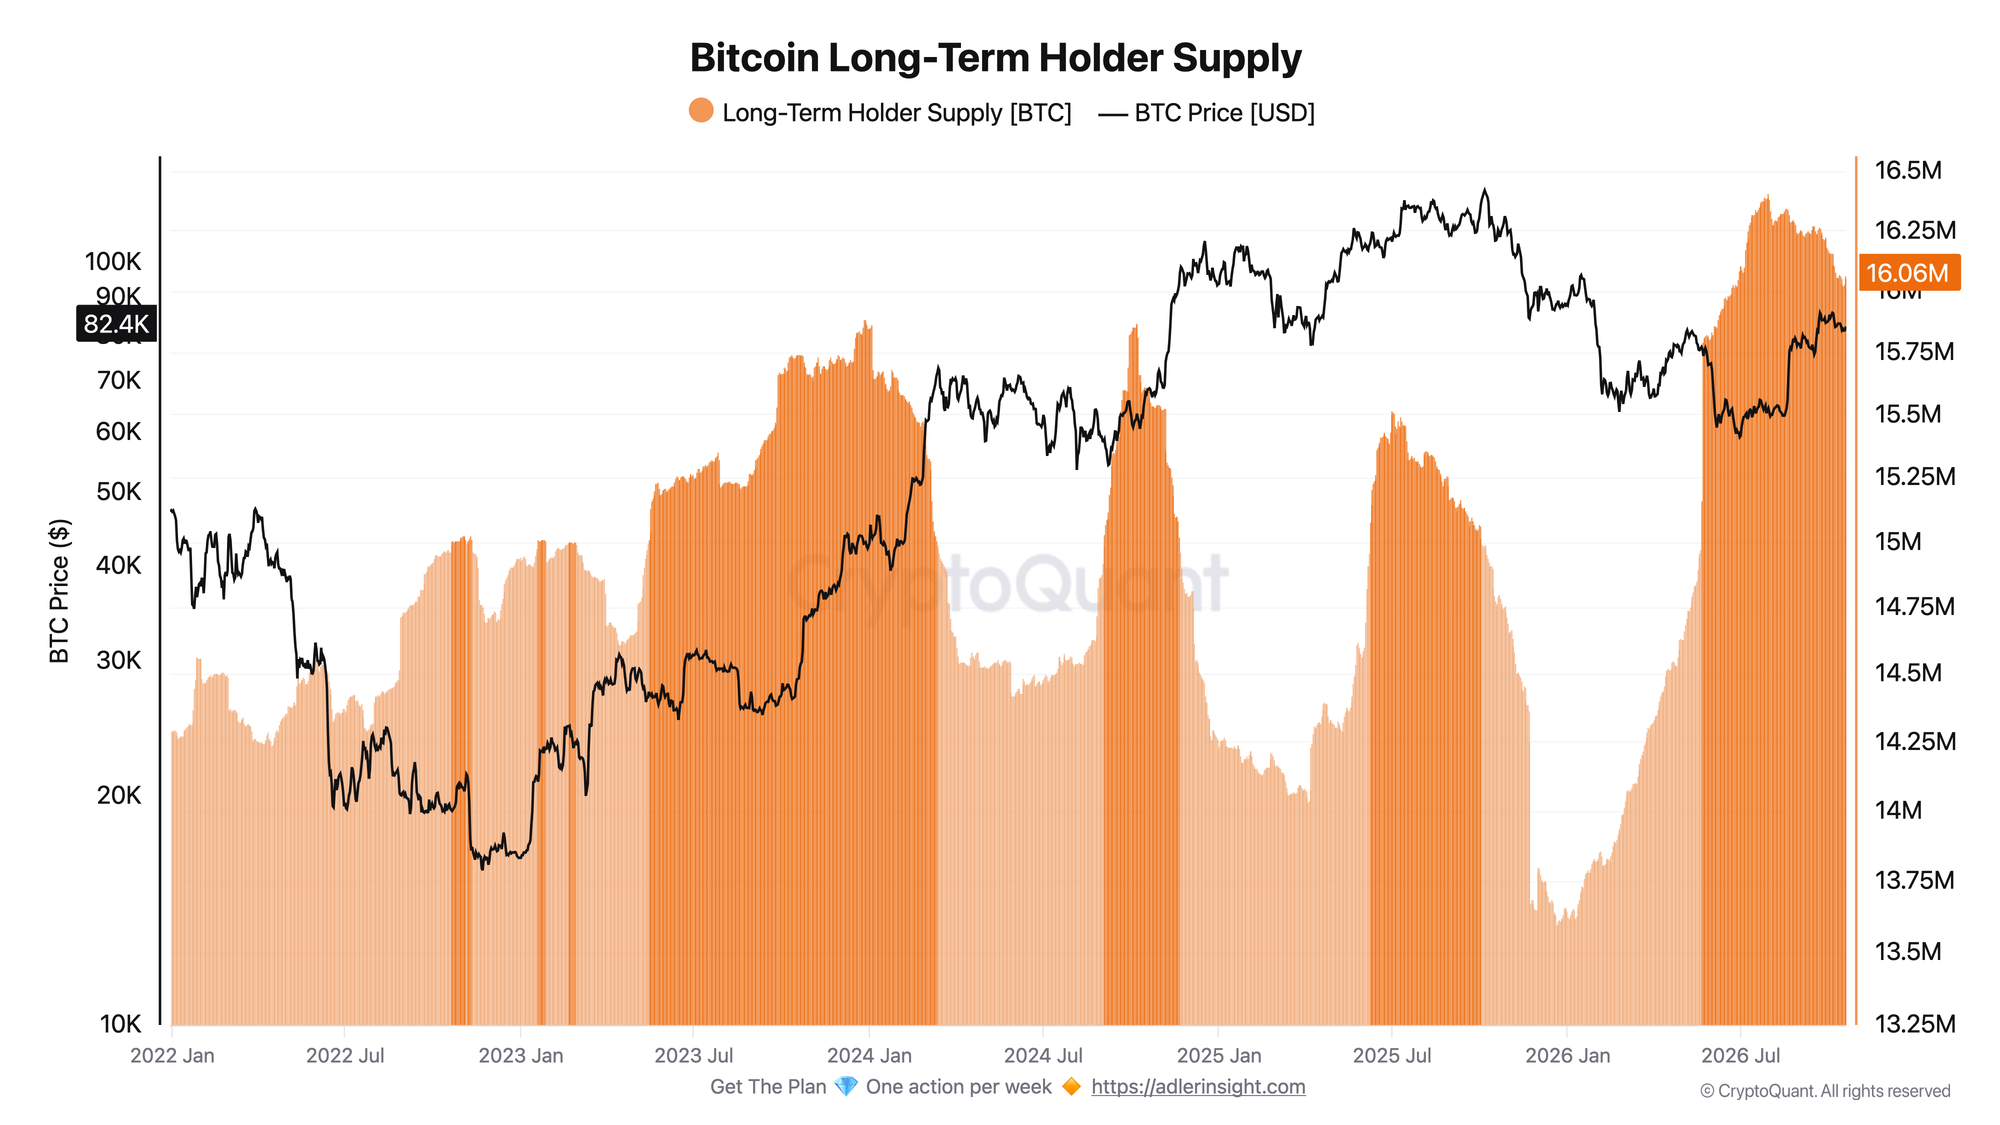
On July 30, long-term holder supply reached 16.41 million BTC; it now stands at 16.06 million BTC. The decline totaled 345,000 BTC, or 2%. Holdings fell by 9,000 BTC over the past week and increased by 40,000 BTC over the past three days.
The indicator in the first chart is calculated from the same supply data, so both charts describe the same phenomenon: the first shows how often the group spends coins, while the second shows how much. If holdings continue to rise for several consecutive weeks, coins entering the group will begin to outweigh its spending.
Invest in Bitcoin without emotional decisions - Start free. Deterministic signals built to remove fear, FOMO, and panic selling.
FAQ
Does a decline of 345,000 BTC mean that this many coins were sold? A coin leaves the group whenever it moves, including transfers between the owner's own wallets. In addition, coins that have remained dormant for a long time continually enter the group, partially offsetting the decline.
Does a reading of 10 out of 15 mean that holders spent coins for 10 consecutive days? No. It is the number of days over the past 15 when the group's holdings declined. The indicator shows spending frequency, not volume.
Conclusions
Long-term holders have reduced their holdings by 345,000 BTC since late July, but their spending frequency has declined in recent days. A return to the usual reading of 7 out of 15 days, together with rising holdings, would reduce supply from this group. The main risk is another rise to 13-15 out of 15 days alongside a renewed decline in holdings. This would mean that old coins are actively reentering circulation.
Live Charts
Explore the metrics behind this brief with live, auto-updating charts:
LTH vs STH Supply - Supply split between long- and short-term holders to track accumulation and distribution.
LTH-SOPR - Long-term holder profit/loss realization around the 1.0 breakeven threshold.
Reserve Risk - Long-term holder conviction relative to price to gauge risk/reward at cycle extremes.
Supply in Profit - Share of circulating supply in profit as a cycle-phase and euphoria gauge.
Holder Behavior - All holder profitability and supply-cohort charts in one view.