


Over the past week, Bollinger Band width has more than halved, reaching its lowest level since mid-September. The Bitcoin Volatility & Flow Index remains below its one-year average, while the direction of the breakout from the narrow range remains unclear.
TL;DR
Price is barely moving, and the Volatility & Flow Index remains below its one-year average. I examine the levels that will indicate which way the market breaks out of the range.
Bitcoin Volatility & Flow Index
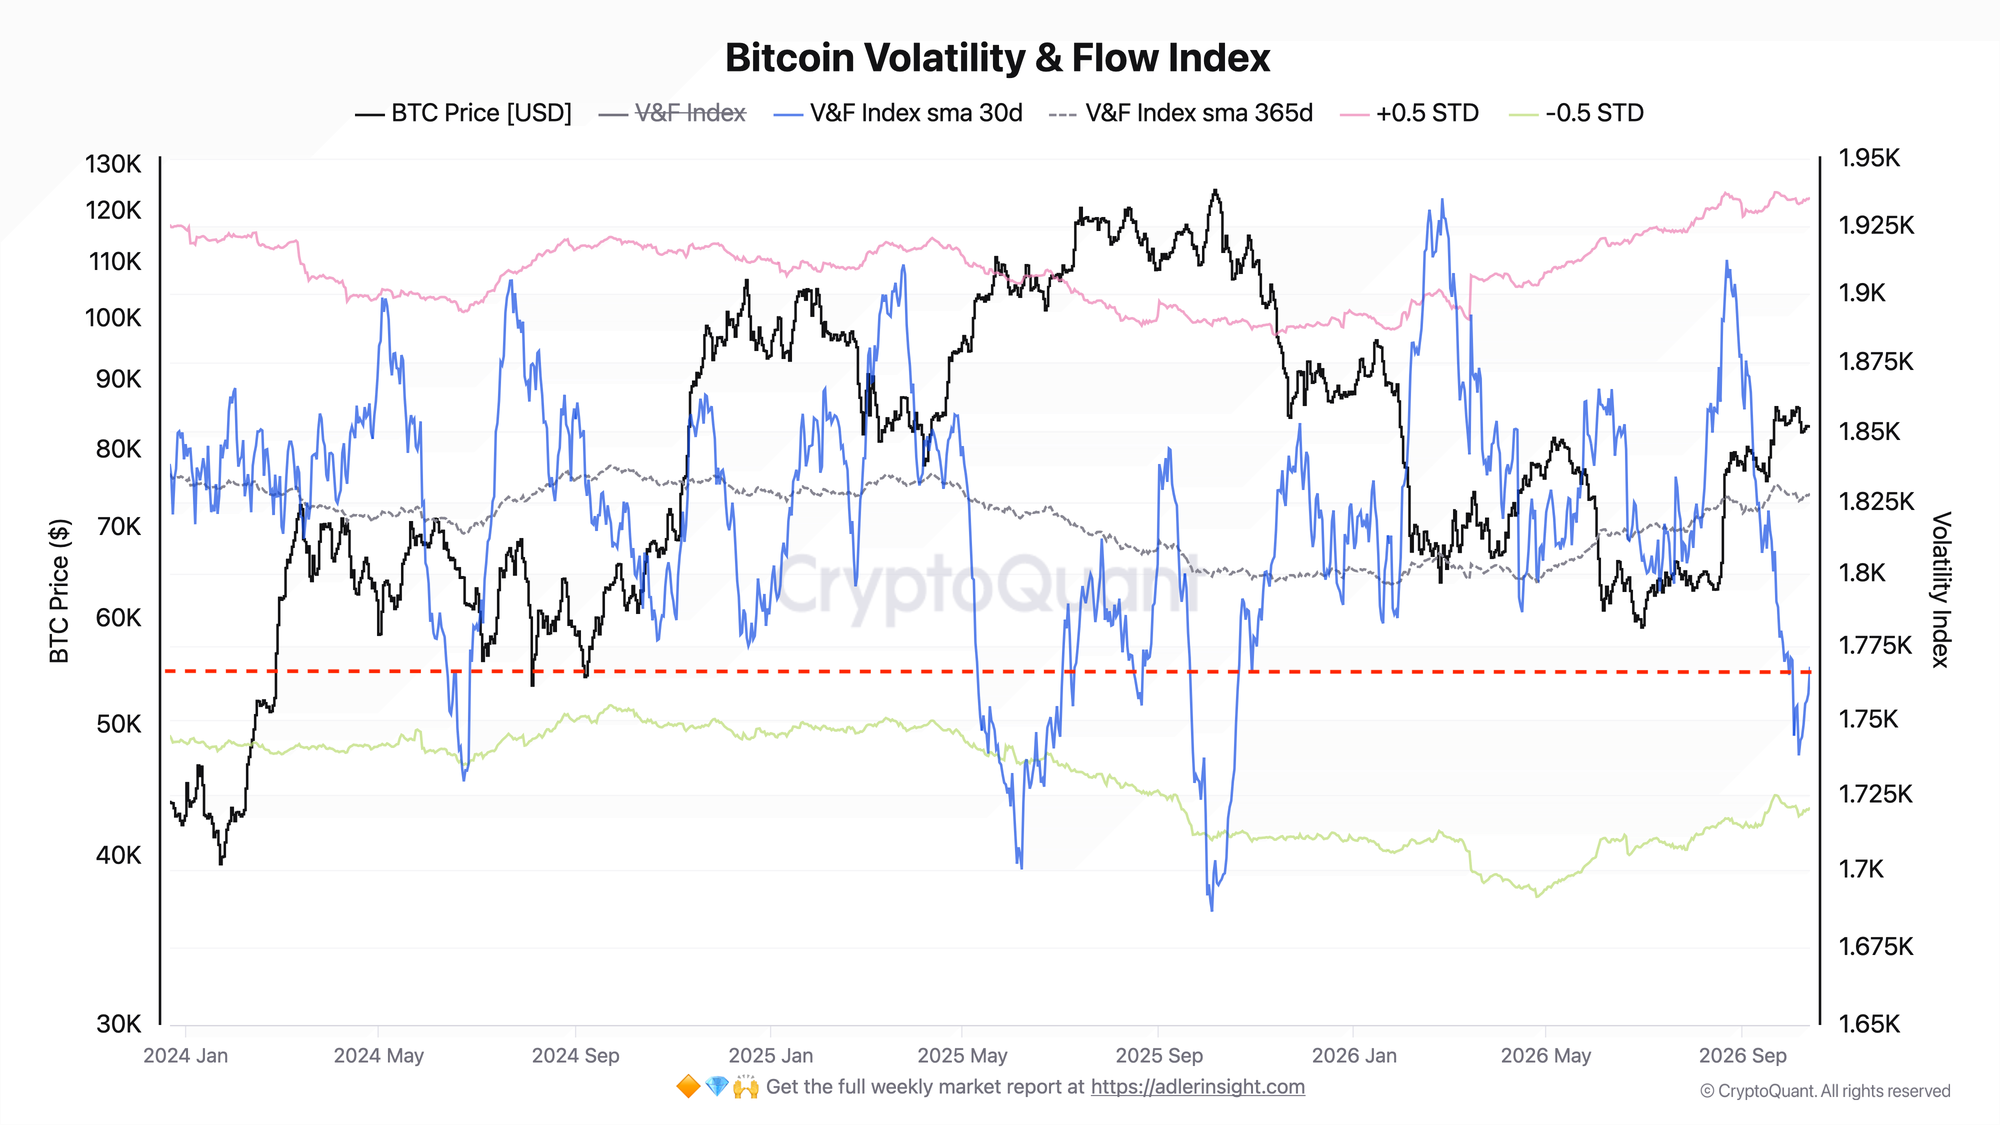
The index combines three metrics: price fluctuations, the ratio of exchange inflows to outflows, and the ratio of market buys to sells. Its 30-day average fell below its one-year average on September 12 and reached a low on October 6. Today, the index stands at 1768 points, compared with a one-year average of 1828.
Daily readings fluctuate sharply, so the 30-day line is the main reference on the chart. While the metric remains below its one-year average, market activity remains lower than over the past year, consistent with the narrow price range. A move back above the one-year average would indicate that activity is recovering, while a price breakout beyond either Bollinger Band would confirm the direction of the move.
Bitcoin: Bollinger Bands Range
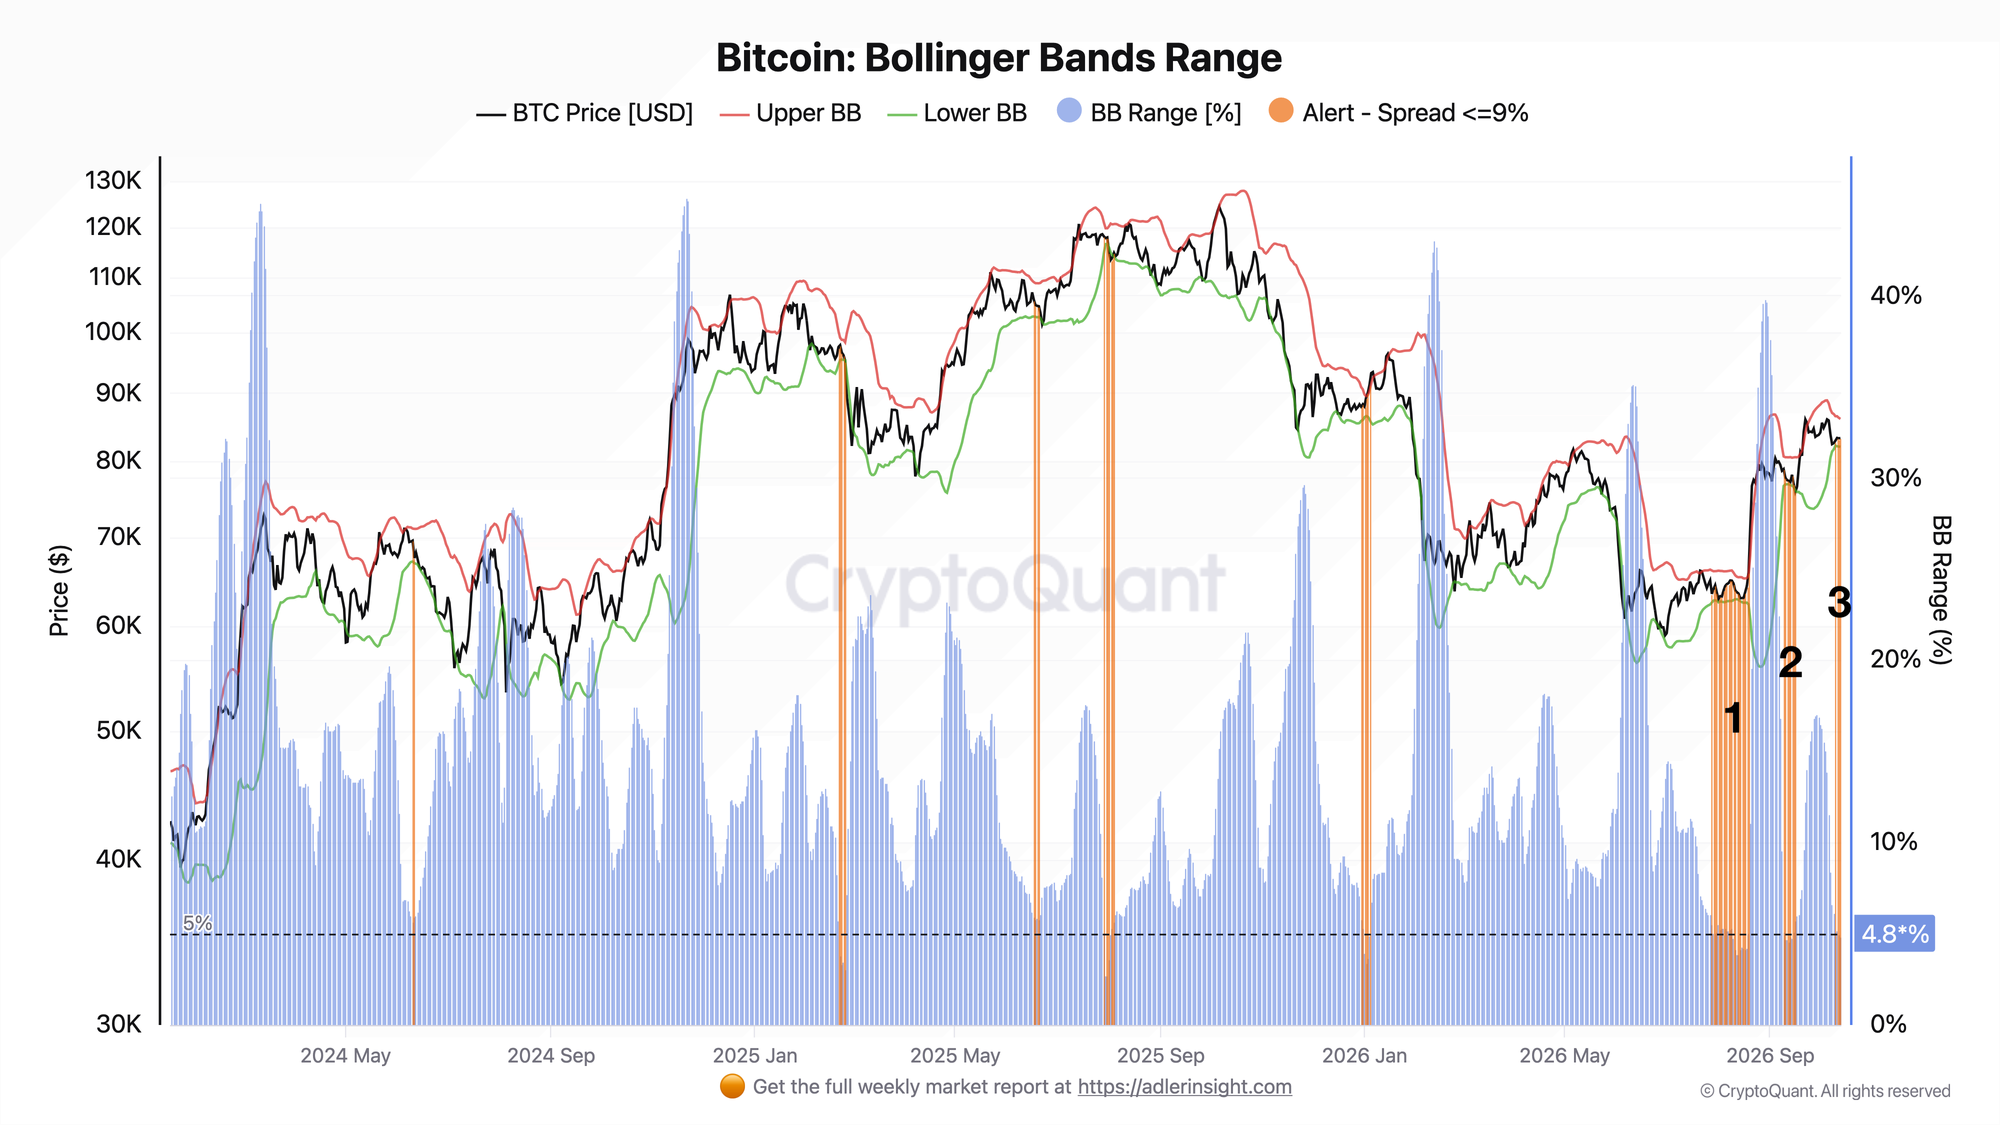
From October 6 to October 13, band width narrowed from 11.6% to 4.9% of the average price. Over that period, Bitcoin fell from $85.8K to $83.2K, with price barely changing in recent days. Today, the upper boundary of the range stands at $86.0K and the lower boundary at $81.9K.
The narrow bands show that price is confined to a tight range and the market has entered a compression phase. If Bitcoin holds above $86.0K, it will signal an upward move. If Bitcoin holds below $81.9K, it will indicate a downward move.
Invest in Bitcoin with discipline, not emotion. Follow a clear, rules-based system built to keep fear, FOMO, and panic selling out of every decision. Subscribe now.
FAQ
Do narrow bands mean the price will rise or fall? Narrow bands indicate market compression, but they do not reveal the direction or timing of the next move.
Does a low index mean coins are being sold? No. Low readings reflect weak on-chain and exchange activity.
Conclusions
Bollinger Band width has fallen to its lowest level since mid-September. The key levels are $86.0K on the upside and $81.9K on the downside. Holding above the upper boundary alongside an increase in market buys would improve the outlook. The main risk is a move below the lower boundary.
Live Charts
Explore the metrics behind this brief with live, auto-updating charts:
Exchange Netflow - Net BTC moving to and from exchanges across positive and negative flow regimes.
Coinbase Premium Index - Coinbase vs global market premium as a proxy for US spot demand pressure.
Open Interest (BTC) - Total futures positioning and 7-day BTC-denominated change.
Funding Rates - Perpetual futures funding to track long-side or short-side leverage pressure.
Fear & Greed Index - Composite market sentiment for risk appetite and sentiment extremes.