
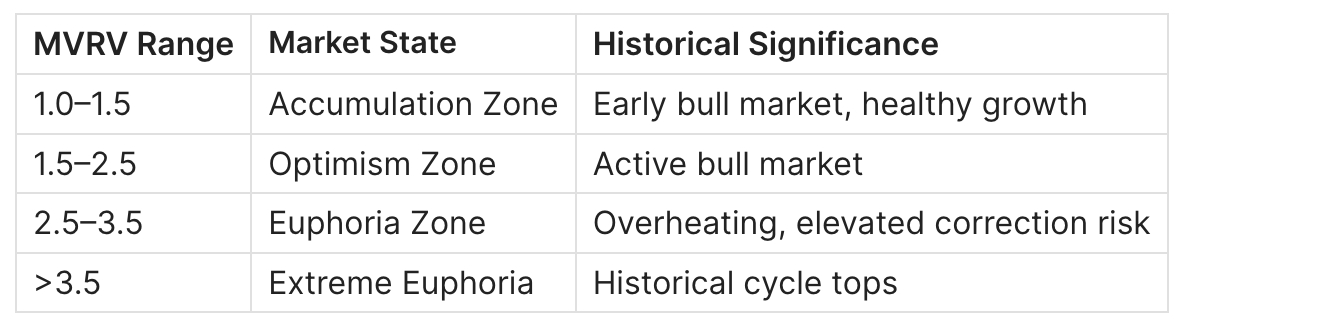
MVRV Ratio (Market Value to Realized Value) is the ratio of
Bitcoin's Market Cap to Realized Cap. Formula: MVRV = Market Cap /
Realized Cap. Above 3.5 signals a cycle top zone; below 1.0 signals
undervaluation and historically the best accumulation zone.
Last updated: April 5, 2026
Current MVRV Ratio
| MVRV Ratio | 1.27 |
| 7-Day Change | +3.5% (from 1.23) |
| 30-Day Average | 1.28 |
| Zone | 🟢 Bull market range — market 27% above aggregate cost basis |
Updated April 5, 2026 · Want daily MVRV signals? Join Adler AM
What Is MVRV Ratio?
MVRV Ratio shows the relationship between Bitcoin's market capitalization (Market Cap) and realized capitalization (Realized Cap). Essentially, it's a multiplier showing how much the current market valuation deviates from "fair value" -the average cost basis of all coins in the network.
Formula:
MVRV Ratio = Market Cap / Realized Cap
Where:
- Market Cap - current BTC price × number of coins in circulation
- Realized Cap - sum of all UTXO values at the price of their last movement
Why Is MVRV Important?
Market Cap values all coins at the current market price, which creates distortion: coins purchased at $100 and at $60,000 are counted equally. Realized Cap solves this problem by valuing each coin at its last transaction price. MVRV shows how much the market is "overvalued" or "undervalued" relative to actual economic activity.
Data Sources:
- Glassnode - original source of the metric
- CryptoQuant - alternative provider
- Bitcoin Magazine Pro - free charts
- LookIntoBitcoin - free access
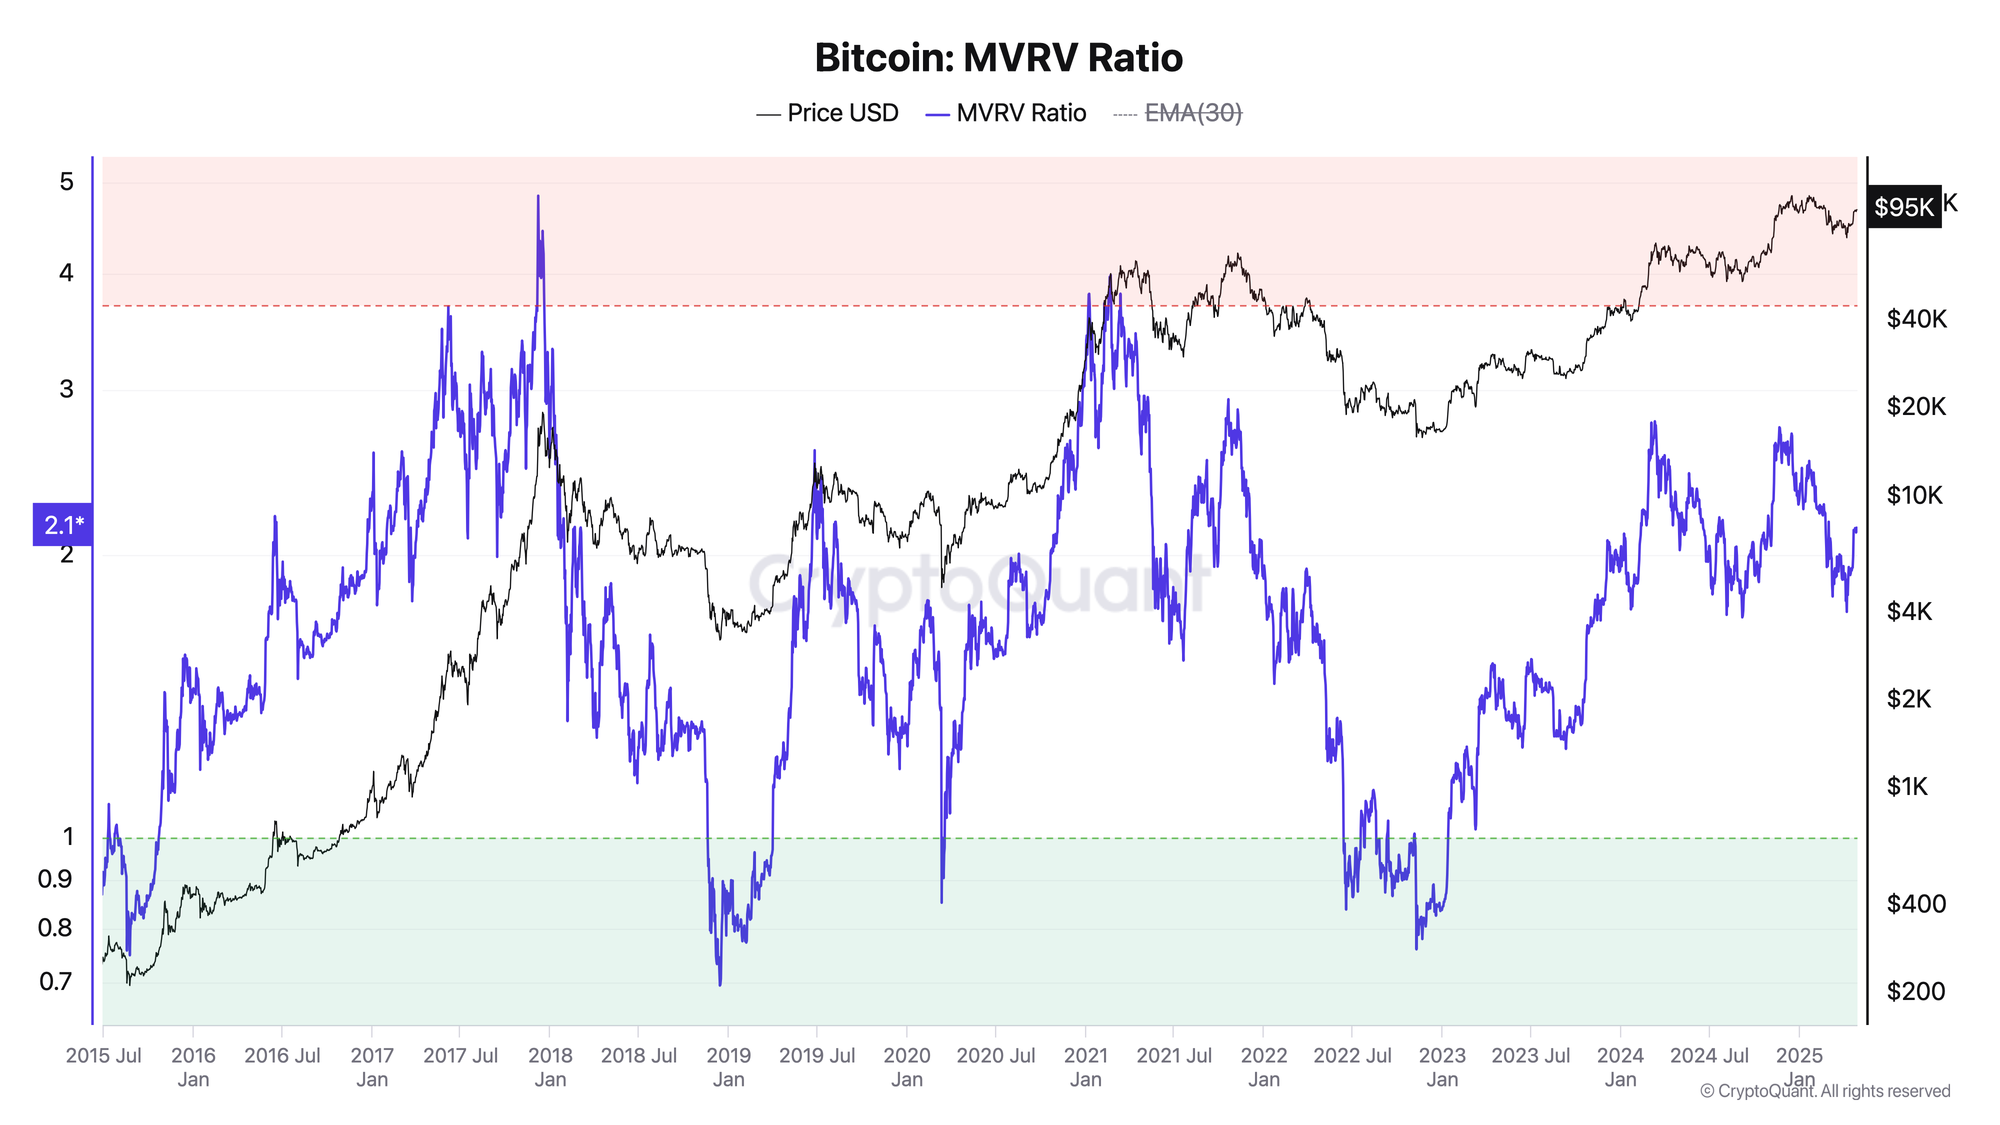
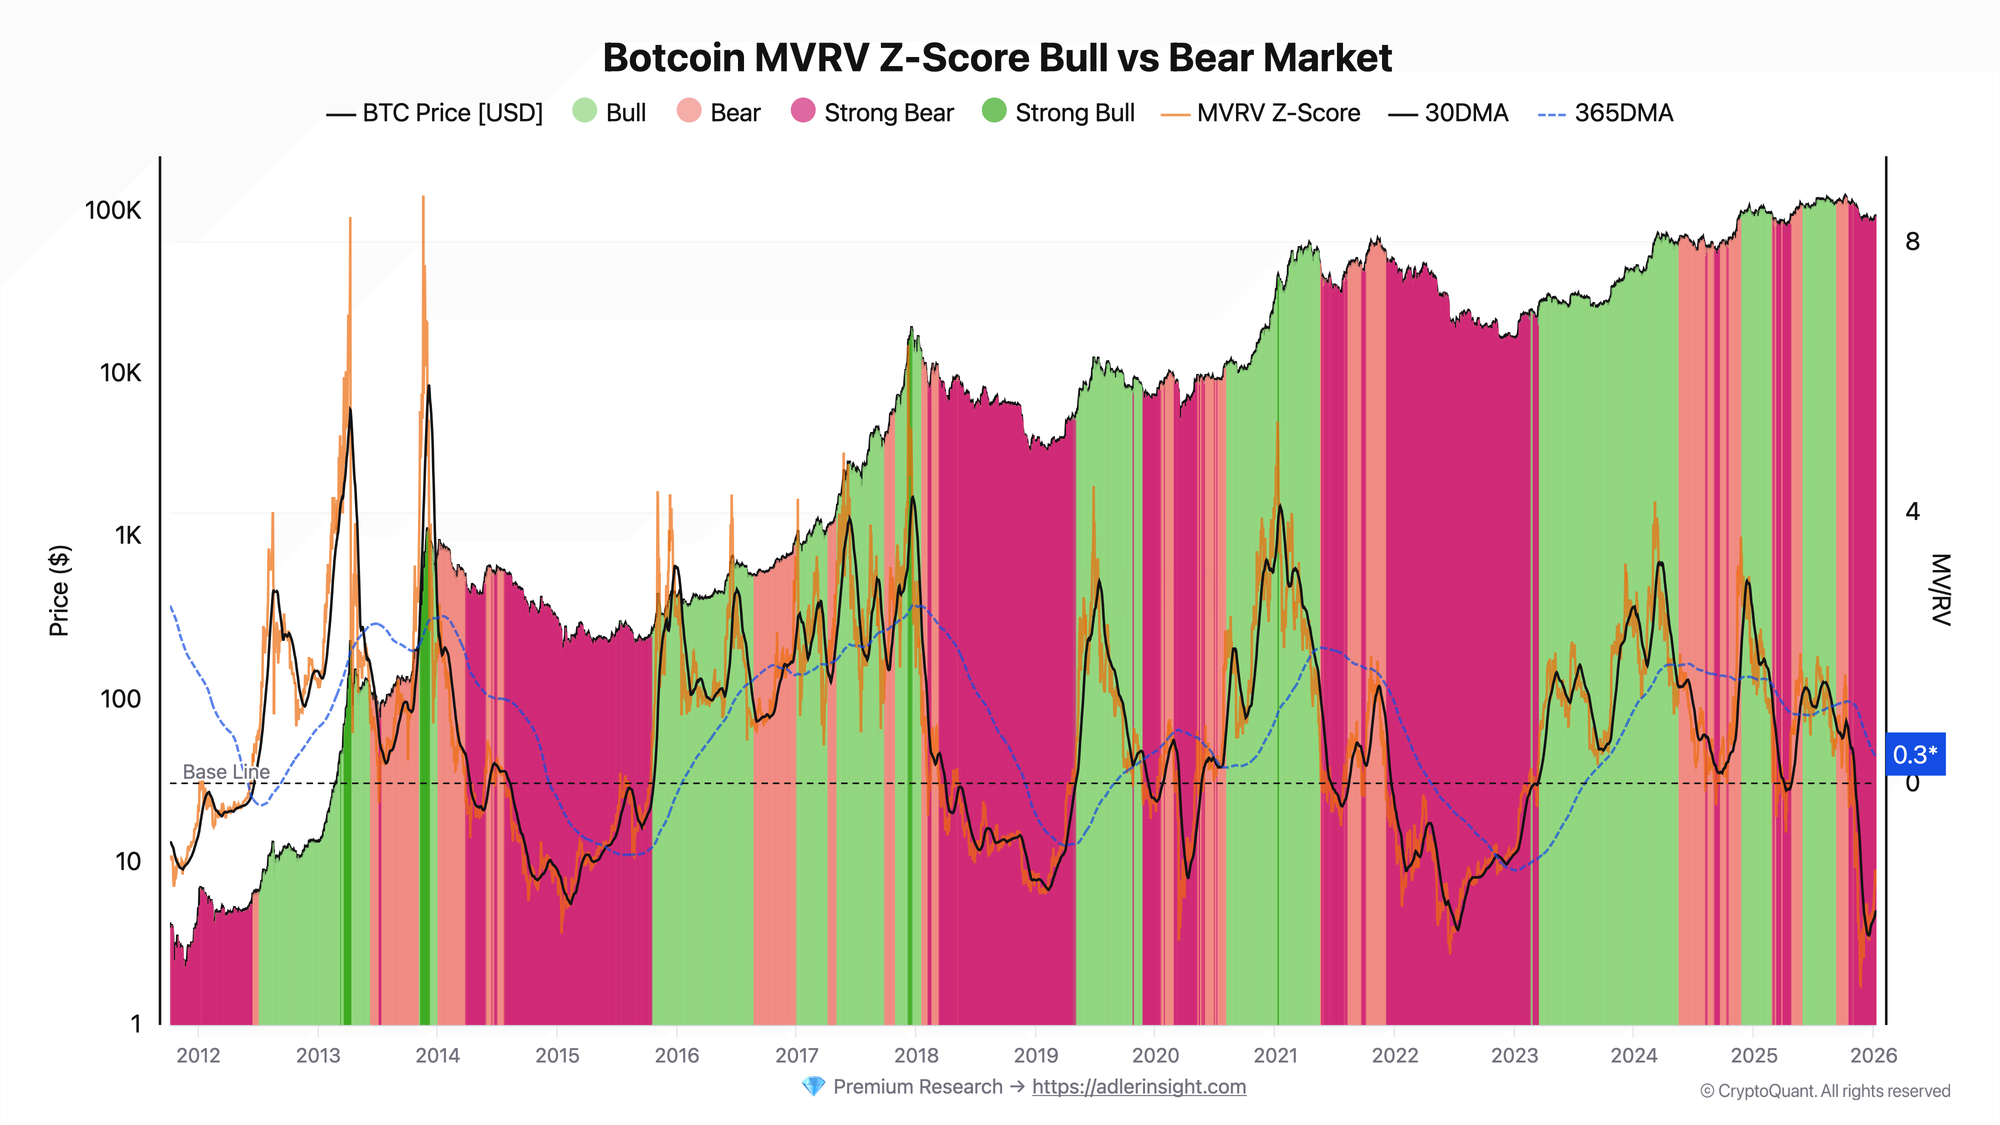
Bitcoin MVRV Ratio Cycle Top Signal: The 3.5 Threshold
Historically, MVRV Ratio values above 3.5 have coincided with
Bitcoin cycle tops. At this level, the average market participant
holds 3.5x unrealized profit relative to their cost basis —
historically the point where profit-taking pressure overwhelms
new demand.
Key threshold levels:
- Above 3.5: Cycle top zone — elevated distribution risk
- 1.0–3.5: Bull market range — healthy appreciation
- Below 1.0: Undervalued zone — historically a buy signal
- Below 0: Extreme capitulation — rare but highest conviction buy
The 3.5 threshold triggered at the 2021 cycle top (MVRV reached
7.0 at the April peak) and provided early warning before the
major correction. In the 2017 cycle, MVRV exceeded 5.0 before
the crash.
How MVRV Ratio Is Calculated
Step 1: Calculate Market Cap
Market Cap - a standard metric used across all financial markets:
Market Cap = Current BTC Price × Circulating Supply
Example: At a price of $100,000 and 19.8M BTC in circulation: Market Cap = $100,000 × 19,800,000 = $1.98 trillion
Step 2: Calculate Realized Cap
For each UTXO in the network, the price at the time of its creation (last movement) is determined, then all values are summed:
Realized Cap = Σ (UTXO_amount × Price_at_last_movement)
Example: If there are only three UTXOs in the network:
- 1 BTC, last moved at $10,000
- 0.5 BTC, last moved at $50,000
- 2 BTC, last moved at $30,000
Realized Cap = ($10,000 × 1) + ($50,000 × 0.5) + ($30,000 × 2) = $95,000
Step 3: Calculate the Ratio
MVRV is obtained by dividing Market Cap by Realized Cap:
Process Visualization:
[Current Price: $100,000] × [19.8M BTC] = Market Cap ($1.98 trillion)
                              ↓
[UTXO 1 @ $10K] + [UTXO 2 @ $50K] + ... = Realized Cap (~$800 billion)
                              ↓
              MVRV = $1.98 trillion / $800 billion = 2.48
                              ↓
        Market is trading 148% above "fair value"
How to Interpret MVRV Ratio Values
MVRV > 1 -Market in Aggregate Profit
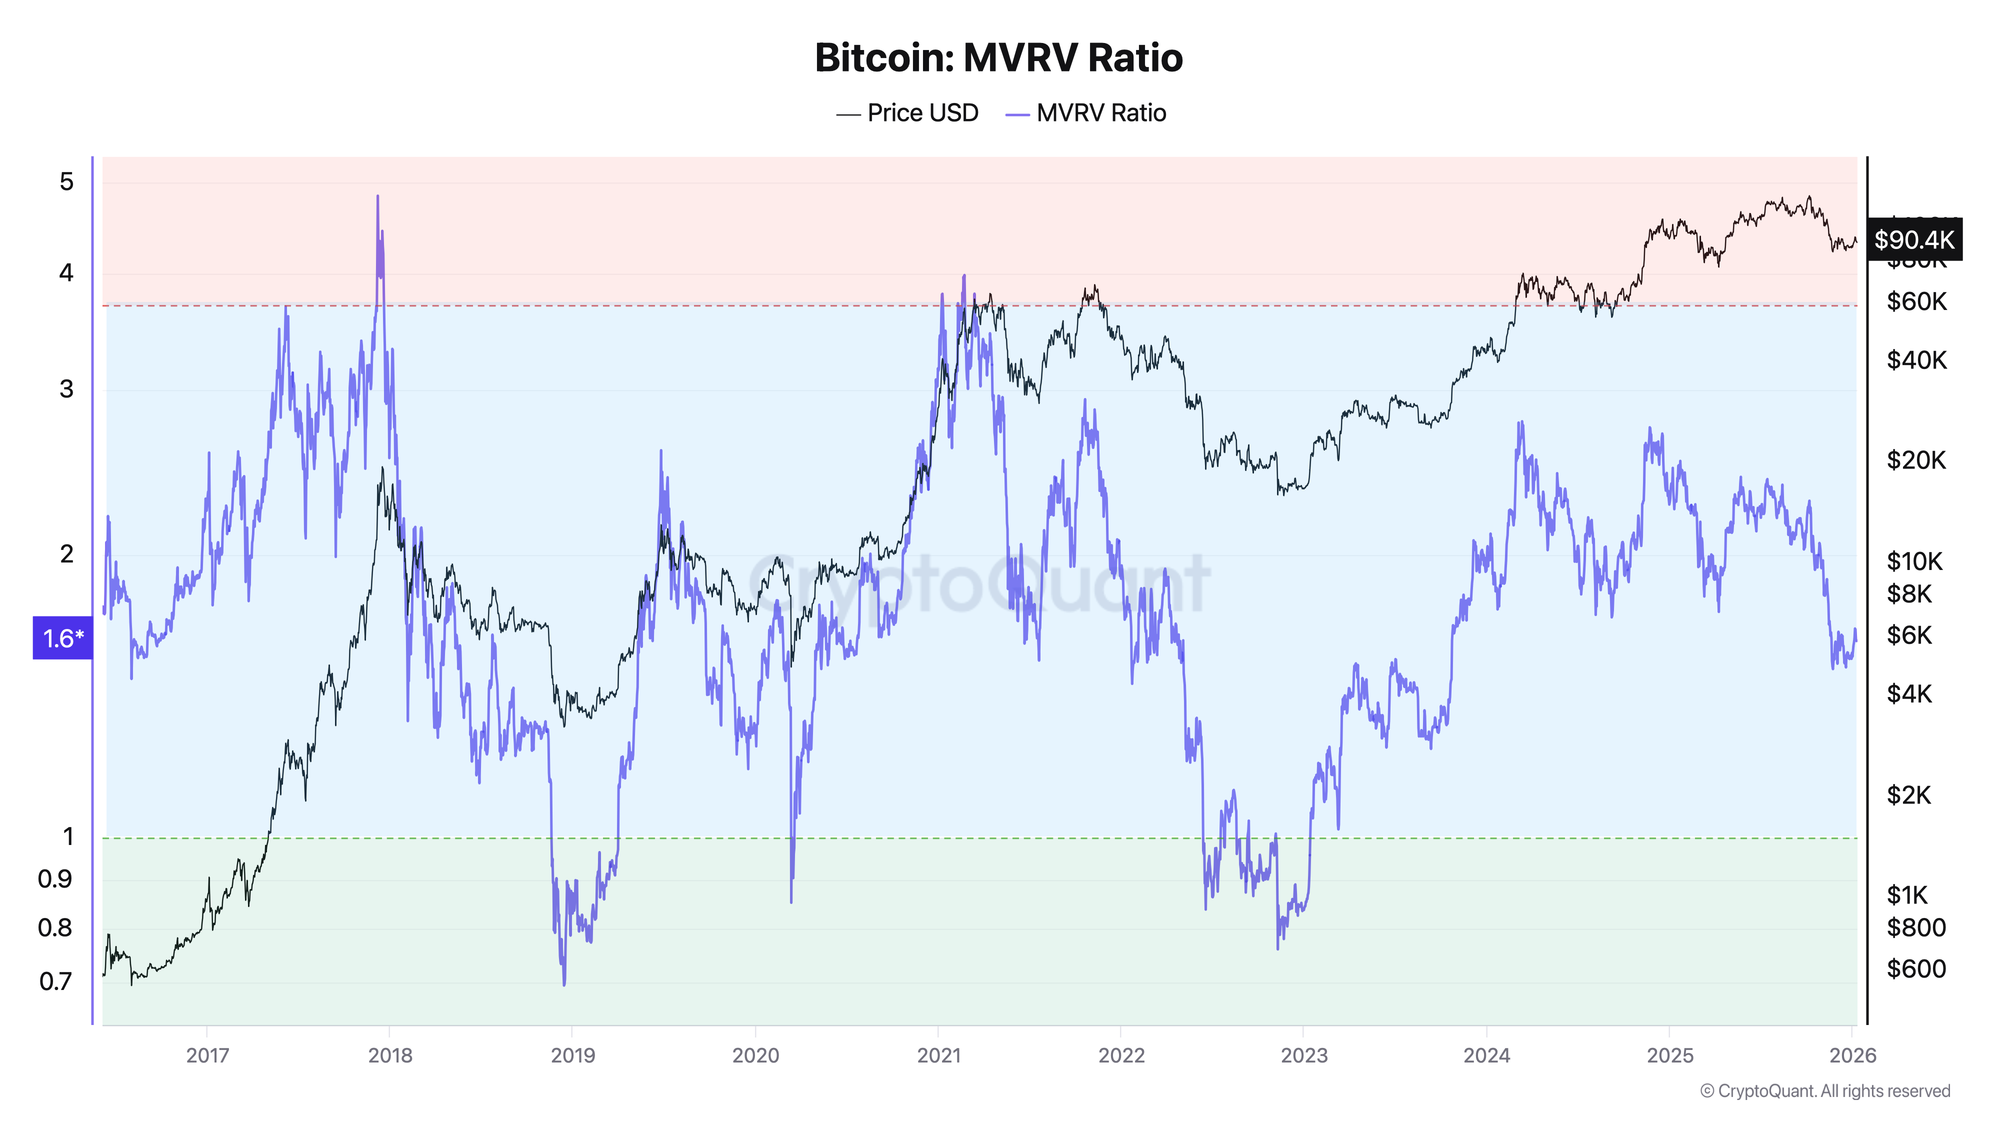
What It Means:
- Market Cap exceeds Realized Cap
- Average market participant is in profit
- Profit-taking pressure exists
Interpretation Zones:
MVRV < 1 -Market in Aggregate Loss
What It Means:
- Market Cap is below Realized Cap
- Average market participant is at a loss
- Historically rare condition signaling capitulation
Market Context:
- 2015: MVRV dropped to 0.58 at the cycle bottom (~$200)
- 2018-2019: MVRV reached 0.69 ($3,200)
- 2022: MVRV dropped to 0.76 after FTX collapse (~$15,500)
MVRV = 1 -Equilibrium Point
What It Means:
- Market Cap equals Realized Cap
- Average participant is "break-even"
- Critically important support/resistance level
Market Context:
MVRV Ratio Trading Signals
Historical Example 1: 2017 Cycle Top
Situation: December 2017, BTC reaches $20,000
MVRV Behavior:
- MVRV reached 4.84 (December 7) -cycle historical maximum
- Remained in extreme euphoria zone for over 2 weeks
- All holder categories were taking profits
Conclusion: MVRV above 4.0 historically preceded 80%+ corrections.
Historical Example 2: 2018-2019 Cycle Bottom
Situation: December 2018, BTC drops to $3,200
MVRV Behavior:
- MVRV dropped to 0.69 (December 14)
- Remained below 1.0 for about 4 months
- Long-term holders actively accumulated
Conclusion: MVRV below 0.7 has historically been the best zone for long-term accumulation.
Historical Example 3: 2021 Double Top
Situation: February and November 2021
MVRV Behavior:
- February 2021: MVRV peaked at 3.98 (February 21) at ~$58,000 level
- April 2021: local peak of 3.45 at $64,000 level
- Correction to $29,000, MVRV dropped to 1.61
- November 2021: MVRV reached only 2.86 at $69,000 (divergence)
Conclusion: Declining peak MVRV values with rising price -a sign of weakening cycle and macro top formation.
Historical Example 4: 2024 Cycle
Situation: Growth following halving and ETF launch
MVRV Behavior:
- Growth from ~1.3 (October 2023) to 2.78 (March 2024)
- Correction to 1.73 in August 2024
- Recovery to 2.5–2.7 zone by December 2024
Conclusion: The ETF cycle structure shows smoother MVRV dynamics compared to previous cycles.
Practical Application
Buy Signal:
- MVRV drops below 1.0 or into the 0.6–1.0 zone
- Confirmation: STH SOPR < 1, negative Exchange Netflow
- Historically: best points for long-term accumulation
Caution/Sell Signal:
- MVRV reaches 3.0+ zone and above
- Confirmation: LTH distributing, high Funding Rate
- Time for partial profit-taking or hedging
MVRV Ratio vs MVRV Z-Score
What Is MVRV Z-Score?
MVRV Z-Score - a normalized version of MVRV that accounts for standard deviation. This allows comparing extremes across different cycles on a unified scale.
Formula:
MVRV Z-Score = (Market Cap - Realized Cap) / Std Dev(Market Cap)
Metric Comparison
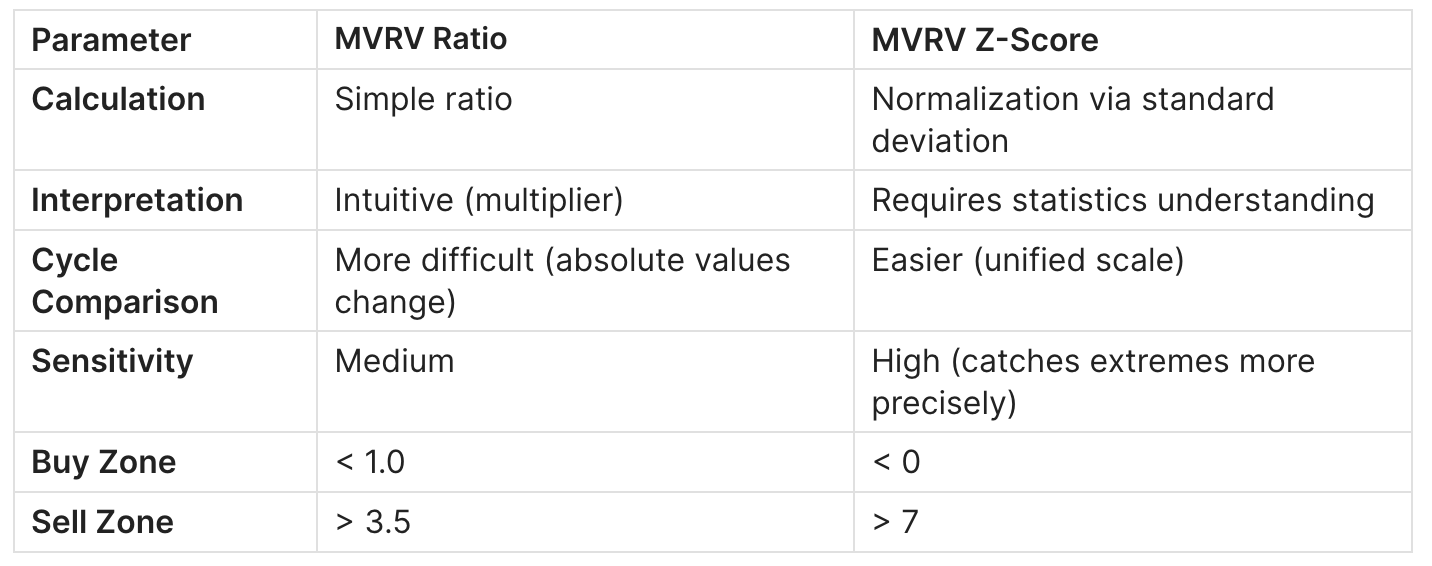
When to Use Which
MVRV Ratio is better for:
- Quick assessment of current market state
- Intuitive understanding (how many times market is above cost basis)
- Beginning analysts
MVRV Z-Score is better for:
- Precise identification of cyclical extremes
- Comparing different cycles on a unified scale
- Building quantitative trading systems
Combined Analysis
The strongest signals occur when multiple indicators align:
MVRV < 1.0 + Z-Score < 0 + STH SOPR < 1
= Extreme capitulation
→ Historically best buying opportunities

MVRV > 3.5 + Z-Score > 7 + LTH SOPR > 3
= Extreme euphoria
→ High risk of top formation
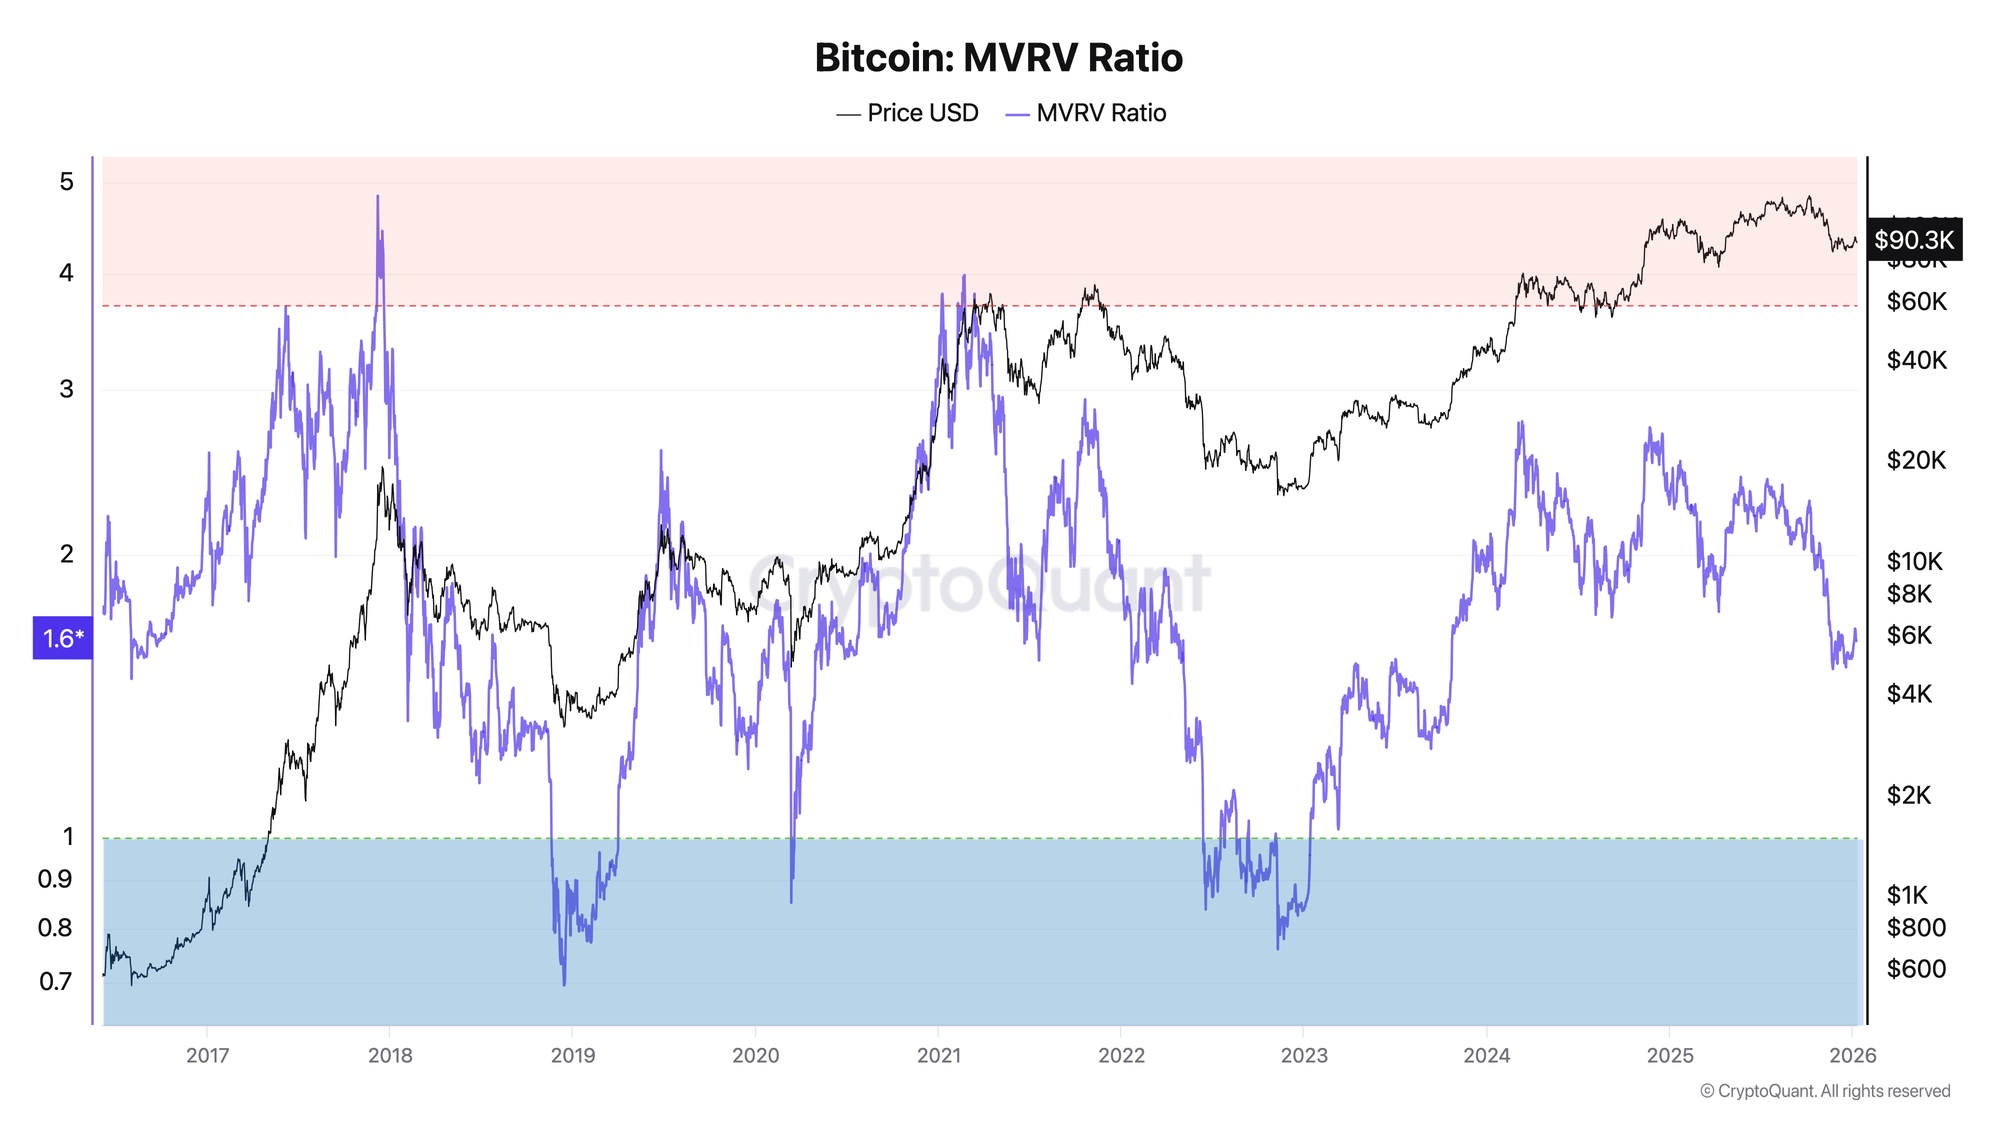
MVRV vs Realized Price Bands vs NUPL
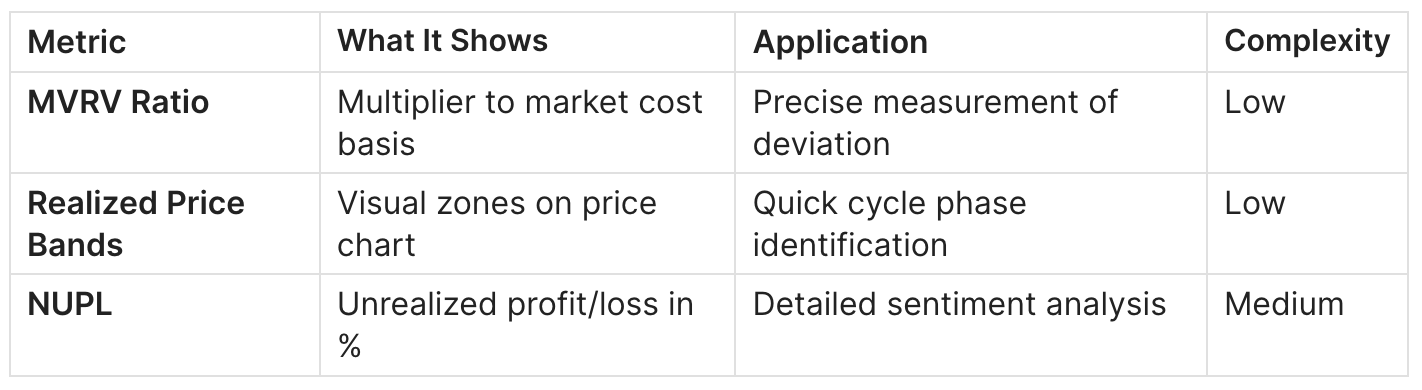
Relationship Between Metrics
All three metrics are based on Realized Cap and show similar information in different ways:
MVRV = 2.0  ←→  Price = 2.0× Realized Price  ←→  NUPL = 50%
MVRV = 1.0  ←→  Price = Realized Price       ←→  NUPL = 0%
MVRV = 0.5  ←→  Price = 0.5× Realized Price  ←→  NUPL = -50%
Read more about Realized Price Bands in the guide Bitcoin Realized Price Bands: What It Is and How to Use It.
MVRV Ratio Limitations
When the Indicator Doesn't Work
1. New Market Structures
- ETFs, institutions, and MicroStrategy change the dynamics
- Historical threshold values may shift
- Solution: follow updated research, adapt thresholds
2. Extended Periods in Extremes
- Market can remain "overvalued" for months
- MVRV > 3 doesn't mean immediate correction
- Solution: use as a risk filter, not precise timing
3. Intra-Cycle Corrections
- Healthy bull market corrections may not reach MVRV = 1
- False buy signals at MVRV 1.5–2.0
- Solution: combine with STH SOPR and short-term metrics
4. Lost Coins
- Realized Cap includes Satoshi's "dead" coins and lost keys
- Distorts the real cost basis of active participants
- Solution: use Adjusted MVRV or MVRV by cohorts
Which Indicators to Combine With
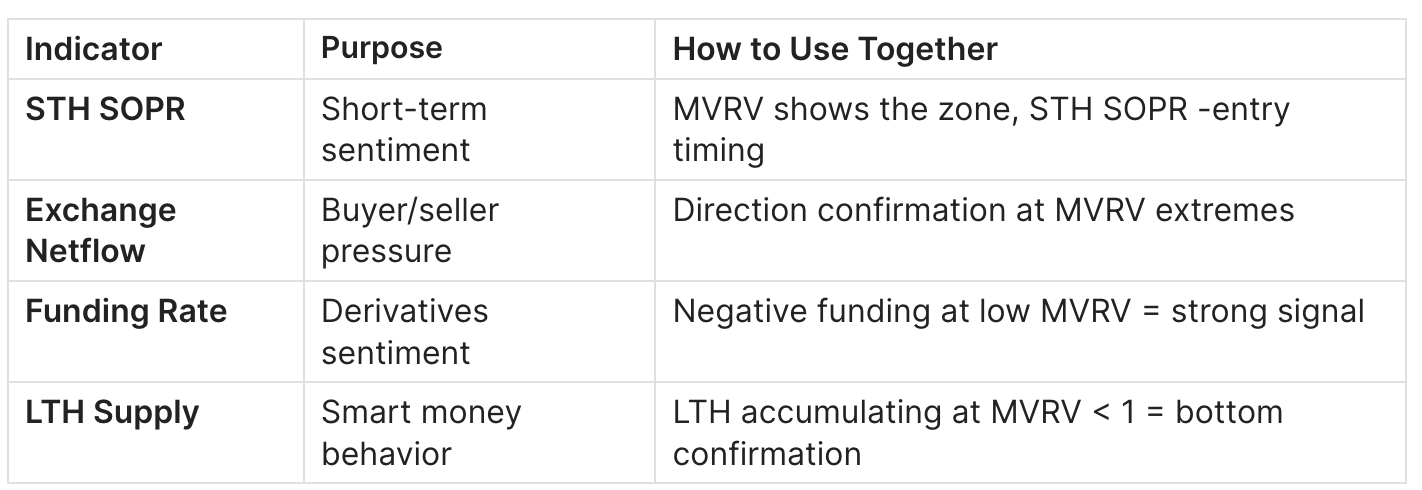
Read more about STH SOPR in the guide Bitcoin STH SOPR: What It Is and How to Use It.
FAQ
What Is the Current MVRV Value?
MVRV changes dynamically. Current data is available on Glassnode, CryptoQuant, and LookIntoBitcoin. Current MVRV analysis and other on-chain metrics are published in ADLER AM - daily morning briefs on the Bitcoin market. Detailed Bitcoin market analysis is published on Substack, subscribe via AdlerInsight.
Where to Find MVRV Ratio Data?
Free:
- LookIntoBitcoin -MVRV and Z-Score
- Bitcoin Magazine Pro -basic charts
- CryptoQuant -requires registration
Paid (extended data):
- Glassnode Studio -from $39/month
- CryptoQuant Pro -from $29/month
Why Was 2017 MVRV Higher Than 2021?
Several reasons:
- Smaller Realized Cap base in 2017 (fewer transactions at high prices)
- Institutionalization - ETFs, Grayscale, and corporations distributed profits more evenly
- More experienced market - participants take profits earlier
This doesn't mean future tops will be lower - market structure continues to evolve.
Can MVRV Be Used for Altcoins?
MVRV can be calculated for any UTXO-based cryptocurrency. An adapted version exists for Ethereum. However:
- Historical threshold values are specific to Bitcoin
- Altcoins have different holder structures
- Less historical data for validation
How Reliable Is the Indicator?
MVRV is one of the most reliable macro indicators for Bitcoin:
- 100% success rate in identifying cyclical tops (MVRV > 3)
- 100% success rate in identifying cyclical bottoms (MVRV < 1)
- Has worked since 2011
However:
- Not suitable for short-term trading
- Requires patience (extremes can last months)
- Historical thresholds may change in new market conditions
Conclusion
MVRV Ratio - a fundamental tool for determining Bitcoin's fair value and identifying cycle extremes. Key principles:
- MVRV = multiplier to cost basis. Shows how many times the market is valued above or below the average entry price of all participants
- MVRV < 1 = capitulation. Historically best points for long-term accumulation
- MVRV > 3 = euphoria. Elevated risk zone requiring caution
- Z-Score for precision. Use MVRV Z-Score to compare different cycles
- Context matters more than value. Combine with STH SOPR, Exchange Netflow, and Funding Rate for reliable signals
- Adapt to new conditions. ETFs and institutions may change historical patterns
This material is for educational purposes only and is not investment advice.