
Open Interest tells you how much leverage is in the system. Funding Rate tells you which direction that leverage is pointed. Neither metric alone is sufficient - combined, they form the most complete picture available of Bitcoin derivatives market structure.
Last updated: April 5, 2026
Current Open Interest & Funding Rate
| BTC Open Interest (All Exchanges) | $22.2B |
| 7-Day OI Change | +3.1% (from $21.5B) |
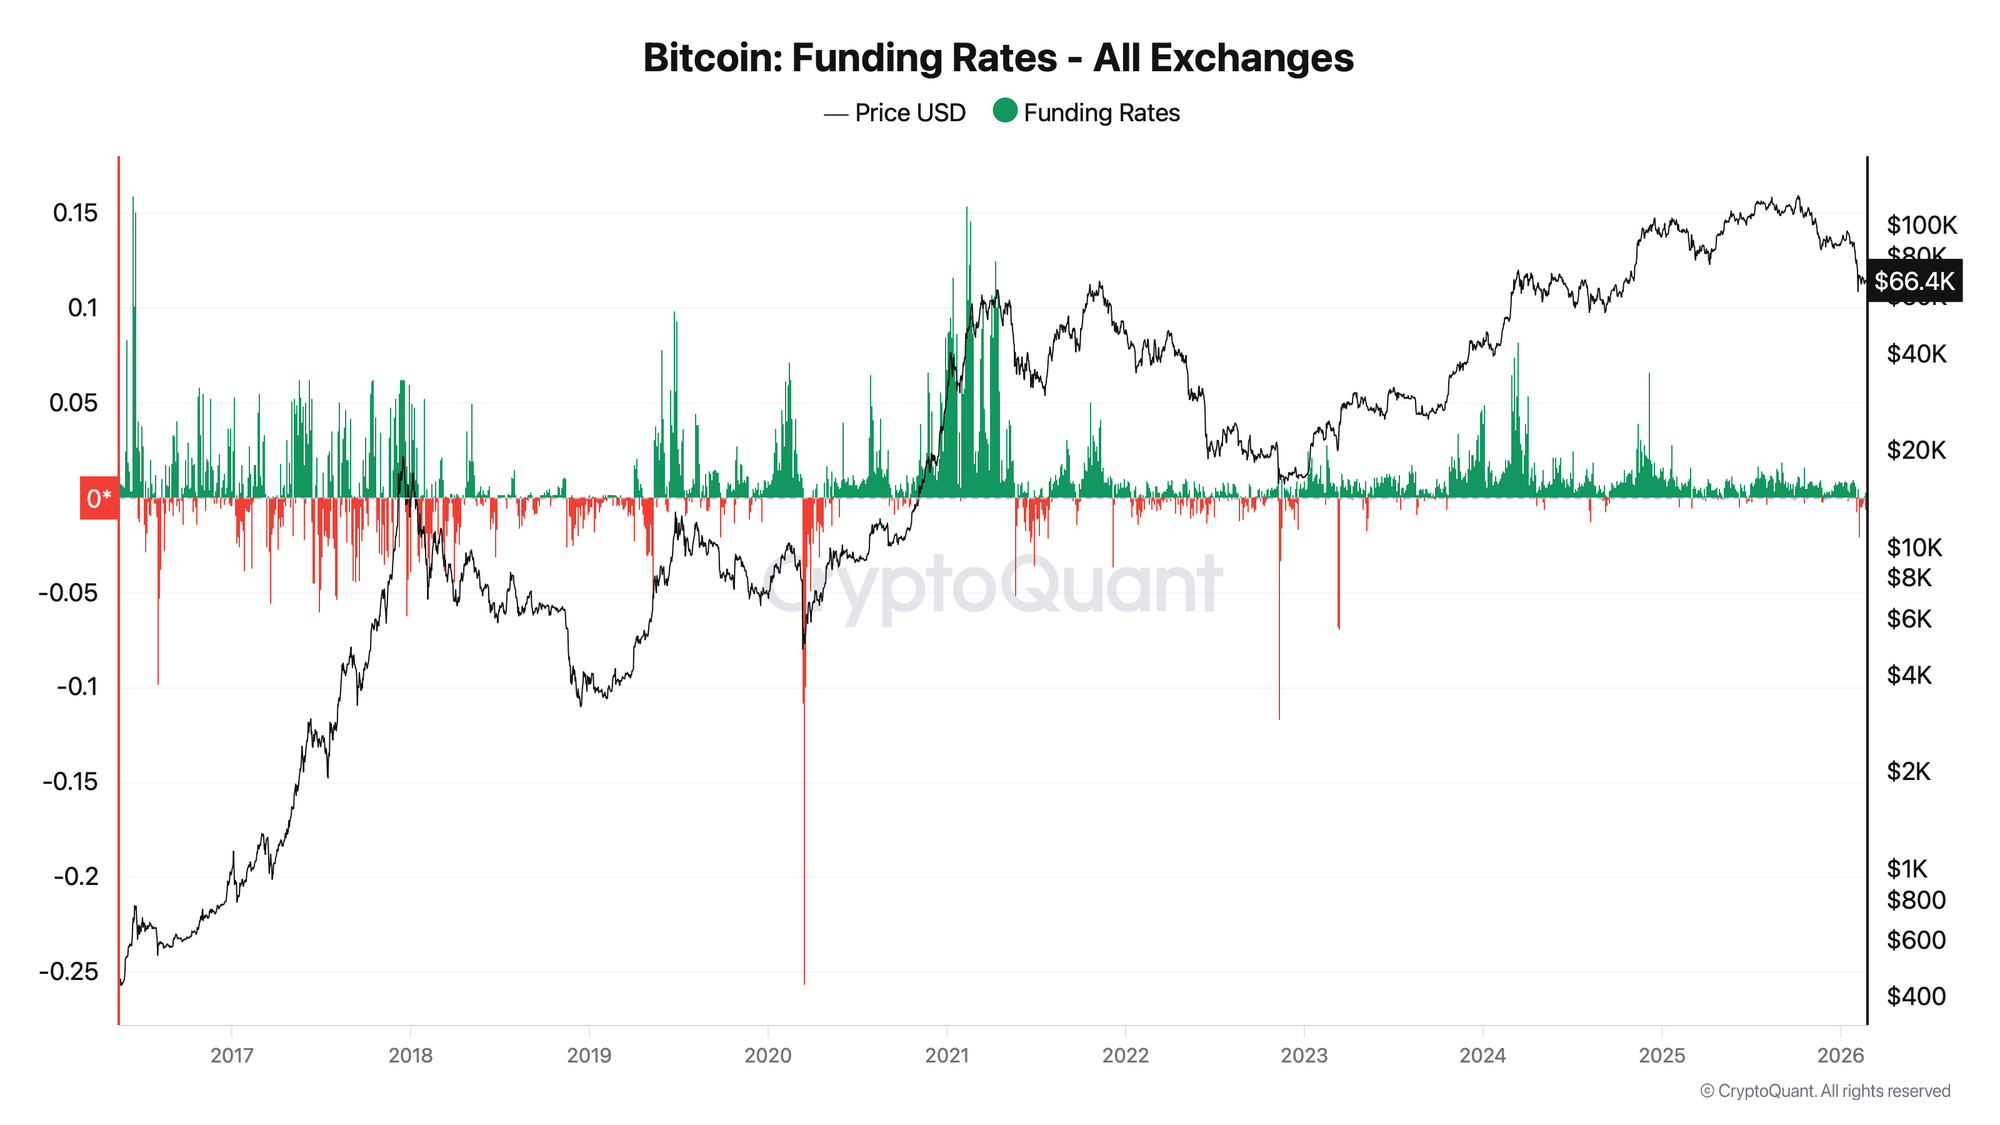
| Avg Funding Rate (Daily) | -0.1135% |
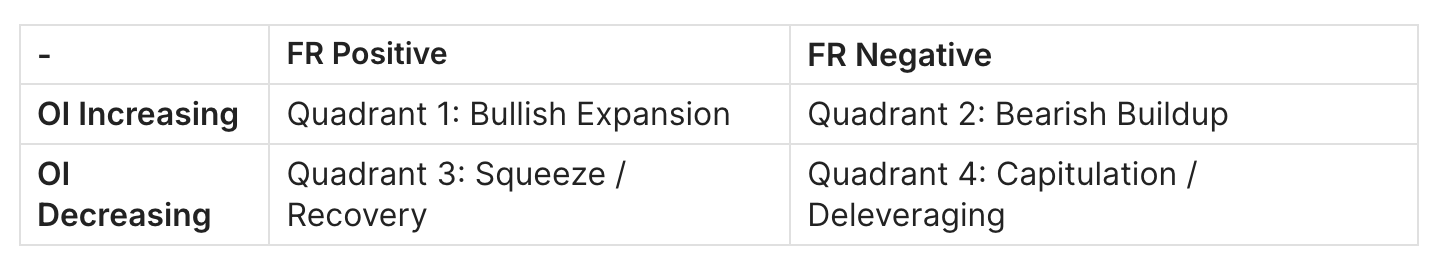
| Quadrant | 📈 Rising OI + Negative FR = Bearish Leverage Building |
Updated April 5, 2026 · Want daily OI & funding signals? Join Adler AM
The core principle: OI rising + FR rising = leverage accumulating in the direction of the trend. This state is self-sustaining until it isn't - and when it breaks, it breaks fast.
Historical framework below ↓
TL;DR
- Open Interest (OI): Total USD value of all active BTC futures and perpetual contracts across all exchanges. Measures leverage in the system, not direction.
- Funding Rate (FR): Periodic payment between longs and shorts in perpetual contracts. Measures directional bias and cost of holding.
- Combined signal: OI alone is directionally neutral. FR alone has high false-signal rate in trends. Together, they define 4 market quadrants - each with distinct risk/reward profile.
- Main use case: Identifying leverage accumulation before tops, OI resets as bottoming signals, and divergence patterns that precede major moves.
- Key data: 2,523 days of combined OI + FR history (March 2019 - February 2026). OI grew from $0.44B to an ATH of $47.58B. The market spent 43.3% of days in the bullish quadrant (OI up, FR positive) and 9.0% in the capitulation quadrant (OI down, FR negative).
Table of Contents
- What Is Open Interest and Why Does It Matter?
- The 4-Quadrant Framework
- How to Read Each Quadrant
- OI Reset Events - The Most Tradeable Pattern
- Historical Cycle Examples with Real Data
- Practical Playbook
- Common Pitfalls
- FAQ
- Related Guides
What Is Open Interest and Why Does It Matter?
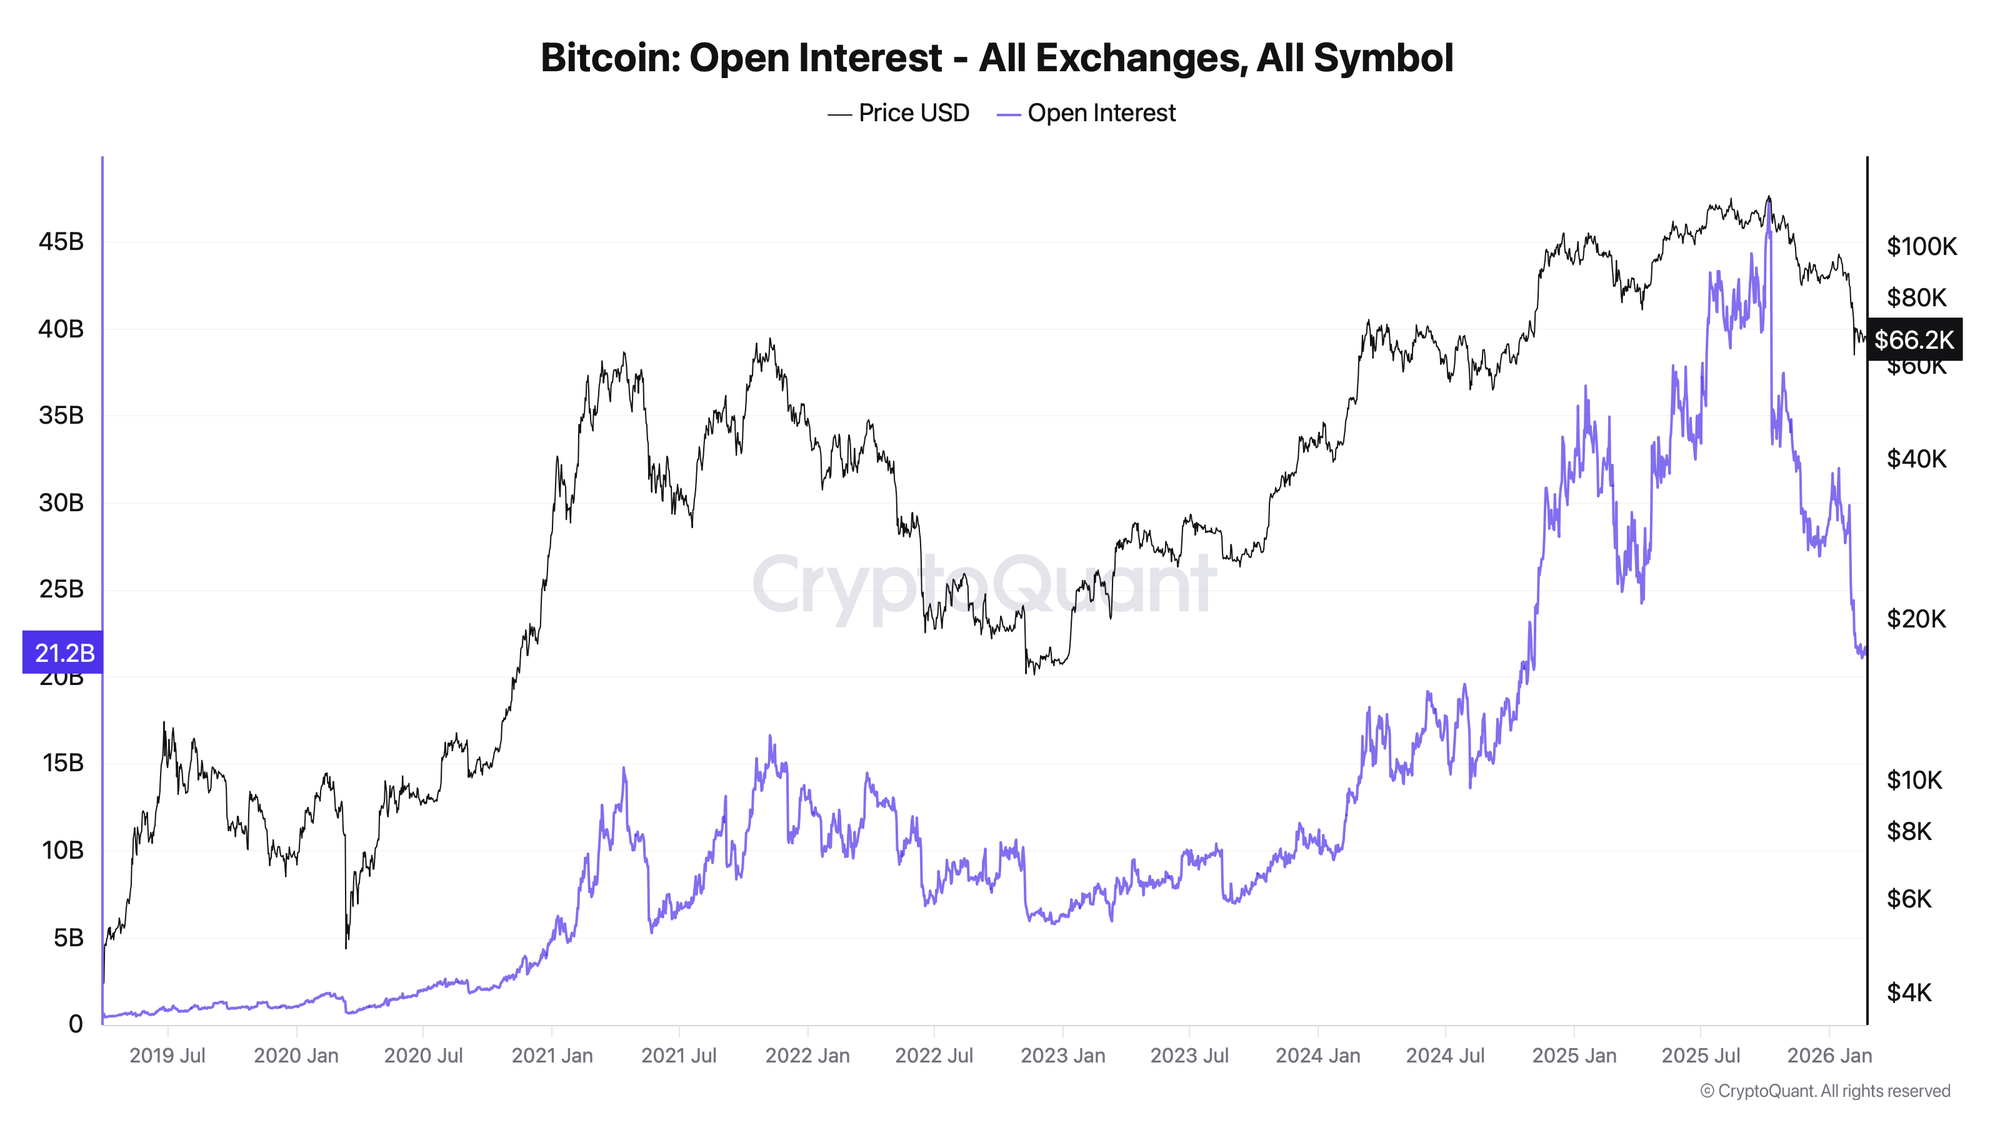
Open Interest is the total notional value of all futures and perpetual swap contracts that have been opened and not yet closed, across all exchanges. It rises when new positions are created (new money entering the market) and falls when positions are closed or liquidated (money leaving the market).
Critical distinction: OI is not volume. Volume counts every trade, including trades that open and close within the same day. OI counts only contracts that remain open at end of day. A day with $10B in trading volume might add only $200M to OI if most of that volume was position closing.
What OI actually measures: The amount of financial leverage currently committed to BTC derivatives. High OI means the market has more outstanding bets on price direction. This creates two effects:
First, it amplifies moves in the direction of the crowded trade. If OI is high and predominantly long, a price decline triggers margin calls and forced selling, which pushes price lower, which triggers more margin calls - a liquidation cascade.
Second, high OI means more latent selling pressure when the market eventually deleverages. Every open long position must eventually be closed - either by choice or by forced liquidation.
OI scale has changed permanently across cycles:
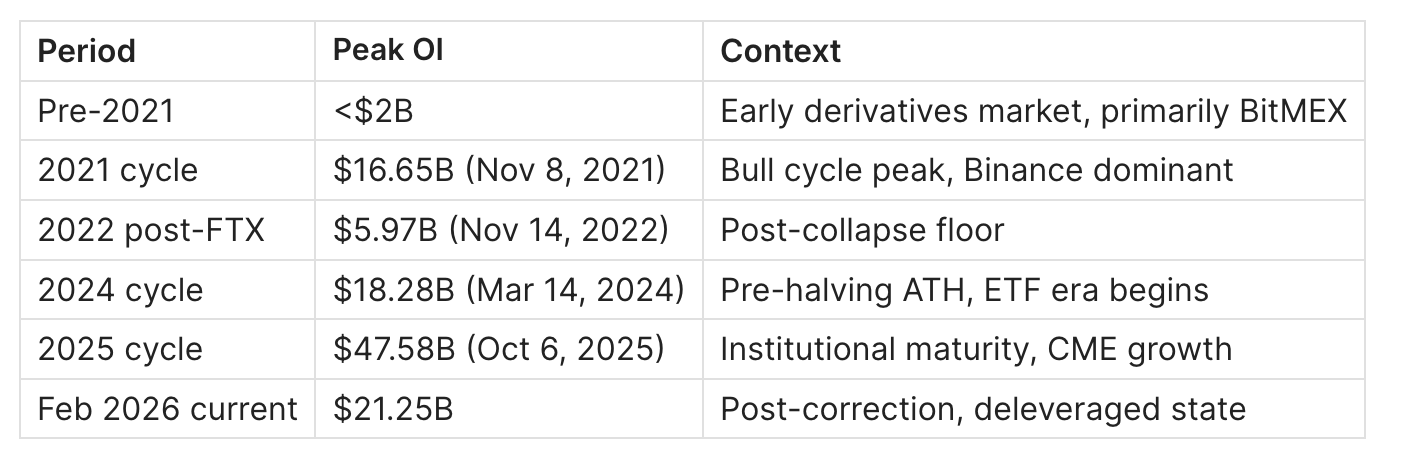
The permanent scale expansion matters for interpretation: comparing $21B OI in 2026 to $16B OI in 2021 requires cycle-relative context, not absolute comparison.
Key Concepts Before We Continue
Mark Price - the reference price used to calculate unrealized PnL and trigger liquidations. It is not the last traded price but a weighted average of spot prices across major exchanges. Liquidations happen when Mark Price hits your liquidation level, which is why "wick liquidations" on low-liquidity candles are real.
Open Interest in USD vs BTC - always use USD-denominated OI for cross-cycle comparison. BTC-denominated OI inflates when price falls and deflates when price rises, making it misleading as a standalone signal.
Aggregated vs single-exchange OI - single-exchange OI misses the full picture. Binance dominates perpetual OI, but CME holds the majority of institutional interest and futures OI. All data in this guide uses aggregated all-exchange figures from CryptoQuant.
The 4-Quadrant Framework
The core of this guide is a simple 2x2 matrix defined by the direction of OI change and the sign of Funding Rate. Every day in the market falls into one of these four quadrants.
Historical distribution across 2,522 days (March 2019 - February 2026):
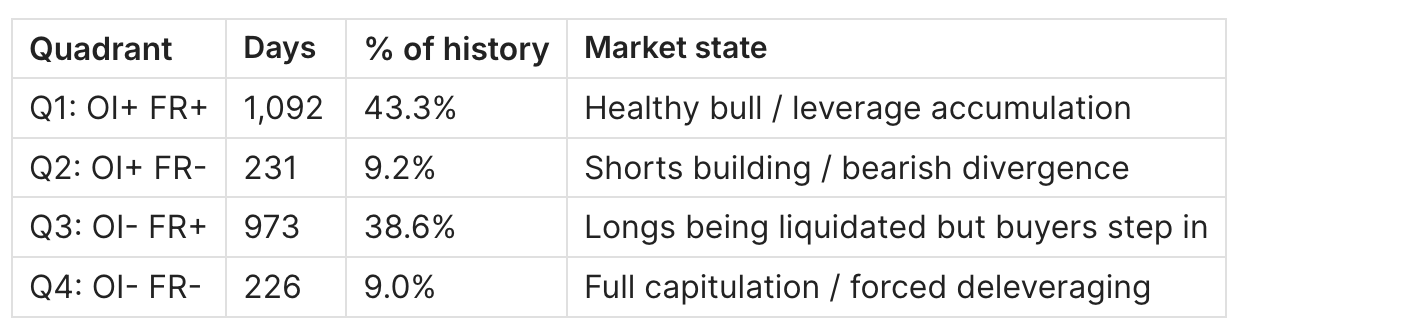
The asymmetry is important: Q1 (bullish expansion) is the dominant market state - Bitcoin trends bullish more than it trends bearish. Q4 (capitulation) is rare at 9% but is the highest-signal state for contrarian positioning.
How to Read Each Quadrant
Quadrant 1 - OI Rising + FR Positive: "Leverage Accumulation"
What it means: New money is entering the market on the long side. Longs are paying shorts for the privilege of being positioned up. This is the most common state and generally confirms a bullish trend.
The internal spectrum of Q1: Not all Q1 days are equal. There is a critical difference between:
- Mild Q1: OI growing +0.5 to +2%/day, FR +0.1 to +1.0%/day - healthy, sustainable, no alarm
- Hot Q1: OI growing +3 to +5%/day, FR +1.0 to +3.0%/day - approaching dangerous territory
- Extreme Q1: OI growing +5%+ in a day, FR >+3.0%/day - historically precedes sharp corrections within 1-5 days
Real example - March 2024 ATH: On March 11, 2024, OI surged from $15.73B to $17.95B (+14.1% in a single day) while FR hit +8.224%/day - the highest combined reading of the ETF era. The $73,777 ATH followed on March 14. OI peaked at $18.28B on ATH day. Within 72 hours, OI had collapsed back to $16.59B as leveraged longs were liquidated on the pullback.
Actionable signal: When OI grows by more than 10% in a single day AND FR exceeds +3.0%/day, the probability of a mean-reversion correction within the next 5 trading days is historically elevated. This is not a short signal - it is a signal to stop adding leveraged longs and begin monitoring for the turn.
Quadrant 2 - OI Rising + FR Negative: "Bearish Buildup"
What it means: New contracts are being opened but on the short side. Shorts are paying longs. This pattern indicates that bearish conviction is building - new participants are entering explicitly to bet on price decline.
This is the rarest quadrant and the most important contrarian signal. At 9.2% of historical days, it is less common than full capitulation. When it appears after a prolonged decline, it often marks the peak of bearish conviction before a short squeeze.
Why it is dangerous to trade with the crowd in Q2: Short positions accumulate, funding goes negative, and the market appears to confirm the bearish thesis. But every short opened is a future forced buy. The more Q2 days accumulate, the larger the short squeeze fuel tank.
Real example - May 19, 2021 crash: OI collapsed from $9.12B to $6.02B (-34%) on a single day while FR hit -5.194%/day. The combination of OI implosion and extreme negative FR marked the short-term bottom at $30,000. Recovery of 60%+ followed over the next two months.
Actionable signal: OI increasing while FR is deeply negative (< -0.5%/day) for 2+ consecutive days = short squeeze setup. The resolution is typically sharp and rapid. Wait for FR to begin recovering toward neutral before entering.
Quadrant 3 - OI Falling + FR Positive: "Squeeze and Recovery"
What it means: Positions are being closed or liquidated - typically forced long liquidations on a price pullback - but funding remains positive, suggesting that the underlying long bias persists. New longs are entering to absorb the selling.
This is the dominant pattern during healthy corrections in bull markets. OI falls as weak hands are liquidated, FR stays positive as strong hands accumulate. The market "flushes" excess leverage without fundamentally changing direction.
Real example - August 2024 yen carry unwind: OI dropped from $17.35B (Aug 3) to $13.62B (Aug 5), a single-week decline of -21.4%. FR briefly went negative (-1.31%/day on Aug 6). By August 7, FR was back to +0.911%/day and OI began recovering. The pattern: Q3 entry (OI falling, FR still positive) transitioning briefly to Q4 (OI falling, FR negative) then immediately back to Q3 - a V-shape recovery. Bitcoin had bottomed at $49,000.
Actionable signal: Q3 - OI declining but FR still positive - is generally a buying opportunity in a bull market context. The risk is that Q3 transitions into Q4 if the selling accelerates. Monitor whether FR crosses into negative territory as a stop signal.
Quadrant 4 - OI Falling + FR Negative: "Capitulation"
What it means: Positions are being closed or liquidated AND the remaining open positions are net short. This is the full deleveraging state - bulls have been washed out, shorts dominate, and the market is in maximum fear.
At 9.0% of historical days, Q4 is the highest-signal contrarian state. Every major Bitcoin cycle bottom in the data has been associated with a Q4 event. The question is never "will Q4 signal a bottom" but "how deep and long does Q4 last before the reversal."
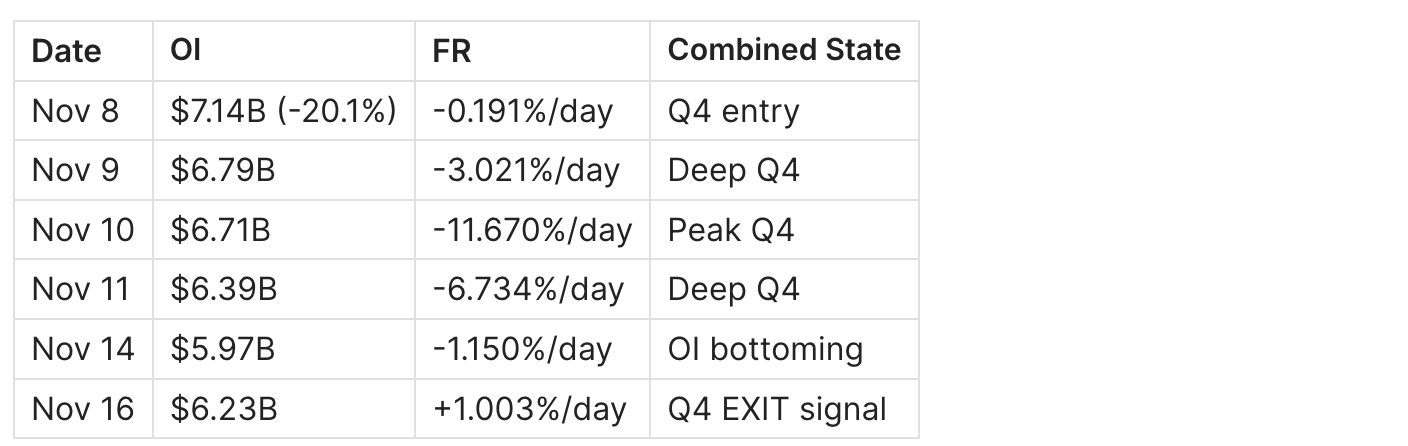
Real example - FTX collapse, November 2022:
- Nov 8: OI dropped -20.1% from $8.94B to $7.14B. FR turned negative (-0.191%/day). Entry into Q4.
- Nov 10: OI at $6.71B, FR at -11.67%/day. Peak fear. Bitcoin at $15,500.
- Nov 14: OI continued falling to $5.97B (historical low for 2022). FR at -1.15%/day.
- Nov 16: First day FR turned positive (+1.003%/day). OI began stabilizing at ~$6.2B.
The OI bottom ($5.97B) preceded the FR normalization by 2 days. This is the pattern: OI stabilizes first as the last forced sellers exhaust themselves, then FR normalizes as sentiment recovers.
Real example - COVID crash, March 2020:
- March 12: OI collapsed -44.9% in a single day, from $1.34B to $0.74B. FR: -10.845%/day.
- March 13: OI at $0.73B, FR: -25.70%/day (historical maximum negative reading).
- March 15-20: OI slowly stabilizes between $0.66B-$0.73B.
- Recovery began from $3,850.
Actionable signal: The Q4 exit signal is FR returning to neutral or positive while OI stabilizes (stops declining). This combination signals that forced selling has exhausted itself. Historical lag between Q4 entry and Q4 exit: 1-7 days for external shocks (FTX, COVID), longer for organic bear markets.
OI Reset Events - The Most Tradeable Pattern
An OI reset is a single-day OI decline exceeding 10%. These events are relatively rare (41 occurrences across 2,522 days = 1.6% frequency) but are among the most signal-rich moments in Bitcoin derivatives history.
Complete list of major OI resets (>10% single-day decline):
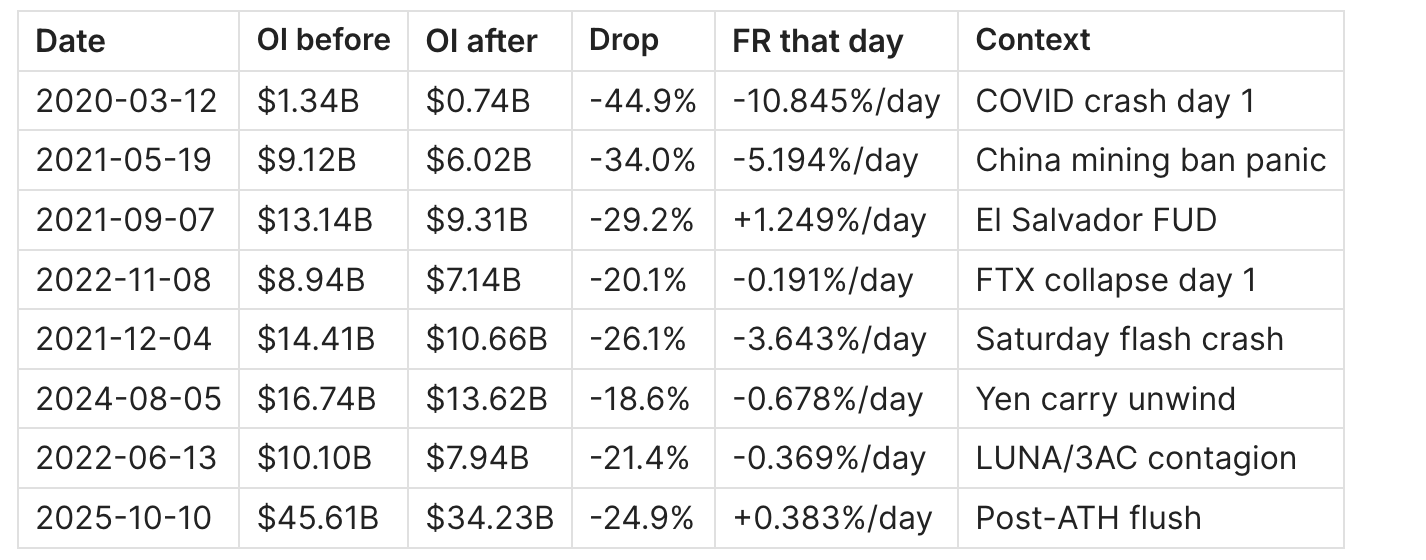
Key observation: The September 7, 2021 event is particularly instructive. OI dropped -29.2% (second largest reset up to that point) but FR remained POSITIVE at +1.249%/day. This Q3 event - massive OI reset without negative FR - was followed by continued bull market. El Salvador's Bitcoin legal tender announcement triggered profit-taking and stop-runs, but underlying demand remained intact. Bitcoin went on to make a new ATH at $69,000 two months later.
Contrast this with the December 4, 2021 reset: OI dropped -26.1% AND FR went deeply negative (-3.643%/day) - a Q4 event. This was not followed by a quick recovery - it marked the beginning of the 2022 bear market.
The diagnostic question after every major OI reset: Does FR stay positive (Q3 - flush in bull market) or go negative (Q4 - direction change)? This single question separates healthy corrections from structural tops.
Historical Cycle Examples with Real Data
Case Study 1: The November 2021 ATH ($69K) - Classic Q1 Blowoff
Phase 1 - Leverage accumulation (Nov 1-7): OI grew steadily from $14.20B to $15.19B. FR held in the Overheated zone (+1.36 to +2.69%/day). This was sustained Q1 - not yet extreme but clearly elevated. On-chain: NUPL above 0.7, SOPR above 1.05.
Phase 2 - Extreme Q1 (Nov 8-10):
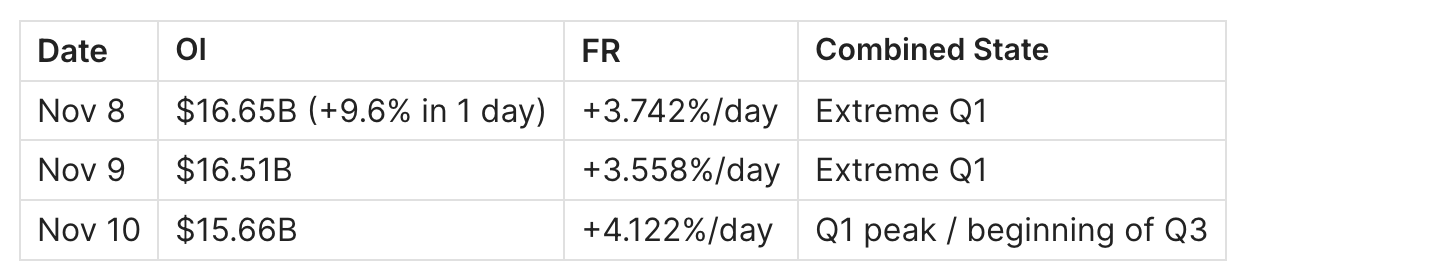
ATH: $69,000 on November 10. OI peaked on November 8 - 2 days BEFORE the price ATH. This is the typical pattern: OI peaks before price as late-arriving leveraged longs get immediately liquidated, pulling OI down while price grinds slightly higher on spot buying.
Phase 3 - Transition (Nov 11 onward): FR dropped sharply to +1.143%/day. OI stabilized but remained elevated. Over the next 60 days, price fell -55% as the leverage overhang slowly resolved.
Key lesson: OI peaked before price. FR peaked before OI. The sequence is FR peak - OI peak - price peak. Monitoring this sequence in real-time gives early warning of 1-3 days.
Case Study 2: The FTX Collapse (November 2022) - Q4 Capitulation Anatomy
Pre-event (Nov 1-7): OI at $8.94-10.22B, FR positive (+0.06 to +0.87%/day). Normal bull market conditions. No derivatives warning before the news broke.
Q4 onset (Nov 8-14):
The OI floor ($5.97B) came before FR normalization. FR returned to positive on Nov 16 - the confirmed exit from Q4. Total duration of Q4 event: 8 days. Bitcoin price went from $20,000 to $15,500 during Q4, then began a slow recovery.
Key lesson: OI floors before FR normalizes. The first day FR returns to positive after a Q4 event is the highest-confidence bottom confirmation signal in the combined framework.
Case Study 3: March 2024 ATH ($73K) - ETF-Era Extreme Q1
This case shows how the ETF era amplified the Q1 dynamic while not changing its fundamental logic.
OI context: In November 2021, OI peaked at $16.65B (representing a large % of Bitcoin's then-$1.3T market cap). In March 2024, OI peaked at $18.28B (smaller % of BTC's $1.4T market cap). But FR peaked HIGHER: +8.224%/day on March 11 vs +4.122%/day in November 2021.
The interpretation: ETF spot buying was pushing price, but retail and leveraged players had piled into perpetuals on top of the ETF-driven base. The derivatives market was MORE leveraged relative to OI than in 2021, because ETF flows were inflating price without appearing in OI.
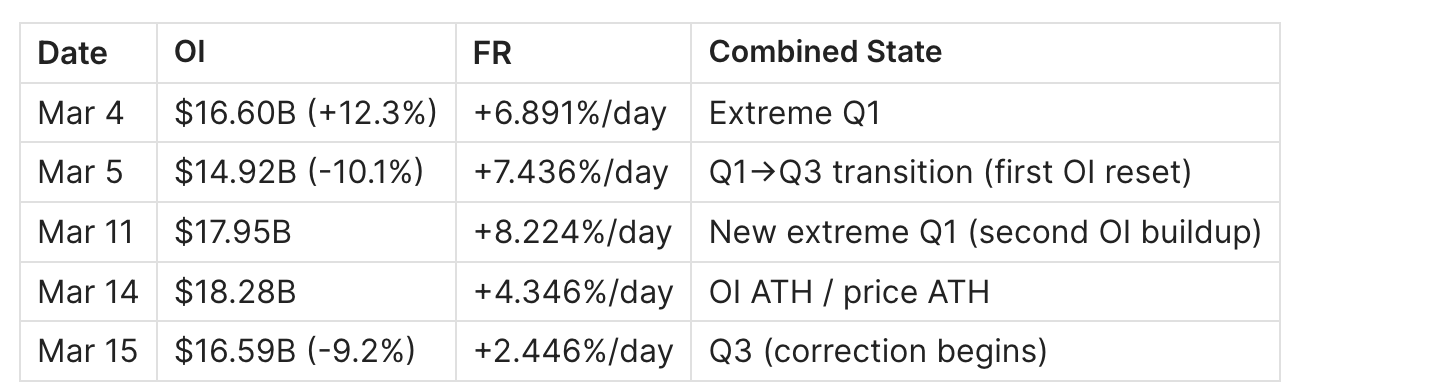
March 5 produced an OI reset (-10.1%) while FR stayed extremely positive (+7.436%/day) - a Q3 signal within an extreme Q1 environment. This was a brief flush before the final push to ATH. The second OI buildup (Mar 8-14) at similarly extreme FR levels confirmed the final top.
Key lesson: During strong bull markets, Q3 events (OI reset with positive FR) can be continuation signals, not reversal signals. The distinction lies in whether FR stays positive through the OI reset.
Case Study 4: January 2025 - $109K ATH with Structural OI Shift
By January 2025, OI had expanded to a previously unthinkable scale: $36.75B (Jan 17, 2025), nearly double the previous cycle peak. Yet FR during this period was markedly lower than in prior ATH events.
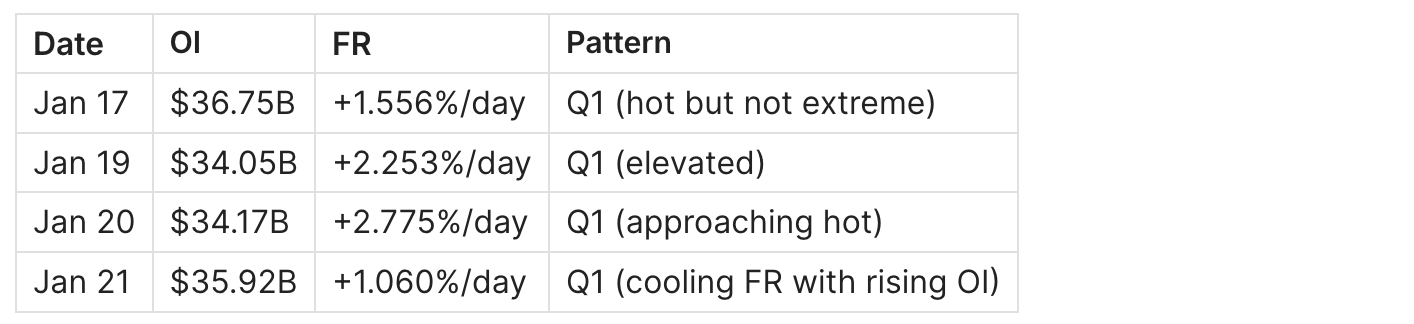
The $109,000 ATH was reached around January 20, 2025. FR peaked at +2.775%/day - significantly lower than the +4.12%/day at the 2021 ATH or +8.22%/day at the 2024 ATH. OI was 2x larger but FR was 1.5-3x lower. This reflects the institutional maturation of the derivatives market and growing ETF spot influence.
Key lesson: In the 2025+ era, the OI absolute level is less meaningful as a standalone signal - the market has structurally more OI due to CME growth and institutional participation. FR-to-OI ratio (how much leverage cost is being paid per dollar of OI) is a more relevant metric than absolute OI. The 2025 ATH showed lower FR per dollar of OI than any previous cycle top.
Case Study 5: February 2026 - Current Deleveraging
The current market state (as of February 23, 2026) provides a live example of a Q4 transition resolving.
January 2026 context: OI ranged $28-32B with FR firmly positive (+0.4 to +0.9%/day). Standard Q1 market state.
Deleveraging event (Feb 1-17):
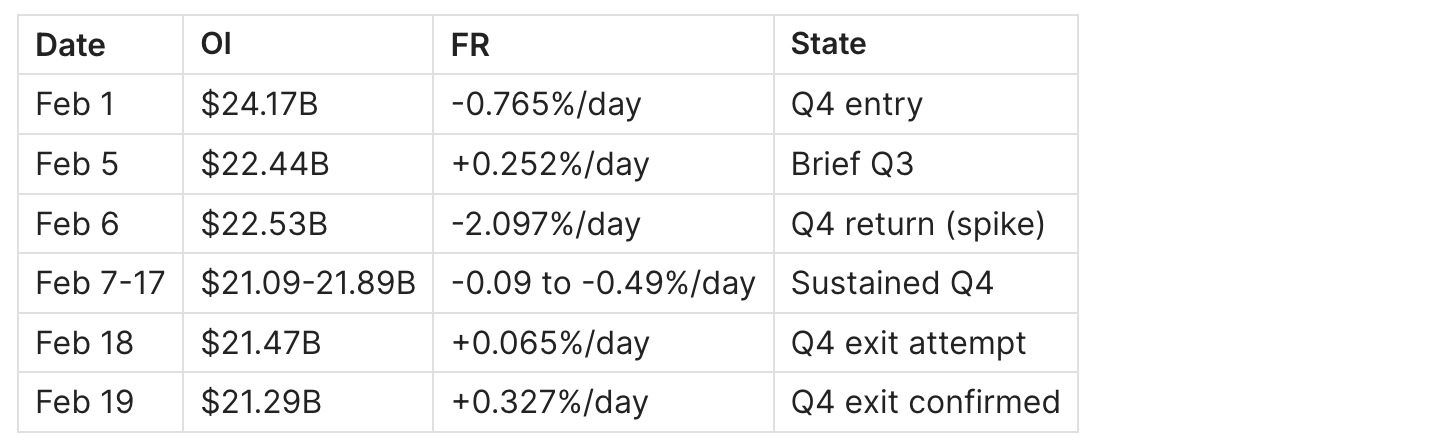
OI fell from $32B peak (early January) to $21.09B (Feb 16) - a -34% reduction. FR normalized from -0.5%/day to positive by February 18-19. The Q4 pattern: OI stabilized, then FR normalized. Classic bottom anatomy.
The February 6 spike to -2.097%/day was the peak fear event. February 19's return to +0.327%/day with stable OI ($21.29B) was the first confirmed Q4 exit signal.
Practical Playbook
Setup 1: Spotting Tops - Extreme Q1 Filter
Setup: OI growing >5% in a single day AND FR >+3.0%/day (sustained 2+ days).
Trigger: OI begins declining on 2nd consecutive day (first day of Q3 after extreme Q1).
Confirm: FR drops below +1.0%/day within 48-72 hours of OI peak.
Invalidates when: OI immediately rebounds to new highs with FR staying elevated (strong trend continuation - March 2024 Mar 5-11 example).
Action: Begin reducing leveraged long exposure. Size reduction 20-30% per day of FR >+3.0%/day sustained. No new leveraged longs until FR drops below +1.0%/day and OI stabilizes.
Time horizon: 3-10 days for correction to materialize after Extreme Q1 peak.
Setup 2: Spotting Bottoms - Q4 Exit Signal
Setup: OI has dropped >15% from local peak AND FR has gone negative (Q4 confirmed).
Trigger: FR returns to neutral (> -0.1%/day) after being in negative territory for 2+ days.
Confirm: OI stops declining (2 consecutive days where OI change is <-2%).
Invalidates when: FR turns negative again within 48 hours of the first positive reading (false exit - rare but occurred during FTX aftershocks Nov 22 and Dec 2, 2022).
Action: Begin accumulating spot / scaling into leveraged longs at 50% of standard size at Q4 exit. Add remaining 50% once FR is confirmed positive for 3 consecutive days and OI begins growing.
Time horizon: Recovery typically begins 1-5 days after Q4 exit confirmation.
Setup 3: Healthy Correction Filter - Q3 vs Q4 Distinction
The most important real-time question during any selloff: Is this Q3 (healthy flush) or Q4 (direction change)?
Q3 indicators (healthy correction, buy the dip):
- OI falling but FR stays positive throughout
- OI decline <20% from local peak
- FR floor stays above -0.1%/day even at maximum fear
- Recovery in FR within 24-48 hours
Q4 indicators (structural top, do not buy yet):
- FR goes clearly negative (< -0.5%/day) during the OI decline
- OI decline exceeds 20% from local peak
- FR stays negative for 3+ days
- OI continues declining even as price stabilizes
Real-time example from August 2024: OI fell -18.6% on Aug 5. FR went to -0.678%/day - briefly Q4 but not deeply. FR was positive again in 48 hours. Q3/Q4 borderline case - resolved as Q3. Correct action: wait for FR to confirm positive (Aug 7), then buy.
Common Pitfalls
1. Treating OI absolute level as a bearish signal High OI alone is not bearish. OI at $47.58B (Oct 2025 ATH) was not immediately bearish - the market spent weeks at elevated OI with moderate FR. The problem is not high OI but high OI + high FR + OI surging at an accelerating rate. All three conditions must be present.
2. Calling bottoms too early in Q4 The first day of negative FR is not the bottom. FTX Q4 lasted 8 days. COVID Q4 lasted multiple days. The correct trigger is FR normalization (first positive day) AND OI stabilization - not the entry into Q4.
3. Missing the OI scale context Comparing 2026 OI levels to 2021 OI levels in absolute dollars is misleading. OI has grown structurally due to CME institutional participation, ETF-related hedging flows, and overall market growth. A $25B OI in 2026 is not the same "danger level" as $16B OI in 2021. Use OI relative to its recent range, not its absolute level.
4. Ignoring the CME vs perp OI split CME open interest (institutional, cash-settled, no funding rate) has grown significantly since 2024. CME OI does not generate funding payments. When CME's share of total OI is large, aggregate FR may understate the actual directional conviction in the market, because CME participants are not paying funding.
5. Using daily OI data for intraday decisions The OI data in this guide is daily. Intraday OI can spike by 5-10% during US market hours and then reset. Major liquidation events happen within hours, not days. For real-time trading, use CoinGlass or Coinalyze for hourly OI with funding updates.
6. Ignoring the Q4 false exit Occasionally, FR returns to neutral briefly and then goes negative again. This occurred during the FTX aftermath (Nov 22, Dec 2, 2022). The confirmation filter - FR positive for 3 consecutive days with stabilizing OI - reduces false exits but does not eliminate them.
FAQ
What is a "healthy" level of Open Interest for Bitcoin? There is no absolute "healthy" level - it depends on the cycle phase and market capitalization. A useful framework: OI/Market Cap ratio. In 2021 ATH conditions, OI was approximately 1.2% of BTC market cap. In 2025, with institutional CME participation, higher absolute OI reflects structural market growth, not necessarily overheating. Monitor OI relative to its 30-day average: more than 20% above the 30-day average signals elevated leverage regardless of absolute level.
Which comes first - OI peak or price peak? In leveraged bull markets, OI tends to peak 1-3 days before price. The sequence observed in November 2021: OI peaked Nov 8 ($16.65B), price peaked Nov 10 ($69,000). In March 2024: OI peaked Mar 14 ($18.28B) on the same day as price ATH. The timing varies, but OI rarely peaks significantly after price - when OI peaks coincides with or precedes price peak, this is the normal pattern.
Can OI grow without FR rising? Yes, and this is a key signal. When OI grows significantly while FR stays flat or declines, it means new positions are being opened on both sides roughly equally (or new short positions are being opened). This is the Q2 pattern (OI up, FR down) - a bearish divergence. The March 13, 2023 event showed OI growing +15.6% while FR hit -1.70%/day - a short buildup that preceded a short squeeze recovery.
How long does Q4 typically last? External shock events (FTX, COVID, exchange hacks): Q4 lasts 1-10 days. Organic bear market tops: Q4 can persist for weeks or months. The difference is the origin of the selling. Forced liquidation from a specific event exhausts itself quickly. Organic bear markets involve sustained net selling without a single triggering event.
What does it mean when OI keeps rising but price does not? This is one of the most important divergence patterns. Rising OI without rising price means new positions are being added but buyers and sellers are canceling each other out - the market is in a state of contested direction. This often precedes a sharp resolution in one direction as one side capitulates. The direction is determined by which side has weaker participants (lower average liquidation distance).
Where to find combined OI + FR data? CoinGlass (coinglass.com) - best for real-time charted view of both metrics. CryptoQuant - best for SQL queries, historical data, and custom analysis. Coinalyze - best for multi-exchange OI breakdown alongside funding. For the aggregated daily data used in this guide: CryptoQuant "All Exchanges All Symbol" datasets for both metrics.
Does OI data work differently for CME vs perpetual exchanges? Yes - CME futures have no funding mechanism. CME OI represents positions held by institutional participants who are not subject to 8-hour funding payments. High CME OI can coexist with low perpetual FR because institutional longs on CME are hedged on spot, not directionally speculative. When analyzing the combined framework, be aware that the fraction of total OI represented by CME-style futures vs perpetuals affects the FR signal.
Is the 4-quadrant framework applicable to altcoins? With reduced reliability. The framework works best for BTC because Bitcoin has the deepest and most liquid derivatives market, with the cleanest OI data across multiple exchanges. Altcoin perpetuals have thinner OI, higher funding volatility, and more susceptibility to manipulation. The quadrant logic applies, but the signal-to-noise ratio is lower and false signals are more frequent.
Related Guides
- Bitcoin Funding Rates: Definition, Formula & Cycle Signals - the pillar guide to funding rate mechanics, zones, and historical cycle data
- Bitcoin Liquidation Cascade: How It Works, Why It Happens & How to Predict It - the downstream consequence of extreme Q1 and Q4 events
- Funding Rate Strategies: Cash-and-Carry, Basis Trading & Arbitrage - how to monetize the structural FR premium identified in this framework
Read daily derivatives analysis for free: Adler AM - morning brief covering OI, FR, and on-chain signals every day.
Institutional-grade depth: Adler Premium - weekly deep analysis, SQL models, early signals before they become consensus.