
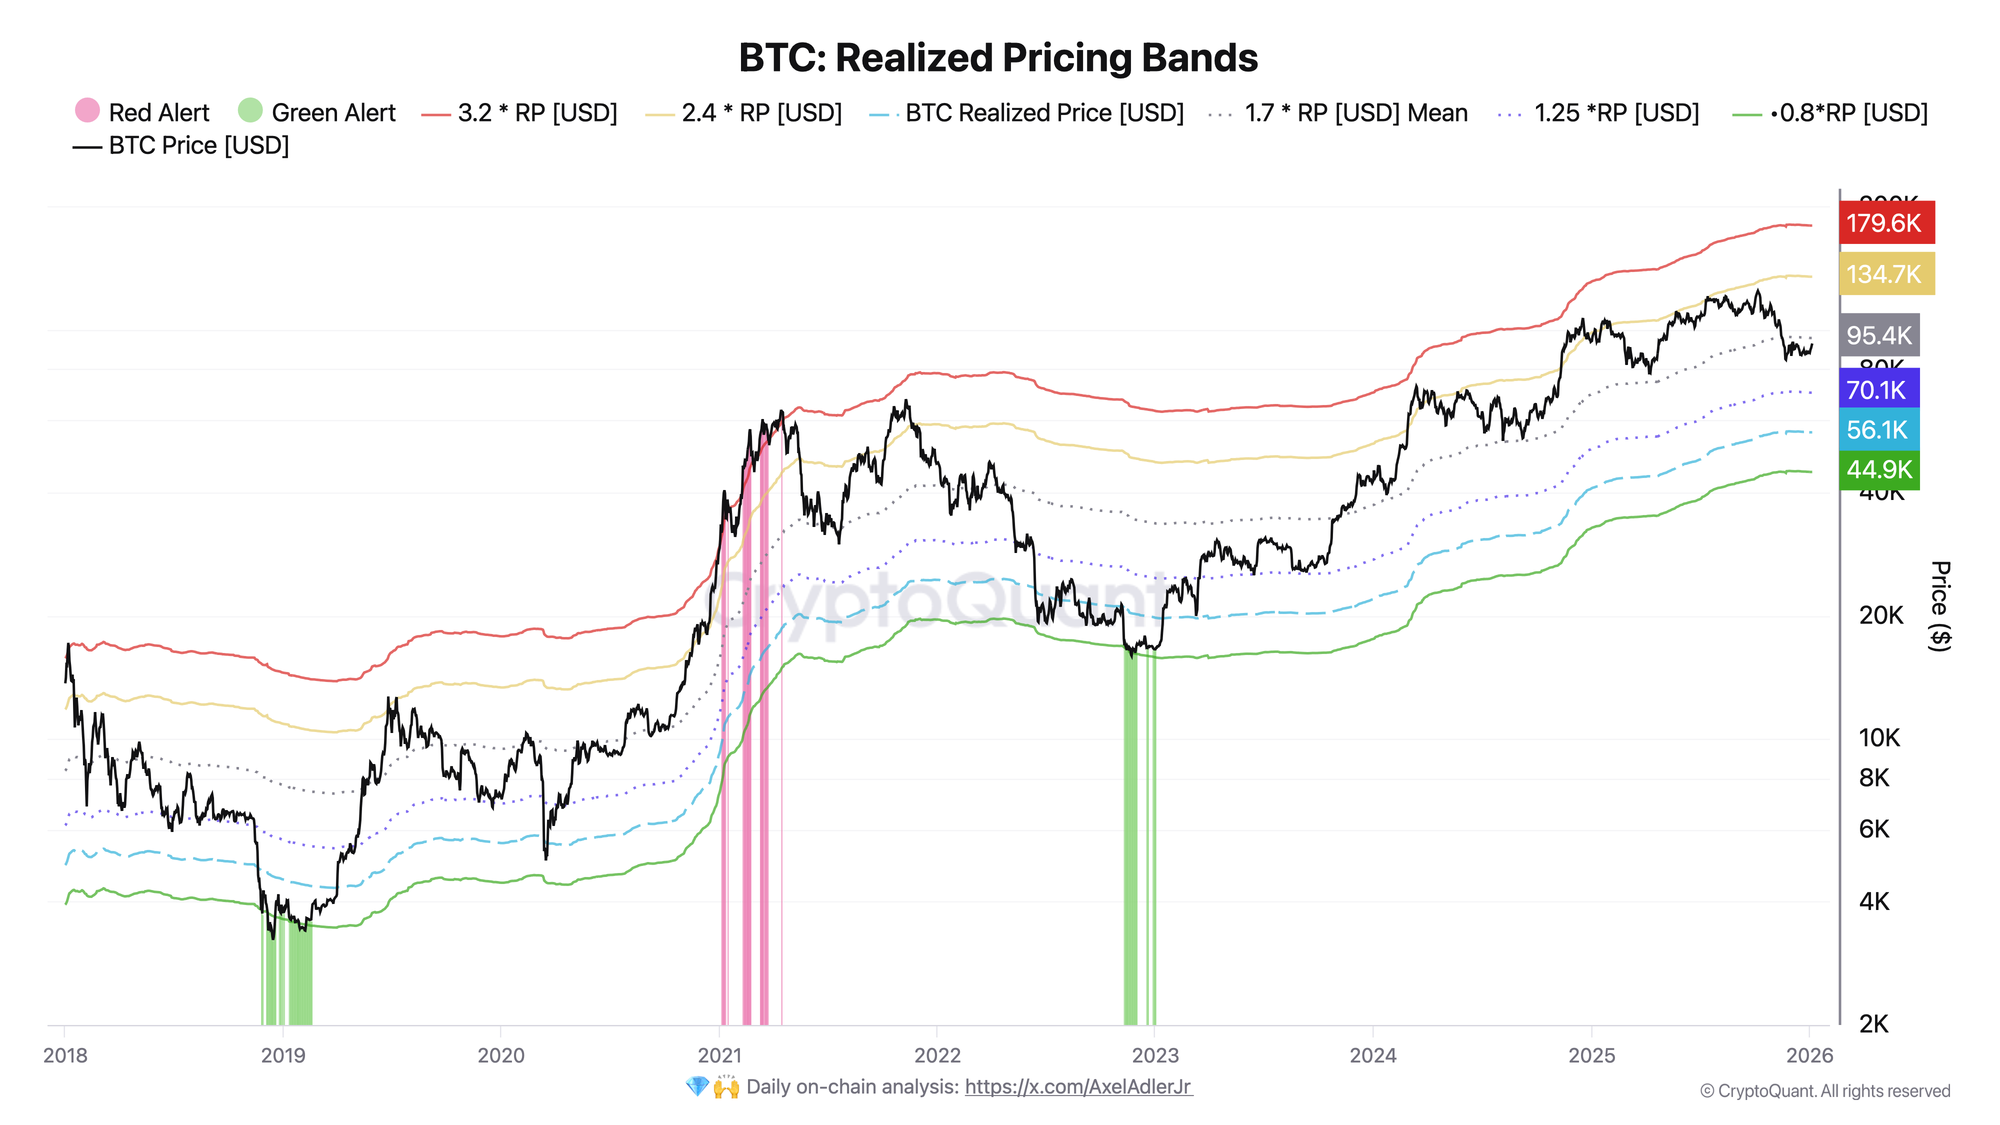
Bitcoin Realized Price Bands are one of the most widely used on-chain valuation tools for long-term Bitcoin cycle analysis. This framework helps identify periods of capitulation, accumulation, optimism, and market euphoria by comparing Bitcoin's market price to its realized cost basis.
Last updated: April 5, 2026
Current Realized Price Bands
| BTC Price | $68,997 |
| Realized Price | $54,139 (-0.6% 30d) |
| Price / Realized Price | 1.27× |
| Bands: 0.8× / 1.5× / 2.0× / 3.0× | $43,312 / $81,209 / $108,279 / $162,418 |
| Zone | 🟢 Accumulation zone (1.0–1.5×) — price 27% above aggregate cost basis |
Updated April 5, 2026 · Want daily realized price analysis? Join Adler AM
In this guide, we provide a complete realized price bands Bitcoin analysis, covering methodology, interpretation, historical cycle behavior, practical trading use cases, and key limitations. The goal is not short-term price prediction, but understanding where Bitcoin trades relative to its underlying on-chain cost structure.
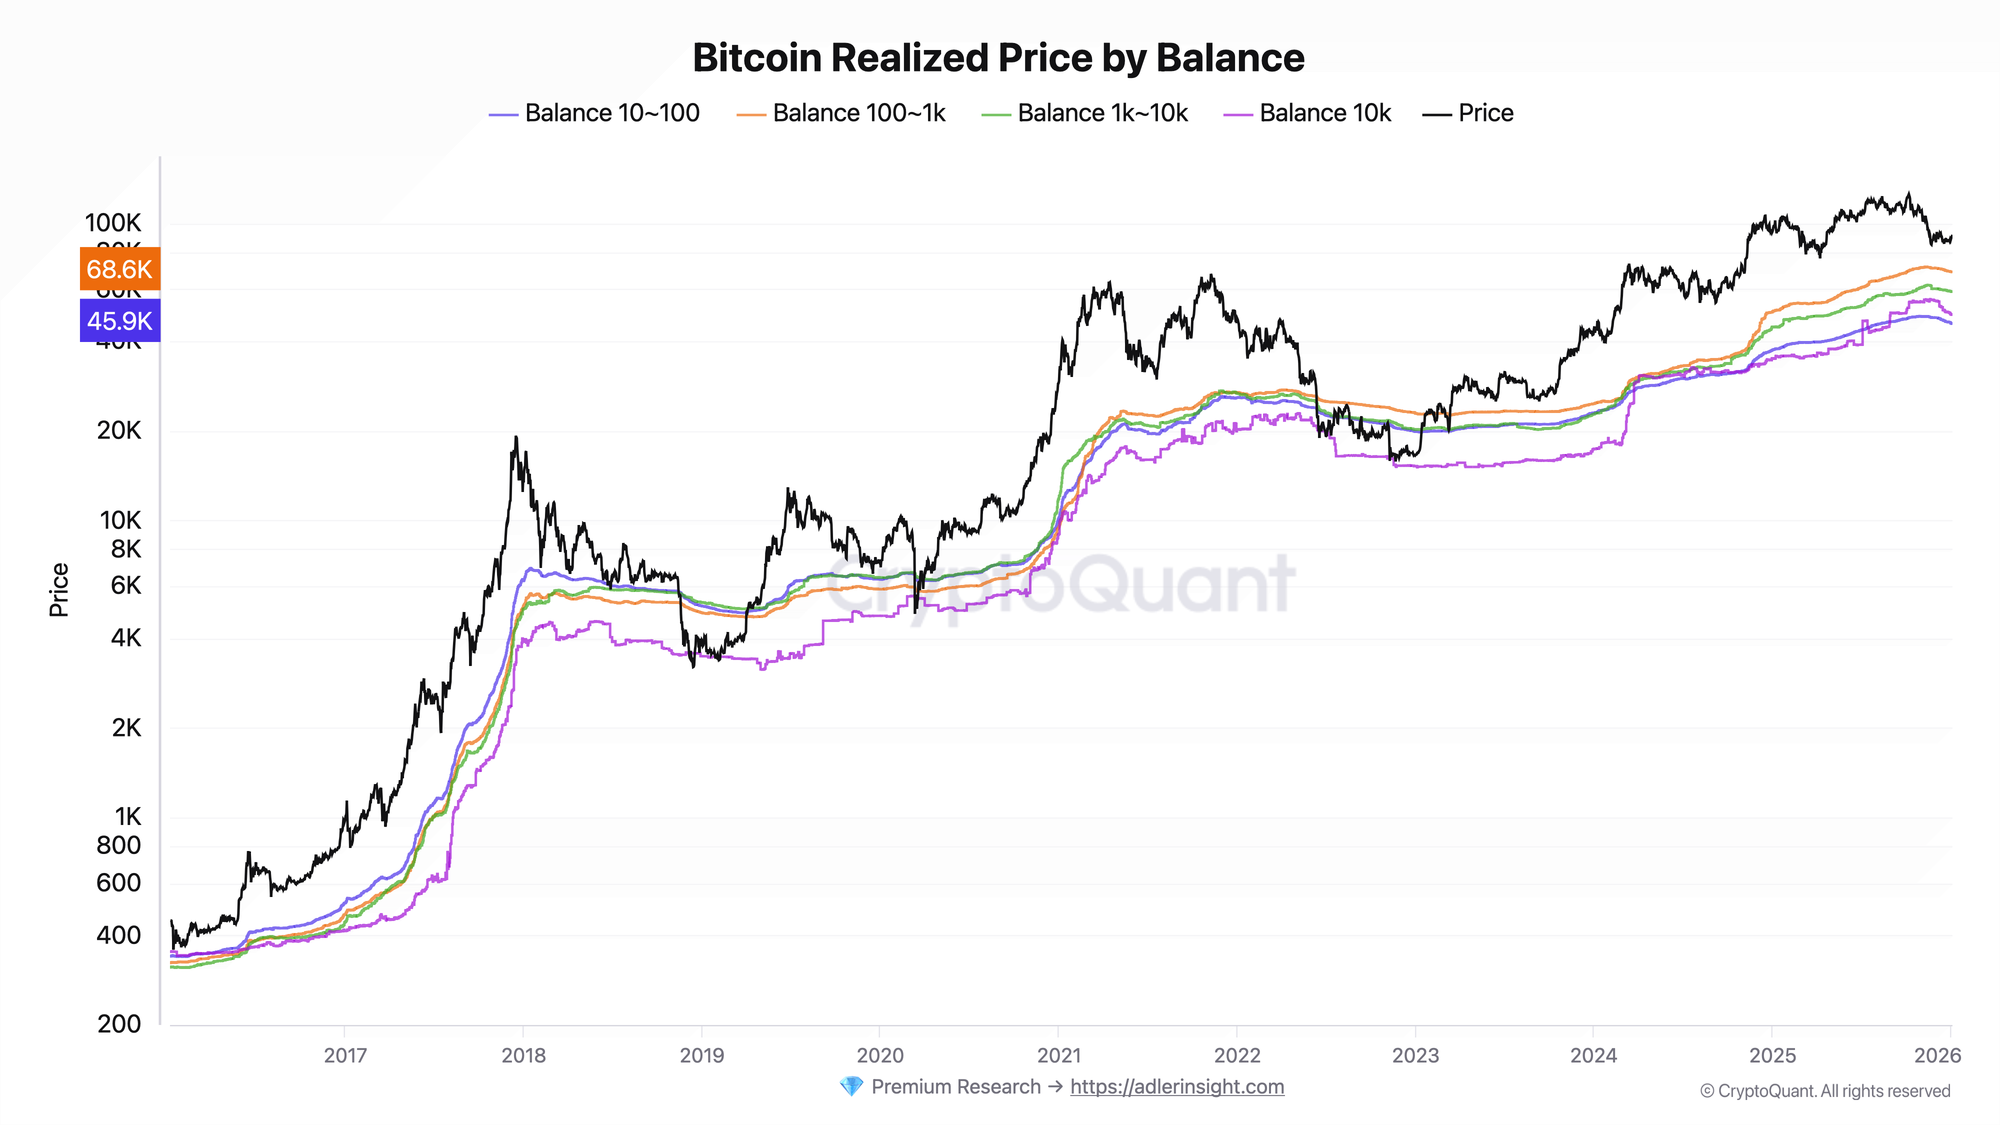
Unlike traditional technical indicators, realized price bands are grounded in on-chain fundamentals. They are derived from Realized Price, which represents the average price at which all circulating Bitcoin last moved on-chain. By applying historically relevant multipliers to this baseline, realized price bands form adaptive valuation zones that have remained consistent across multiple Bitcoin cycles.
What Is Realized Price?
Realized Price represents the average on-chain cost basis of the Bitcoin market. It is calculated by dividing Realized Capitalization by circulating supply.
Realized Price = Realized Cap / Circulating Supply
Where:
- Realized Cap — values each UTXO at the price when it last moved
- Circulating Supply — the total supply of Bitcoin in circulation
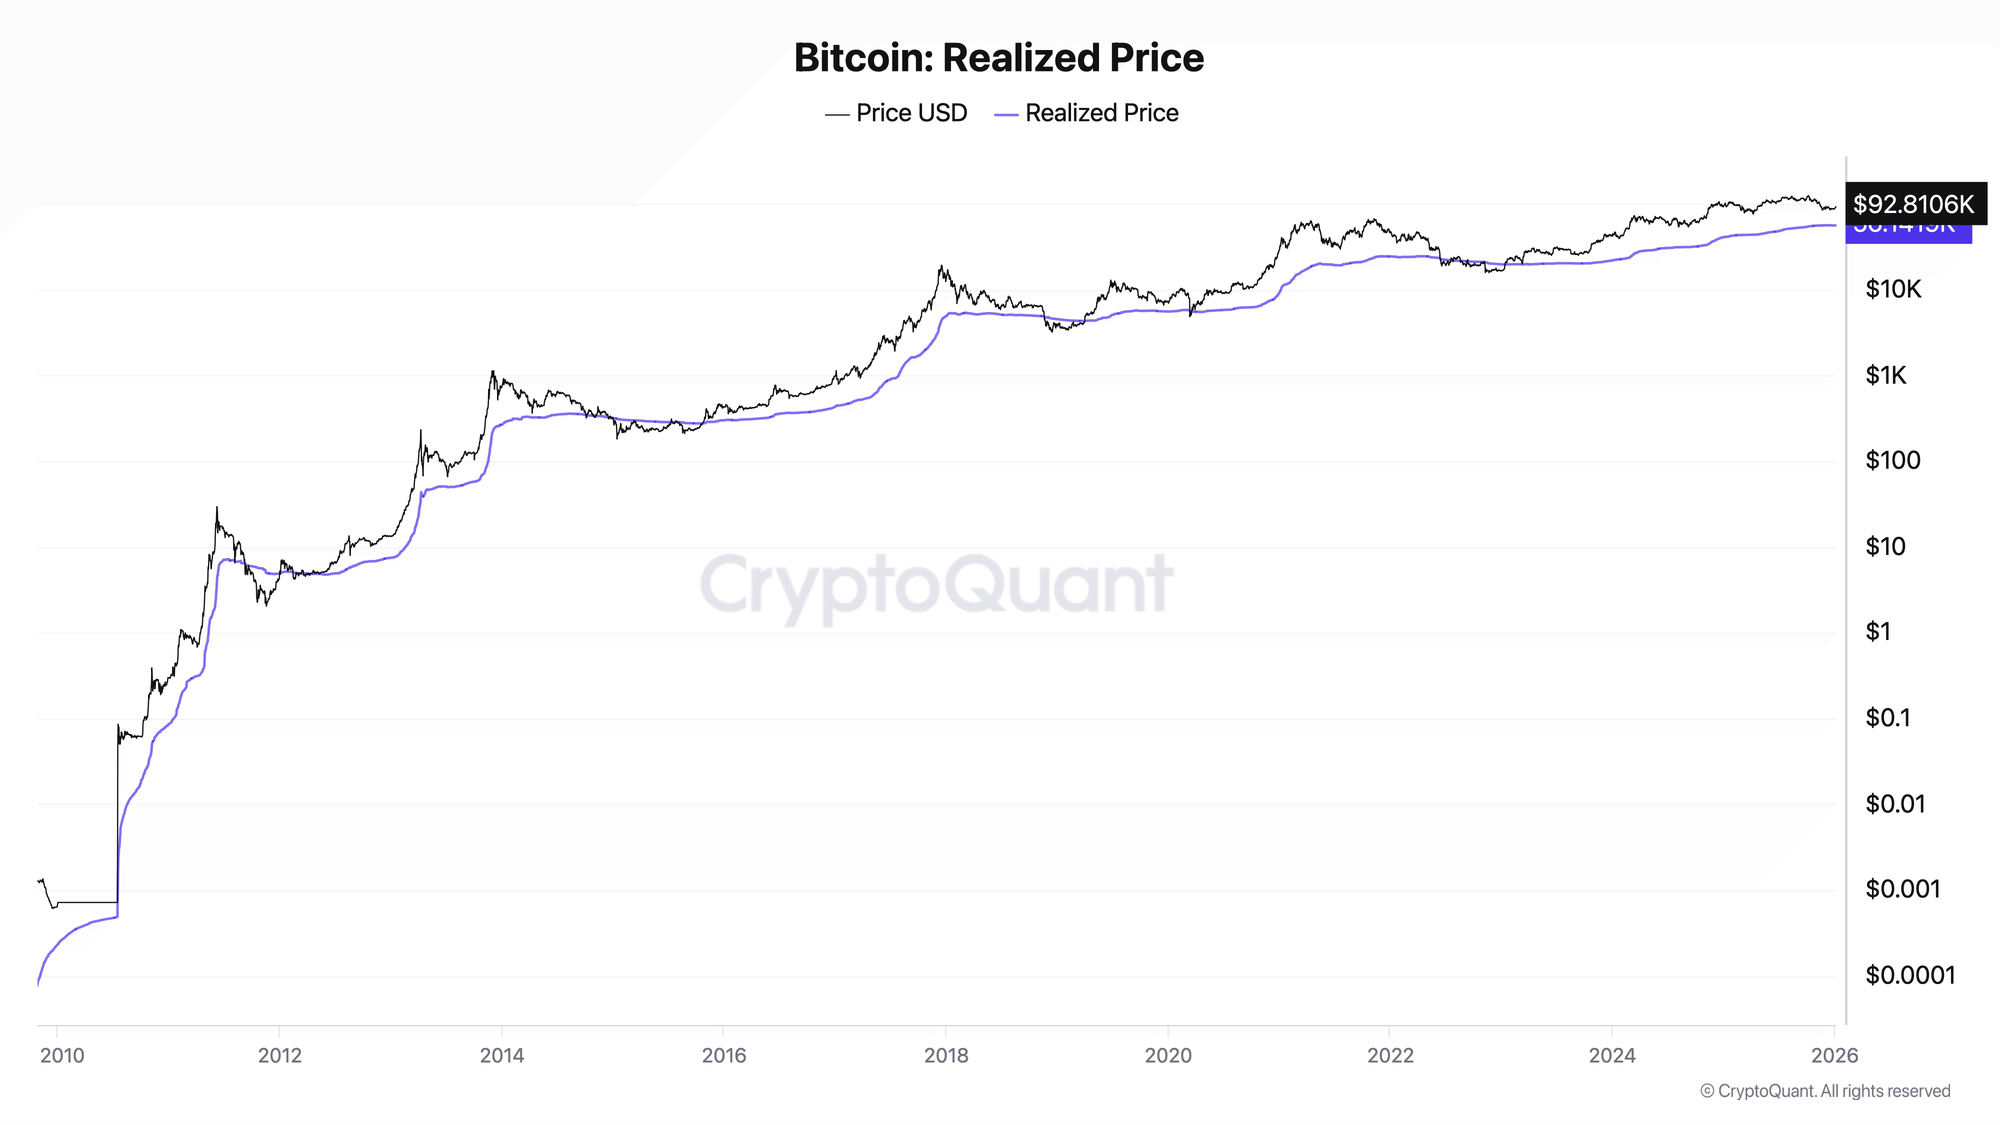
Unlike Market Price, which applies the current price to all coins, Realized Price reflects actual economic activity. It answers a simple but powerful question: at what average price did market participants last acquire their Bitcoin?
Historically, Realized Price has acted as a major macro-level support and resistance zone across Bitcoin cycles.
What Are Bitcoin Realized Price Bands?
Realized Price Bands are valuation zones derived by applying multipliers to Realized Price.
Band = Realized Price × Multiplier
These bands evolve dynamically with the market's cost basis and help identify structurally important zones of risk and opportunity.
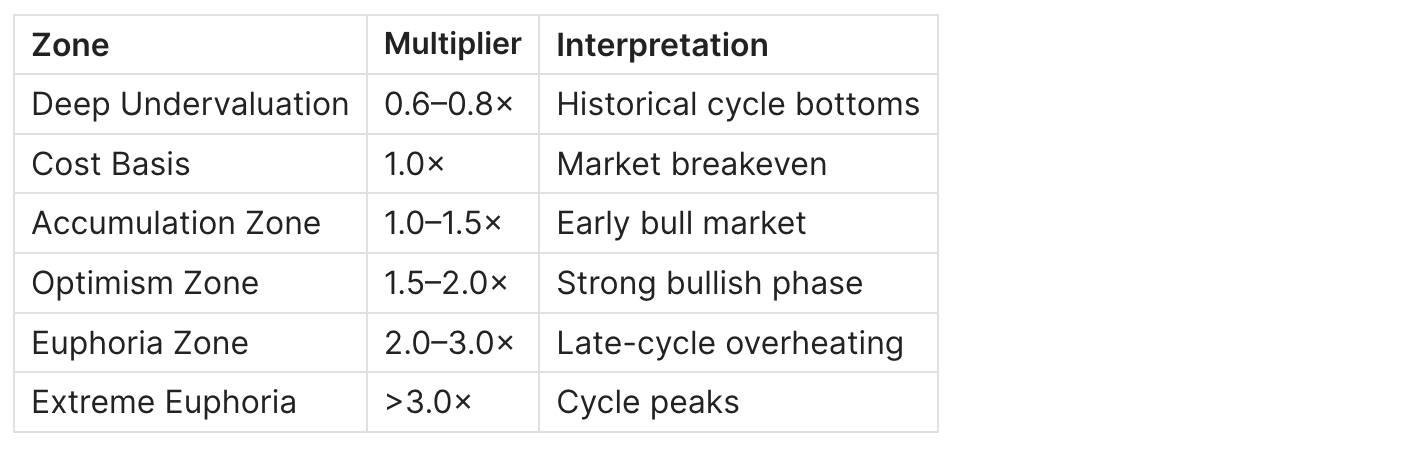
Commonly Used Multipliers
Data Sources:
- CryptoQuant — original source
- Glassnode — alternative provider
- Bitcoin Magazine Pro — free charts
How Realized Price Is Calculated
Step 1: Realized Capitalization
Each UTXO is valued at the BTC price when it was created:
Realized Cap = Σ (UTXO amount × BTC price at last movement)
Step 2: Cost Basis Per Bitcoin
Realized Cap is divided by circulating supply, producing the average realized cost basis.
Step 3: Constructing Bands
Multipliers are applied to Realized Price to generate valuation zones based on historical behavior.
Visualization:
[UTXO 1: 1 BTC @ $10,000] + [UTXO 2: 0.5 BTC @ $50,000] + ...
                              ↓
              Realized Cap = $10,000 + $25,000 + ...
                              ↓
      Realized Price = Realized Cap / Total BTC Supply
                              ↓
              Bands = RP × [0.8, 1.0, 1.5, 2.0, 3.0]
Interpreting Bitcoin Realized Price Bands
Price Below Realized Price (< 1.0×): Capitulation Zone
When Bitcoin trades below Realized Price:
- The average market participant is at a loss
- Selling pressure is typically exhaustion-driven
- Long-term accumulation opportunities emerge
Historical examples:
- 2015 bear market bottom (~$200)
- 2018–2019 capitulation (~$3,200)
- 2022 post-FTX collapse (~$17,000)
Price Between 1.0–1.5×: Accumulation Zone
This zone typically defines:
- Early bull market phases
- Post-capitulation recoveries
- Structural support during bull market corrections
Historically, this has been the most favorable long-term risk-adjusted accumulation range.
Price Between 1.5–2.0×: Optimism Zone
In this region:
- Most holders are in profit
- Volatility increases
- Profit-taking pressure begins to rise
This is not a sell signal, but a transition into higher-risk conditions.
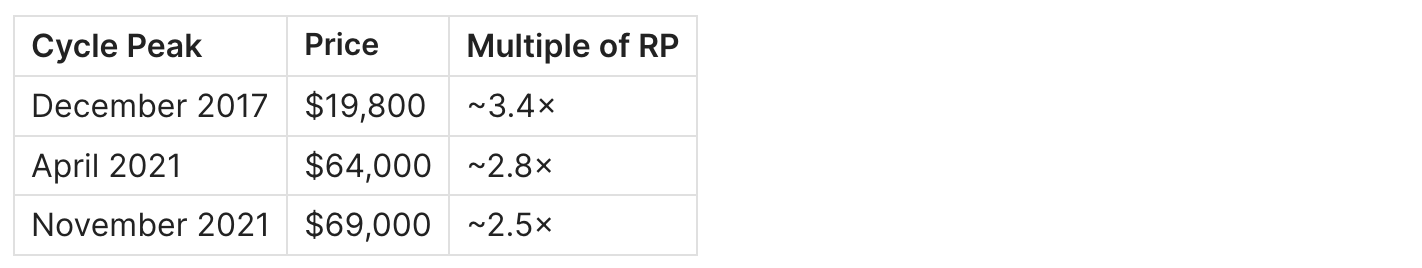
Price Above 2.0×: Euphoria Zone
Above 2.0× Realized Price:
- Market-wide profits become extreme
- Distribution risk rises sharply
- Cycle tops historically form in this range
Historical cycle peaks:
Practical Signals Using Realized Price Bands
Historical Example 1: 2018–2019 Cycle Bottom
Situation: December 2018, BTC drops to $3,200
Realized Price Bands behavior:
- Price fell below Realized Price (~$4,000)
- Reached 0.8× RP zone
- Stayed below RP for approximately 4 months
Outcome: Bitcoin rallied 1,500%+ over the following two years.
Historical Example 2: 2021 Cycle Top
Situation: April 2021, BTC reaches $64,000
Realized Price Bands behavior:
- Price reached 2.8× Realized Price
- Stayed in euphoria zone for over a month
- LTH distribution accelerated
Outcome: 50% correction to $30,000 followed within weeks.
Historical Example 3: 2024 Bull Market Correction
Situation: August 2024, post-halving correction
Realized Price Bands behavior:
- Price pulled back to 1.3–1.4× RP zone
- Found support above Realized Price
- Quick recovery toward optimism zone
Outcome: Accumulation zone held as support, confirming bull market structure.
Long-Term Accumulation Signals
Conditions for high-conviction accumulation:
- Bitcoin trades near or below Realized Price
- Confirmation:
- Negative exchange flows
(see: Bitcoin Exchange Netflow Explained) - STH SOPR < 1
(see: Bitcoin STH SOPR Explained)
- Negative exchange flows
These conditions historically coincide with forced selling exhaustion.
Risk Management and Distribution Signals
Warning signs for late-cycle risk:
- Price exceeds 2.0–2.5× Realized Price
- STH SOPR consistently above 1.05
- Exchange inflows increase
- Open Interest at elevated levels
This combination signals rising probability of distribution phase.
Combining Realized Price Bands with Other On-Chain Metrics
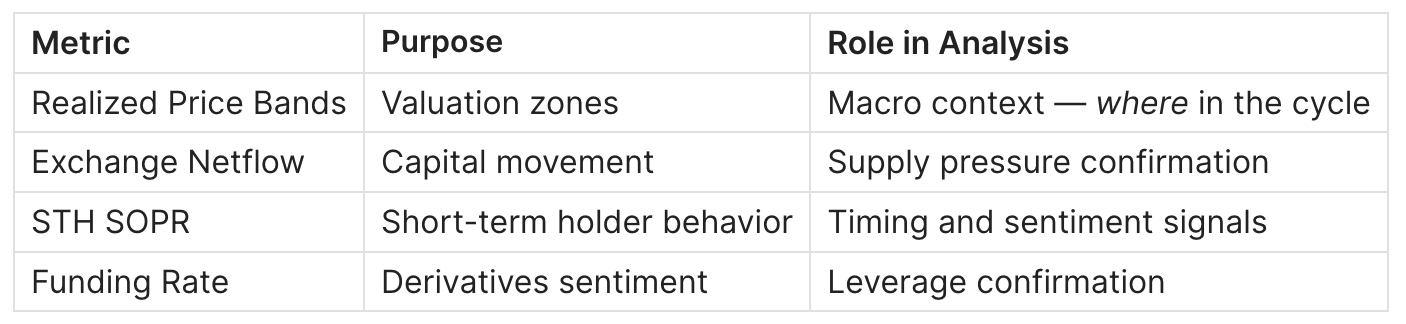
Combined signal example:
Price < Realized Price + Negative Netflow + STH SOPR < 1
= Strong accumulation signal

Price > 2.5× RP + Positive Netflow + STH SOPR > 1.05
= Elevated distribution risk
Limitations of Realized Price Bands
Structural Market Changes
- ETFs and institutional custody alter historical behavior
- Multipliers may require adaptation over time
- OTC flows are not captured in exchange data
Bull Market Persistence
- Price can remain above 2.0× for extended periods
- Bands are risk indicators, not precise timing tools
- False signals possible in strong trending markets
Black Swan Events
- Liquidity cascades can temporarily invalidate all levels
- On-chain data reacts to events, it does not predict them
- Always use risk management (stop-losses, position sizing)
Frequently Asked Questions
What Is Bitcoin's Realized Price Today?
Realized Price updates continuously. As of early 2026, Bitcoin’s realized price was in the low-to-mid $50,000 range, depending on methodology and data provider. For real-time values, refer to CryptoQuant or Glassnode.
Where Is Bitcoin Now Relative to Realized Price Bands?
Current analysis of Realized Price Bands and other on-chain metrics is published in ADLER AM — daily morning briefs on the Bitcoin market. Detailed market analysis is available on Substack via AdlerInsight.
Can Realized Price Bands Be Used for Trading?
They are best suited for:
- Long-term positioning and DCA strategies
- Risk assessment and cycle analysis
- Portfolio allocation decisions
They are not designed for short-term trading signals or day trading.
Do Realized Price Bands Work for Altcoins?
This methodology applies primarily to UTXO-based assets. Historical multipliers are Bitcoin-specific and should not be blindly applied to other assets. Ethereum and account-based chains require adapted methodologies.
How Reliable Are Realized Price Bands?
Realized Price Bands are among the most reliable macro indicators for cycle extremes. However:
- They require confirmation from other metrics
- Historical patterns may shift with market structure changes
- Best used as part of a comprehensive analysis framework
Conclusion
Bitcoin Realized Price Bands provide a robust, historically validated framework for understanding market cycles through the lens of on-chain cost basis.
Key takeaways:
- Realized Price = market cost basis. Price below RP signals capitulation and accumulation opportunity
- Multipliers create zones. 1.0–1.5× = accumulation, 1.5–2.0× = optimism, >2.0× = euphoria
- Historical peaks > 2.5× RP. Reaching this zone requires elevated caution
- Combine with other metrics. STH SOPR, Exchange Netflow, and Funding Rate improve signal reliability
- Adapt to new conditions. ETFs and institutional flows may alter historical patterns
This framework is most effective when used as part of a broader on-chain analysis system rather than as a standalone signal.
Educational content only. Not investment advice.