
🎧 Morning Brief #110 - audio debate on today’s market setup
Bitcoin's price has retreated from the October highs and is trading near $67K - roughly 22% above the realized cost basis. Today's two charts analyze the risk of selling pressure activation through historical precedents and the current distance to on-chain cost basis.
TL;DR
The strong selling pressure signal has been absent for 1133 days: the market remains above Realized Price ($54,803). Activating pressure would require a decline of approximately 22-23% from current levels - historically, such events occurred only during cyclical bear market phases.
Bitcoin: Sales Pressure - Days Between Signals
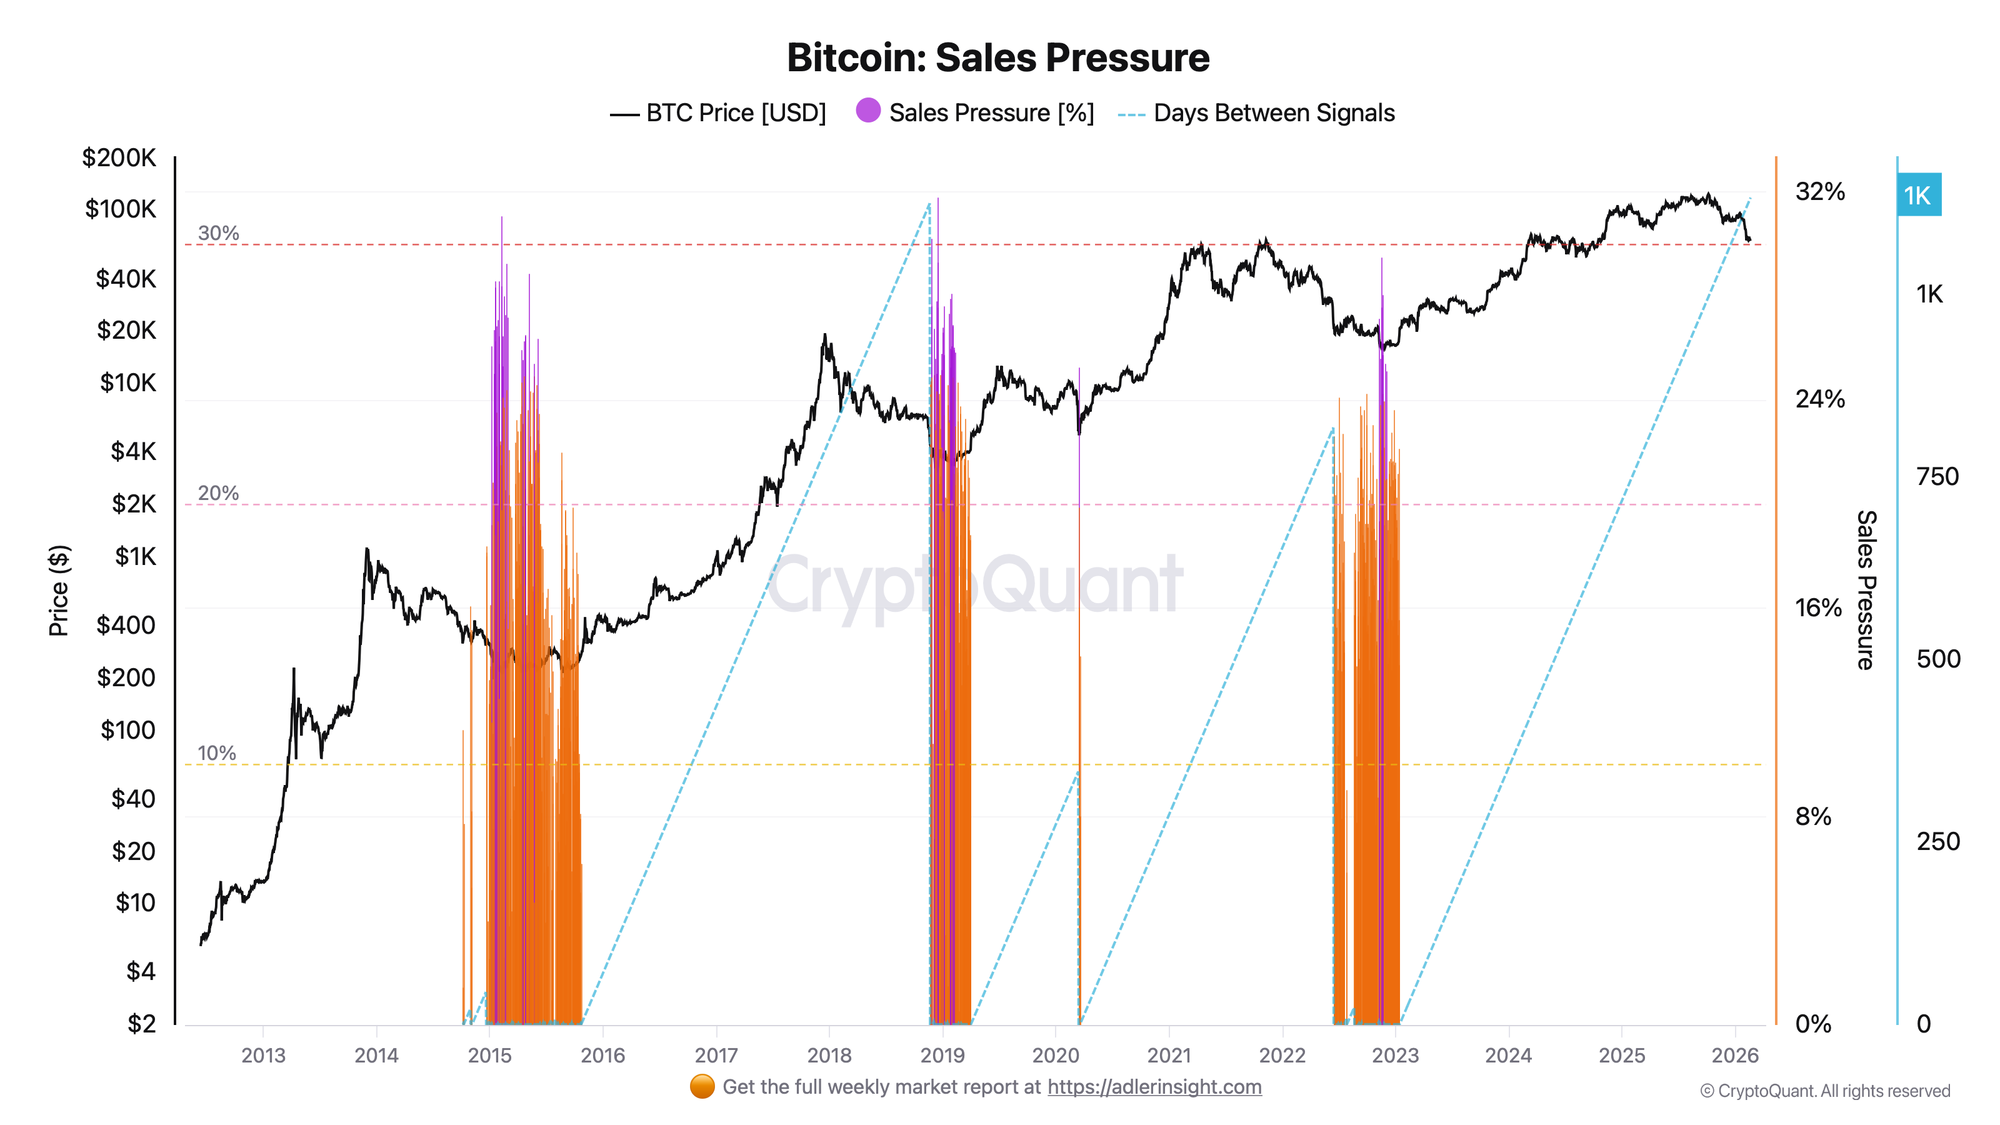
The metric measures the number of days elapsed since the last active selling pressure episode - a period when NUPL dropped below zero and LTH/STH SOPR deviated from one toward loss realization.
The last pressure episode concluded in January 2023. Since then, 1133 days have passed - the market has remained in a regime without pronounced capitulation. For comparison: in the 2018-2019 cycle, pressure lasted several months, with the peak of network stress occurring in December 2018. The 2022-2023 episode was the last time the spot price returned to the Realized Price level. Since early 2023, the price has not once declined to the level at which the average network participant would realize a cumulative loss.
The prolonged absence of a signal reflects the preservation of a structural buffer above Realized Price, but simultaneously means the absence of a full "cleansing" event over the past three years. If price reaches Realized Price, it will be the first such touch since 2023 - historically, such zones coincided with phases of maximum network stress and the final stages of bear cycles.
Bitcoin: On-chain Cost Basis vs Price Models
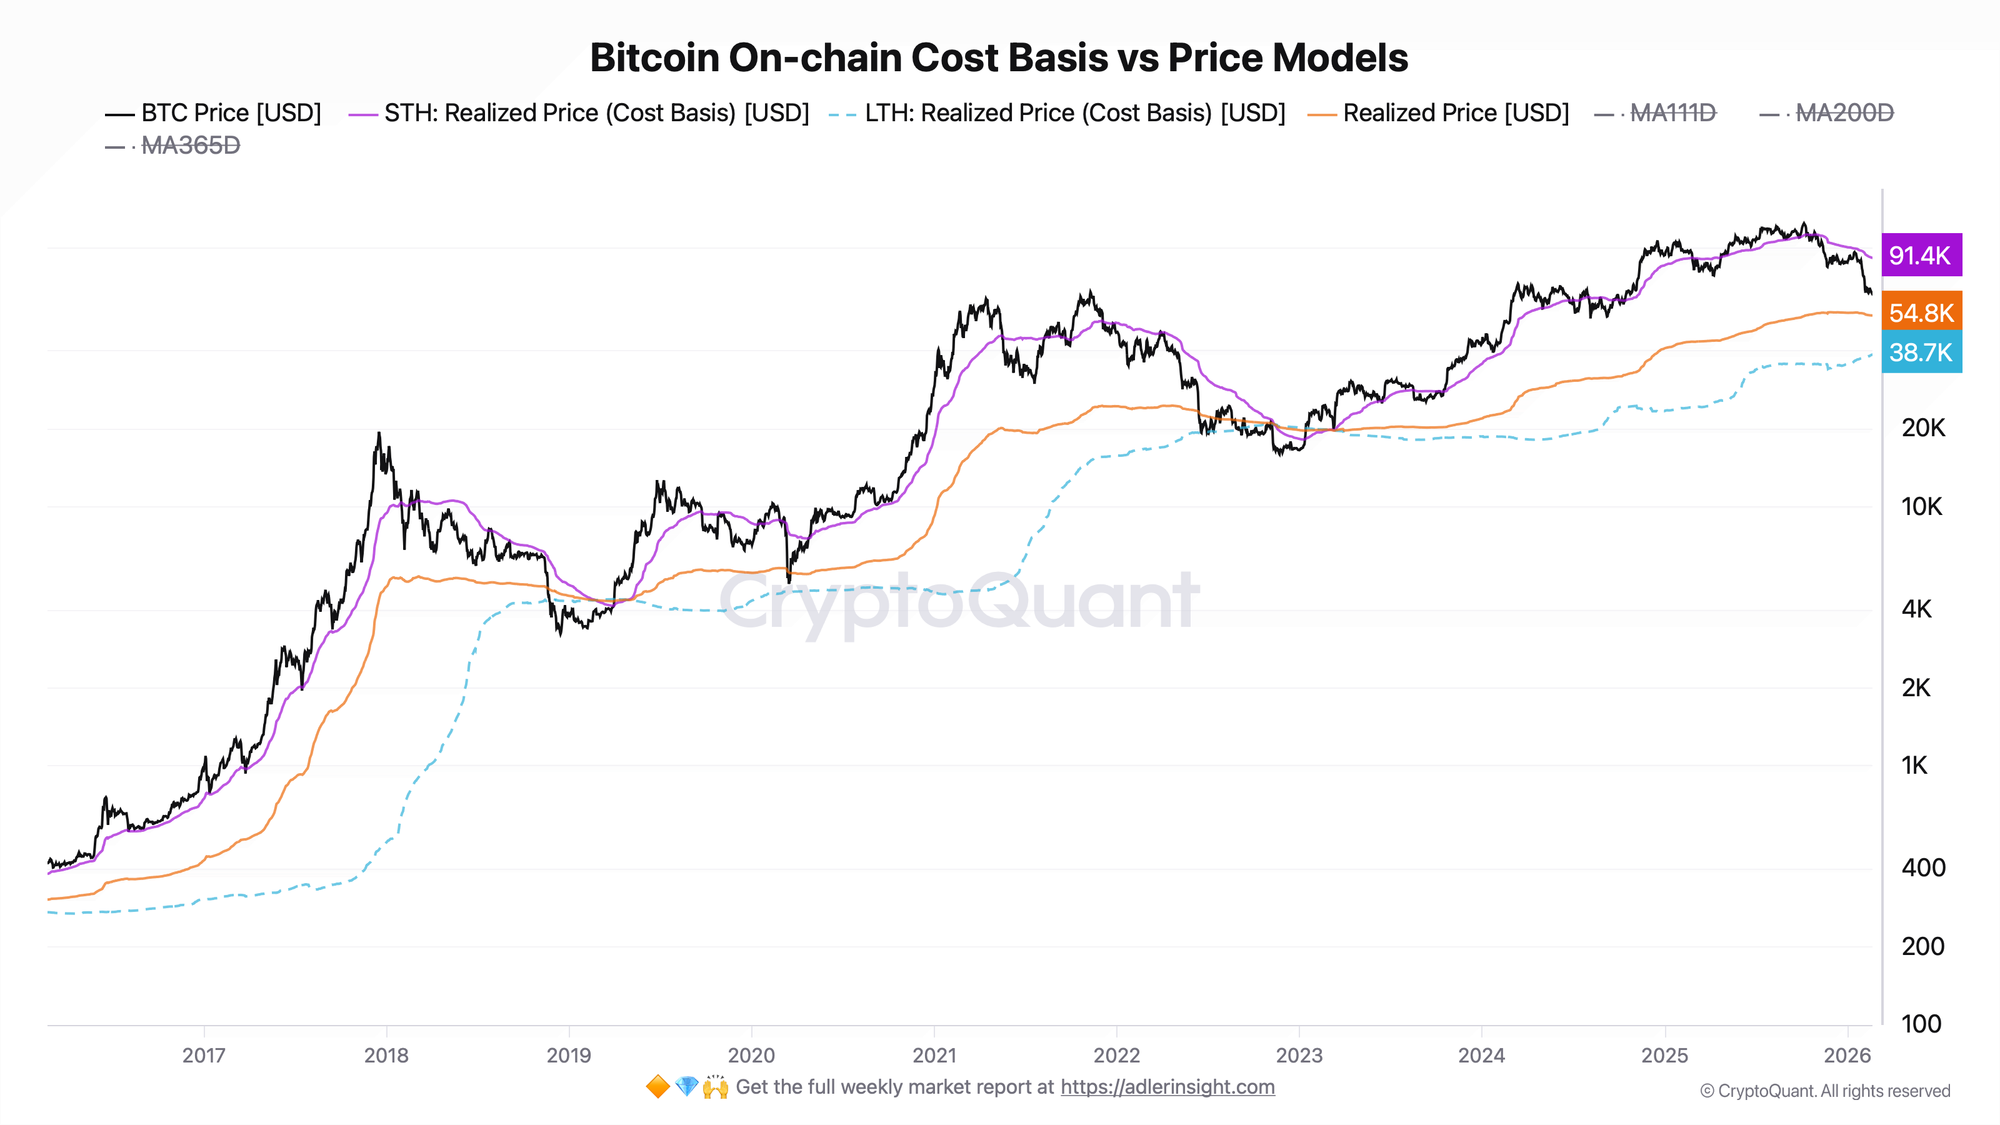
The metric displays the network cost basis across three levels: Realized Price - the average acquisition price of all coins in the network, STH Realized Price - the cost basis of short-term holders, and LTH Realized Price - of long-term holders. Each level serves as a potential support zone or source of pressure.
Currently, price ($67,319) sits between two key levels: above Realized Price ($54,803) by approximately 22.8% and below STH Realized Price ($91,401) by approximately 26.3%. This means short-term holders are collectively in unrealized loss - their average cost basis is nearly $24K above the current price. LTH Realized Price ($38,736) continues to rise and remains significantly below the market, confirming that long-term participants retain their profit and are not generating systemic pressure. Realized Price has been declining for the second consecutive month - this reflects a gradual downward shift in network cost basis amid coin redistribution.
The key level for assessing cyclical risk is $54,803. This is where the market last stood in January 2023. A sustained break below this level would push the average network position into loss and activate the Sales Pressure indicator - historically, such conditions corresponded to phases of maximum stress within the cycle.
Link: The Sales Pressure chart shows when pressure activates, while Cost Basis shows where its structural threshold lies. Today both instruments point to the same level: $54,803 is the boundary between preserving the structural buffer and transitioning into a network stress regime. As long as price remains above this level, the 1133-day silence continues. A break lower would be the first such event in three years and would require a reassessment of the current market outlook.
🛡️Protect capital first. Capture upside second - start 7 days free. Built for long-term investors who want performance, not stress.
FAQ
Why does STH Realized Price at $91K matter if there is no selling pressure?
STH holders are collectively approximately 26.3% underwater - this creates potential supply on any bounces. Any move into the $80-91K range may be accompanied by selling from short-term participants seeking to break even. This is not a capitulation zone, but a zone of probable resistance.
What happens if price touches Realized Price at $54,803?
Sales Pressure activates for the first time since 2023: NUPL will turn negative, and LTH and STH SOPR will begin to deviate sustainably below 1. Historically, the first touch of Realized Price in the late stage of a correction coincided with the phase of maximum stress, not with the beginning of a new growth cycle. This is a zone of elevated risk that simultaneously served as structural support in past cycles.
CONCLUSIONS
The two charts present a consistent picture. Sales Pressure has not been activated for 1133 days - the longest such period in Bitcoin's entire history. On-chain Cost Basis explains why: the buffer between price and Realized Price stands at approximately 22.8%, and eliminating it would require a decline of roughly $12,500. The current regime is bearish with a preserved structural buffer: LTH remain in profit, Realized Price holds below the market, and the Sales Pressure indicator is not triggered. The key trigger is a sustained weekly close below $54,803, which would activate the network stress regime for the first time in three years. The primary constraint on recovery is STH Realized Price at $91,401, forming a significant supply zone that will weigh on any attempts at a rebound.