
🎧 Morning Brief #0096 - audio debate on today’s market setup
After the price crash from $84K to $75K over the weekend, both indicators are signaling extreme selling pressure in sync. Flow Index dropped to a minimum of 7.1%, while Local Stress Index reached a peak of 92.5 - levels that historically preceded local bottoms.
TL;DR
Synchronized collapse in flows and stress spike point to capitulation. The key question is whether the market can hold $76K.
Bitcoin Futures Flow Index
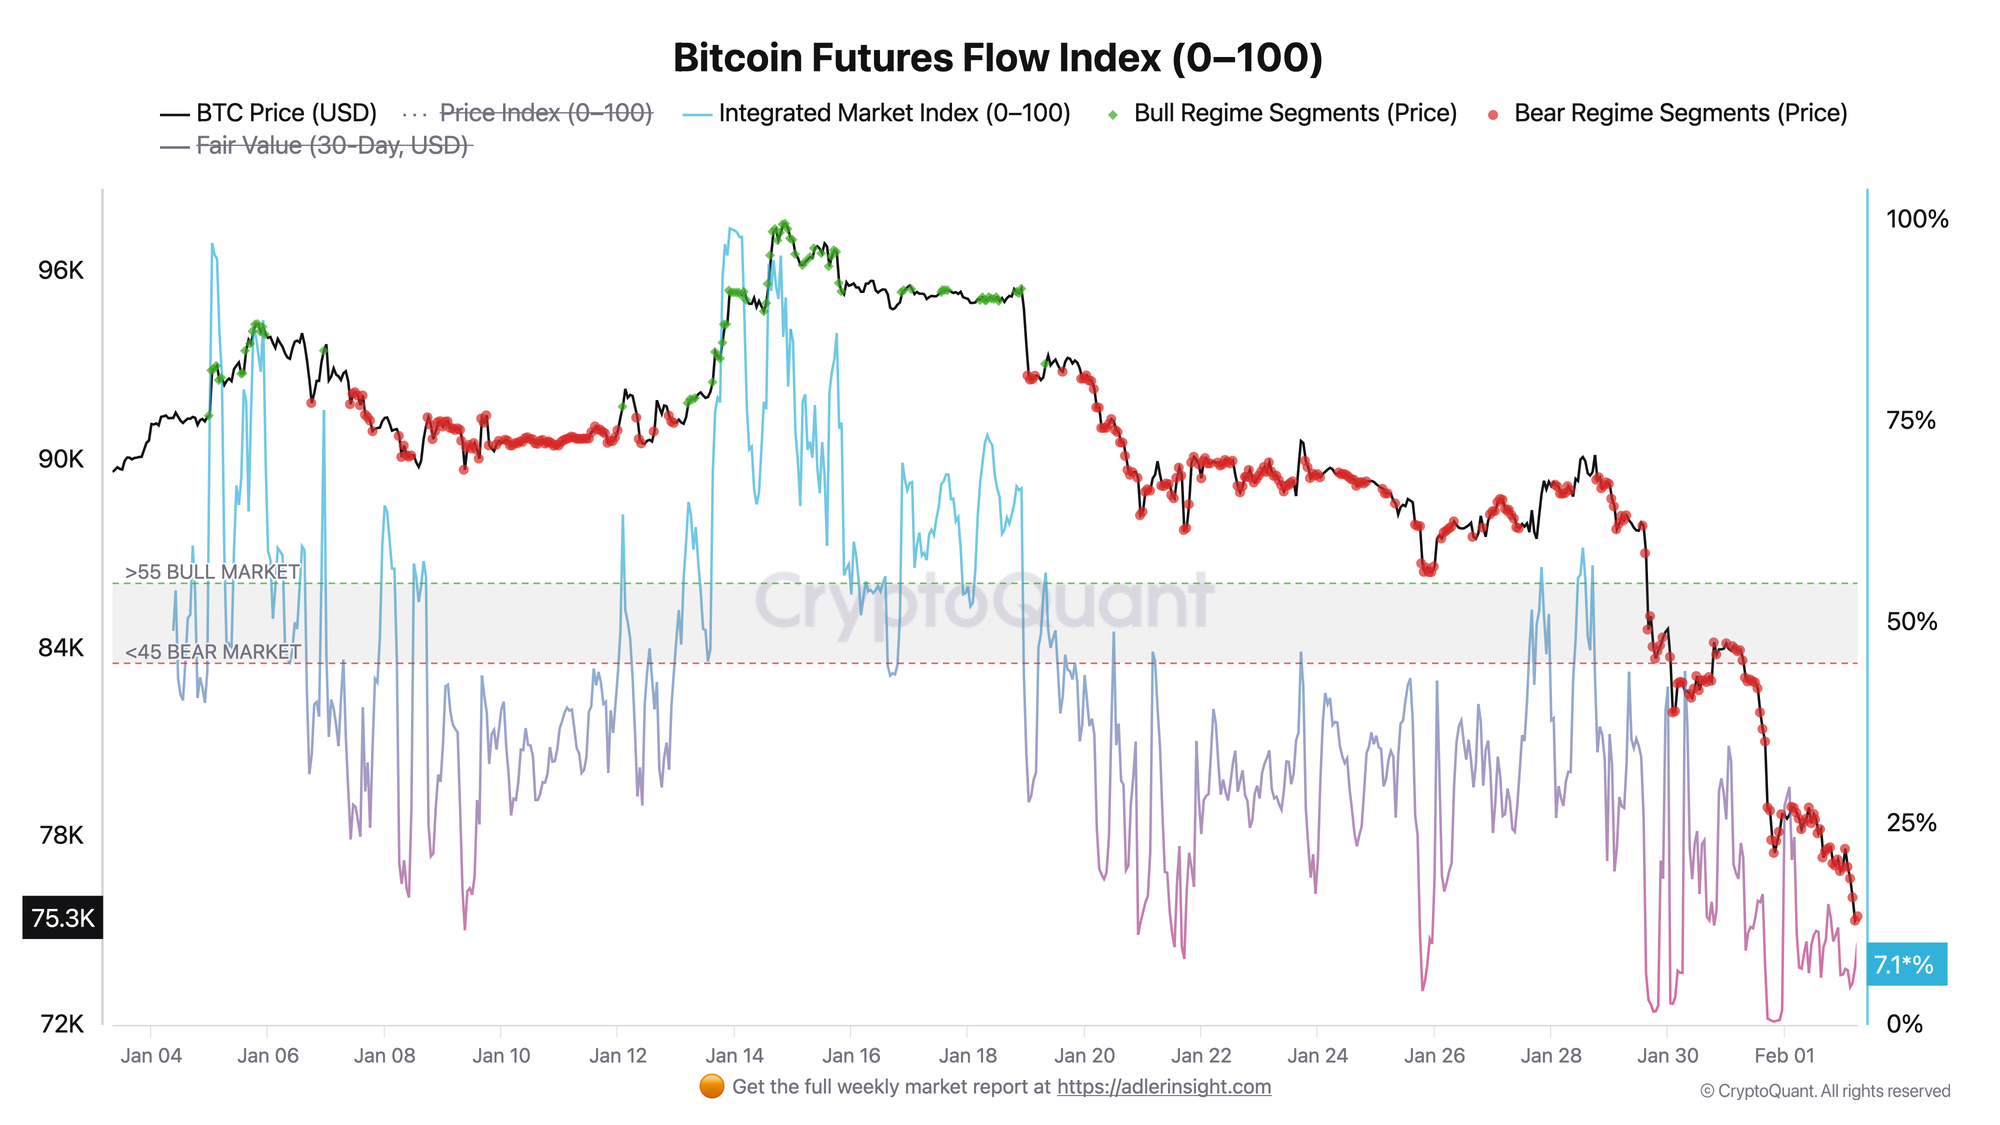
The index combines price dynamics with derivatives flows (taker volume + open interest change).
Since Friday, Flow Index crashed from ~50 to a critical 7.1% - this is the lower boundary of the scale and an extreme value for the past month. Red dots (Bear Regime) continuously mark the price since January 28, confirming a sustained bearish regime. Important: since January 30, the index has fallen below the 45% threshold, which defines the bear market boundary according to the model.
A reading of 7.1% historically corresponds to capitulation zones. For a regime change, the index must return above 45% with price stabilization. Until then, any bounce remains technical within a bearish structure.
Bitcoin Local Stress Index
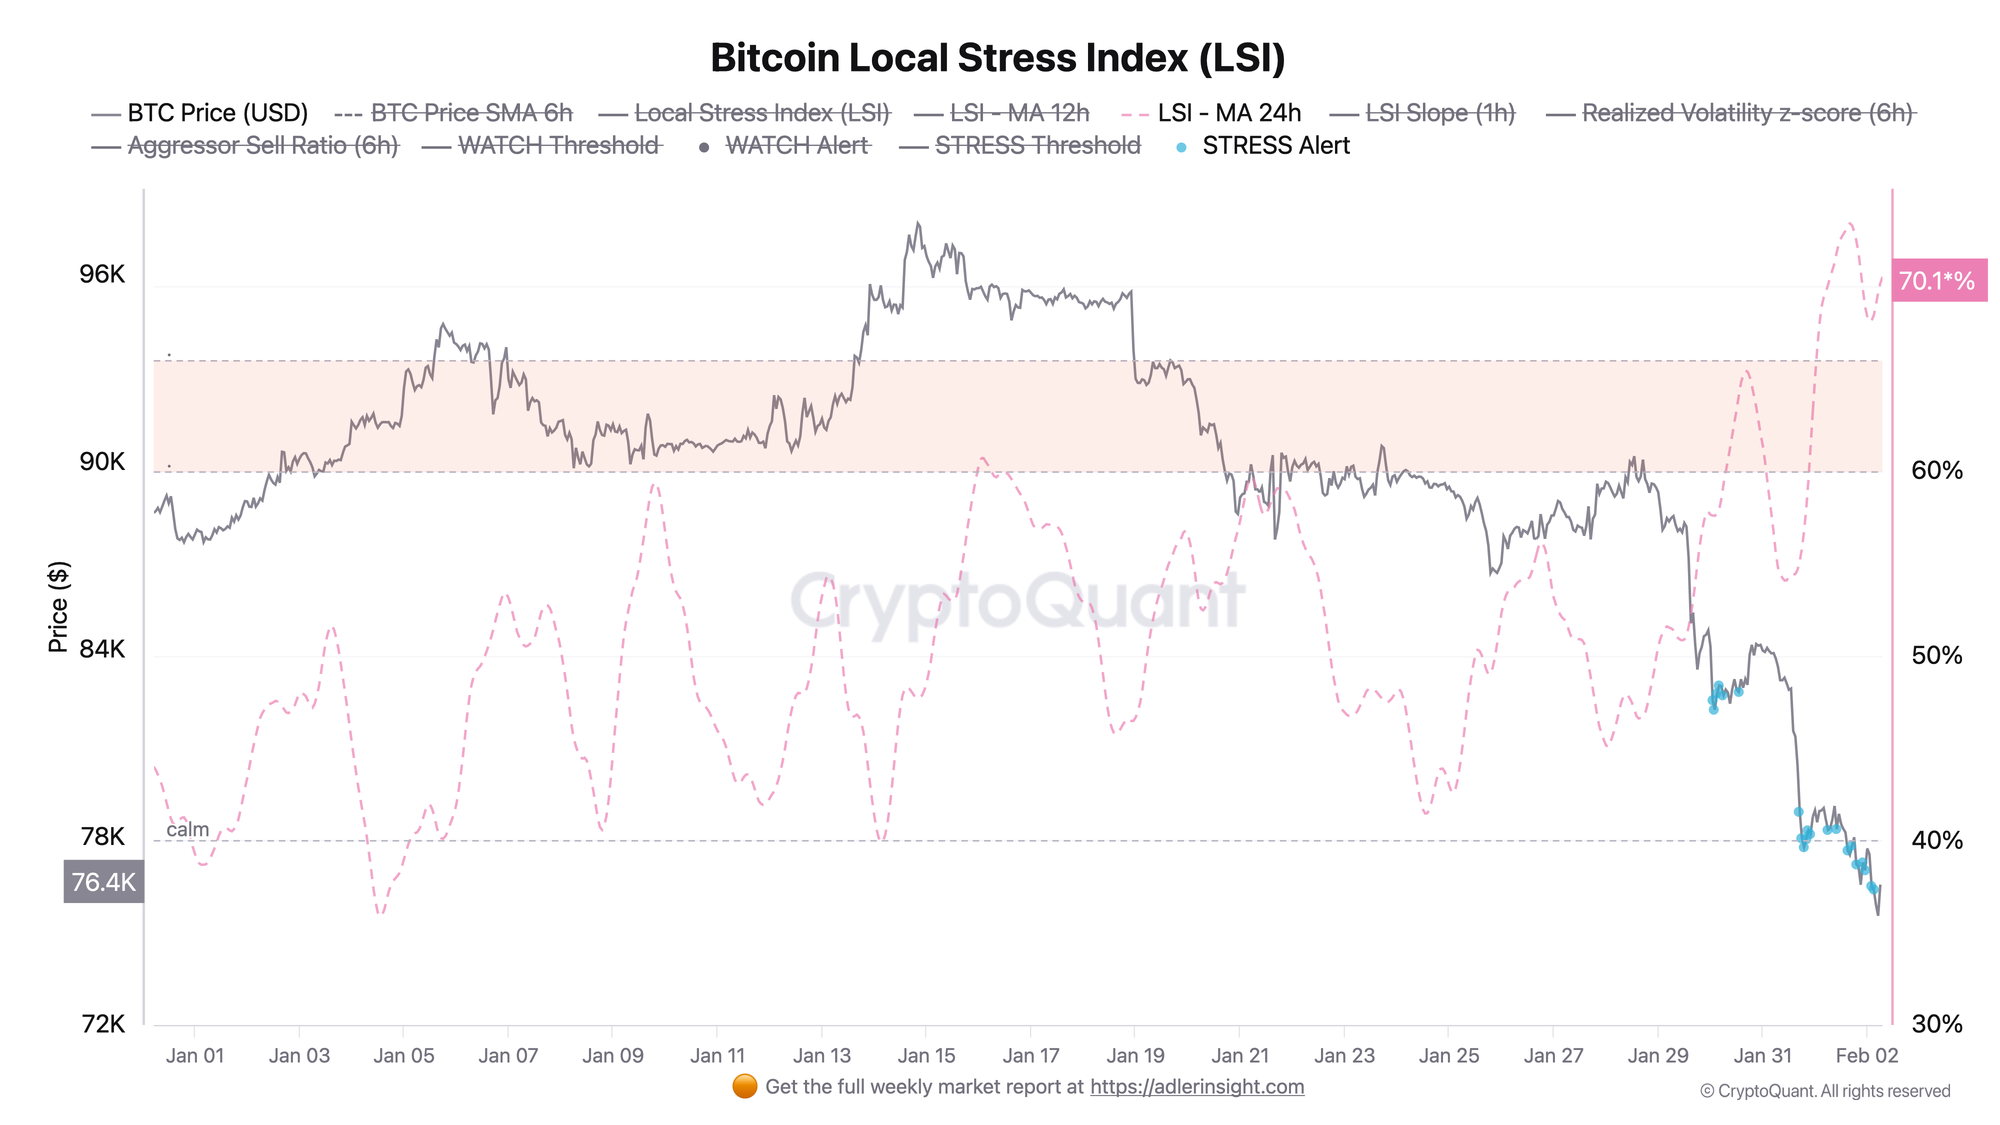
Bitcoin Local Stress Index (LSI) aggregates volatility, funding rate and leverage into a single stress index.
The index reached a peak of 92.5 on Friday evening (January 31, 22:00 UTC) amid the price crash below $78K. Over the weekend, the index has been in TAIL RISK WATCH state - this indicates that all stress gates (Trend down + Volatility On + Flow Bias) were active simultaneously. The current value of 73 remains in the ELEVATED zone.
LSI above 90 historically coincides with local price bottoms. If LSI breaks above 80 again under renewed pressure, it will indicate a continuation of the cascade.
Both indicators paint a common picture: Flow Index at an extreme low, LSI at peak. This is a capitulation signature - when pressure is at maximum and the market begins attempting to absorb volumes.
FAQ
Why is Flow Index at 7.1% important?
Values below 10% are rare and indicate seller exhaustion in derivatives. Historically, such levels preceded bounces, though they do not guarantee an immediate reversal.
What price level will confirm stabilization?
Holding $75K with LSI declining below 65 and Flow Index recovering above 25% will be the first signal that the local stress event is over. A break of $74K with rising LSI is the continuation scenario.
CONCLUSIONS
The synchronized collapse of Flow Index to 7.1% and LSI peak at 92.5 paint a picture of local capitulation: the derivatives market has processed extreme bearish pressure, and stress metrics have reached levels that historically coincided with reversal points. Current regime is high risk but with signs of shock absorption. Improvement trigger: stabilization above $75K with LSI declining below 65. Main risk: a repeat stress event on a break of $74K, which would open the path to $72K.