
Bitcoin Trades 15% Below Recent Buyers' Cost Basis

Bitcoin has fallen below the STH Realized Price as cumulative ETF flow continues to decline.
TL;DR
By the end of the week, Bitcoin was 15% below the average cost basis of short-term holders. Over the same week, cumulative ETF flow fell to 636K BTC.
- $61,987
- Bitcoin price at week-end
- 15.7%
- Below STH Realized Price
- 0.84
- Price-to-cost-basis ratio
- 636.3K BTC
- Cumulative Bitcoin ETF flow
Bitcoin Price Versus STH Realized Price
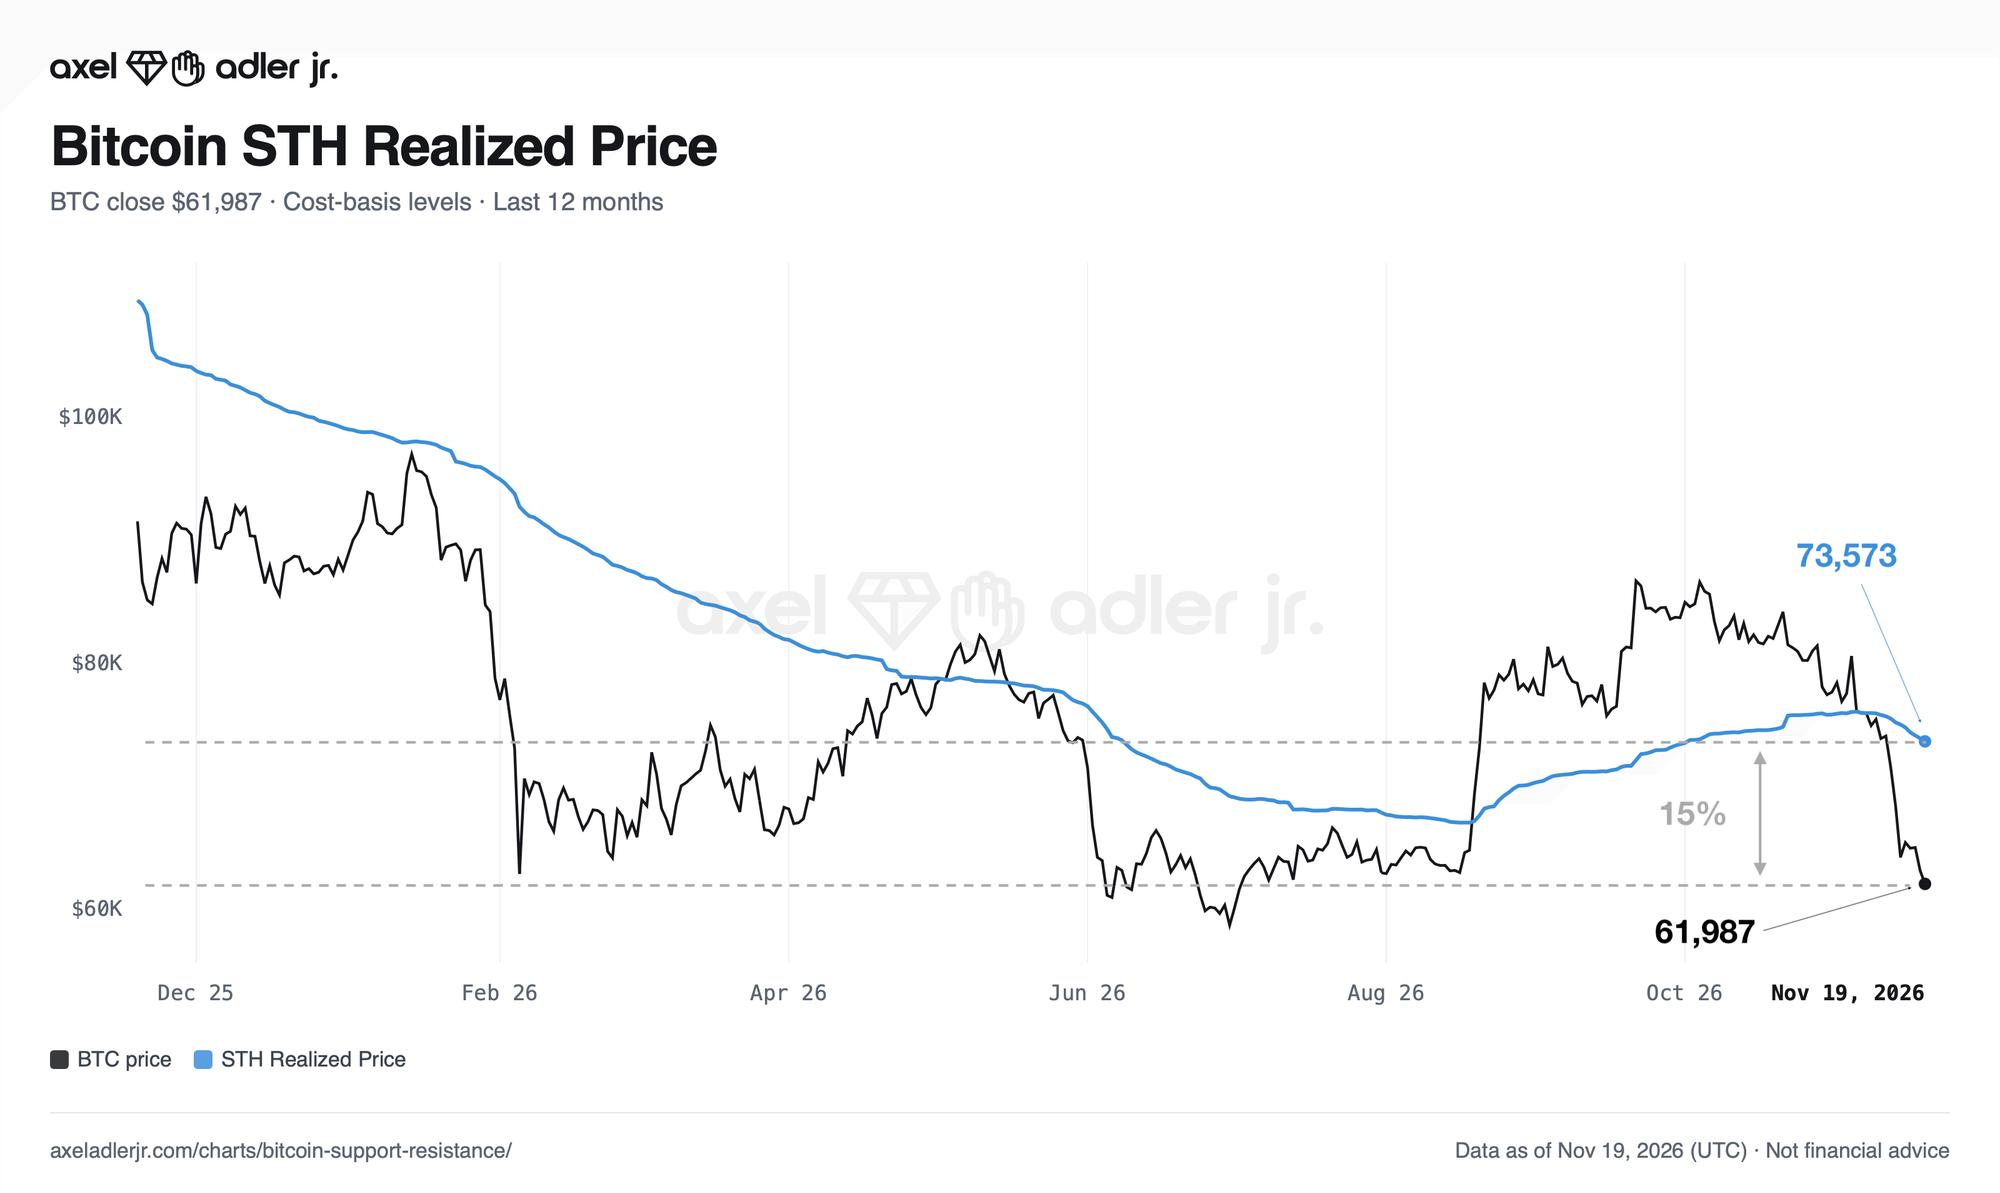
By the end of the week, Bitcoin was trading at $61,987. That put the price 15.7% below the STH Realized Price. The price-to-cost-basis ratio stood at 0.84. Bitcoin has remained below this level for 12 straight days. Recent buyers are therefore holding unrealized losses.
The monthly decline in the ratio was one of the sharpest of the past year. A close above $73,573 would put Bitcoin back above the average cost basis of short-term holders. The STH Realized Price is a reference level and potential support.
Cumulative Bitcoin ETF Flow
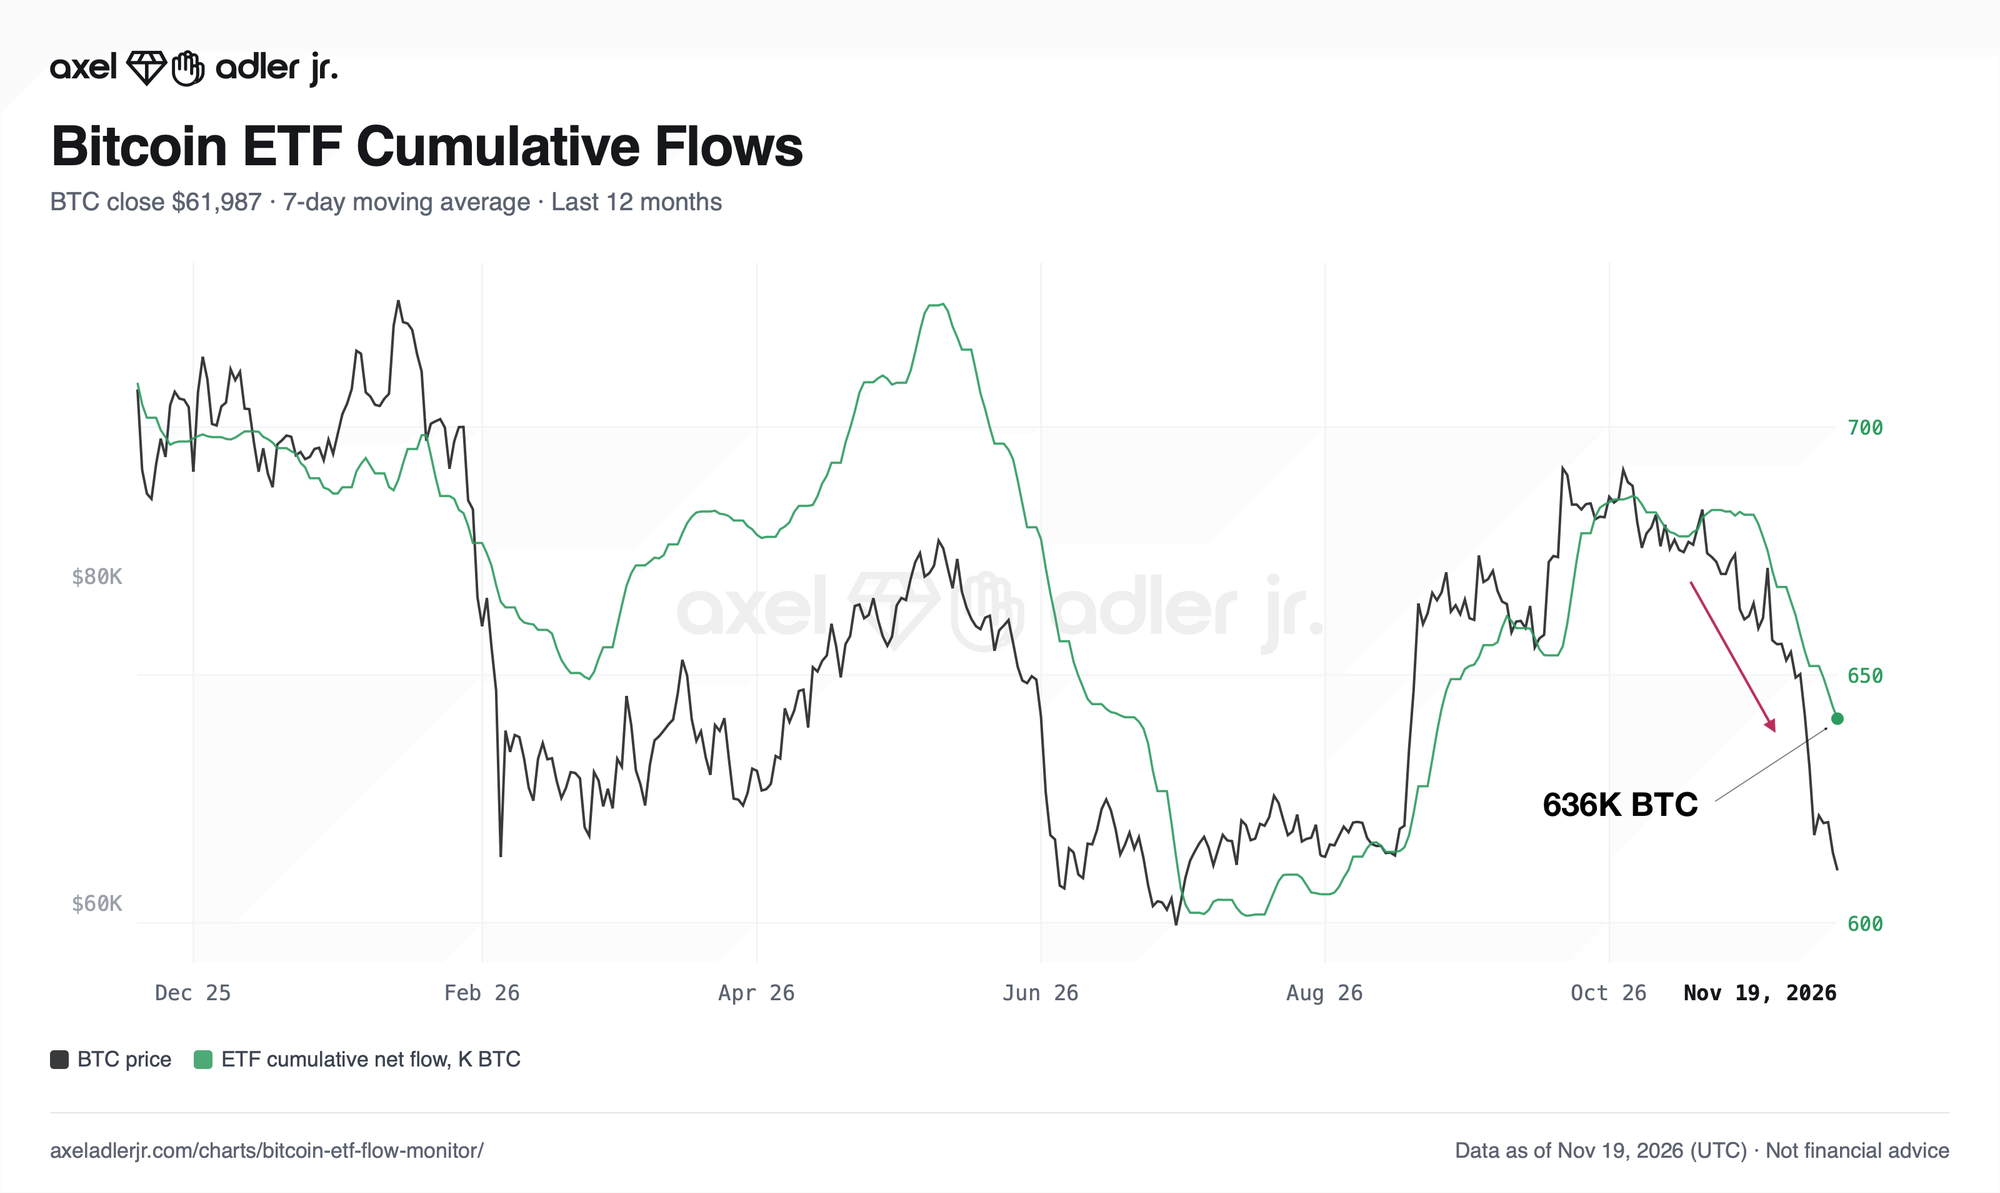
By the end of the week, cumulative Bitcoin ETF flow stood at 636.3K BTC. It fell by 19.8K BTC over the week. The measure remains positive, though its direction is now lower. The line uses a seven-day moving average.
The decline shows that funds generated net outflows during the week and did not support demand. The key point to watch is whether the contraction continues or the line turns higher.
FAQ
What Happened After the Last Similar Drop Versus Cost Basis?
The ratio was similarly low on June 9, 2026. Bitcoin was trading at $61,730 at the time. The price was 6.4% higher one week later. This is a historical comparison, not a guide to the current move.
How Often Is Cumulative ETF Flow This Low?
Over the past year, cumulative ETF flow was at this level or lower on 16% of days. That makes the current reading rare.
Conclusions
Bitcoin remains 15.7% below the cost basis of short-term holders. Cumulative ETF flow is also declining. Together, these signals confirm that the correction remains under way.
A move back above the STH Realized Price alongside a turn higher in ETF flow would strengthen the case that support is forming. If price stays below that reference and flow keeps falling, the combination would point to deeper market stress.
Live Charts
Explore the metrics behind this brief with live, auto-updating charts:
Valuation Models — All valuation and cost-basis model charts in one view.
BTC US ETF Flow Monitor — US spot Bitcoin ETF daily flow, BTC-denominated accumulation, and fund leadership.
MVRV Ratio — Market value vs realized value to identify valuation regimes and cycle risk.
NUPL — Net unrealized profit/loss across holders, mapped into cycle sentiment phases.
Your call is in. See how the on-chain data reads it every Monday →