
Bitcoin is accelerating, price momentum by RSI is already in overbought territory, with moderate on-chain P&L.
TL;DR
The market has accelerated, momentum is strong, RSI is in overbought territory, and on-chain Realized Profit/Loss remains moderate. The base scenario is a local correction. The appearance of bearish divergence, sustained momentum weakening, and a spike in profit-taking or the metric moving into negative territory will accelerate the correction.
#RSI #PROFIT-AND-LOSS #BTC
Bitcoin Relative Strength Index

Bitcoin price has accelerated to $125K and broken upward from multi-week consolidation, updating local highs. Momentum looks sustainable, but correction risk emerges: after a series of higher lows, the market has shifted into trending mode, where buying quickly finds continuation. Looking at history, such levels lead to a breather/correction to discharge overheating, but in strong bullish phases RSI can hold above 70 longer than usual. Signs of weakening will be bearish divergence and sustained RSI return below 70–65; at the current moment this is absent, but a local correction scenario emerges.
Bitcoin Cumulative P&L 30D
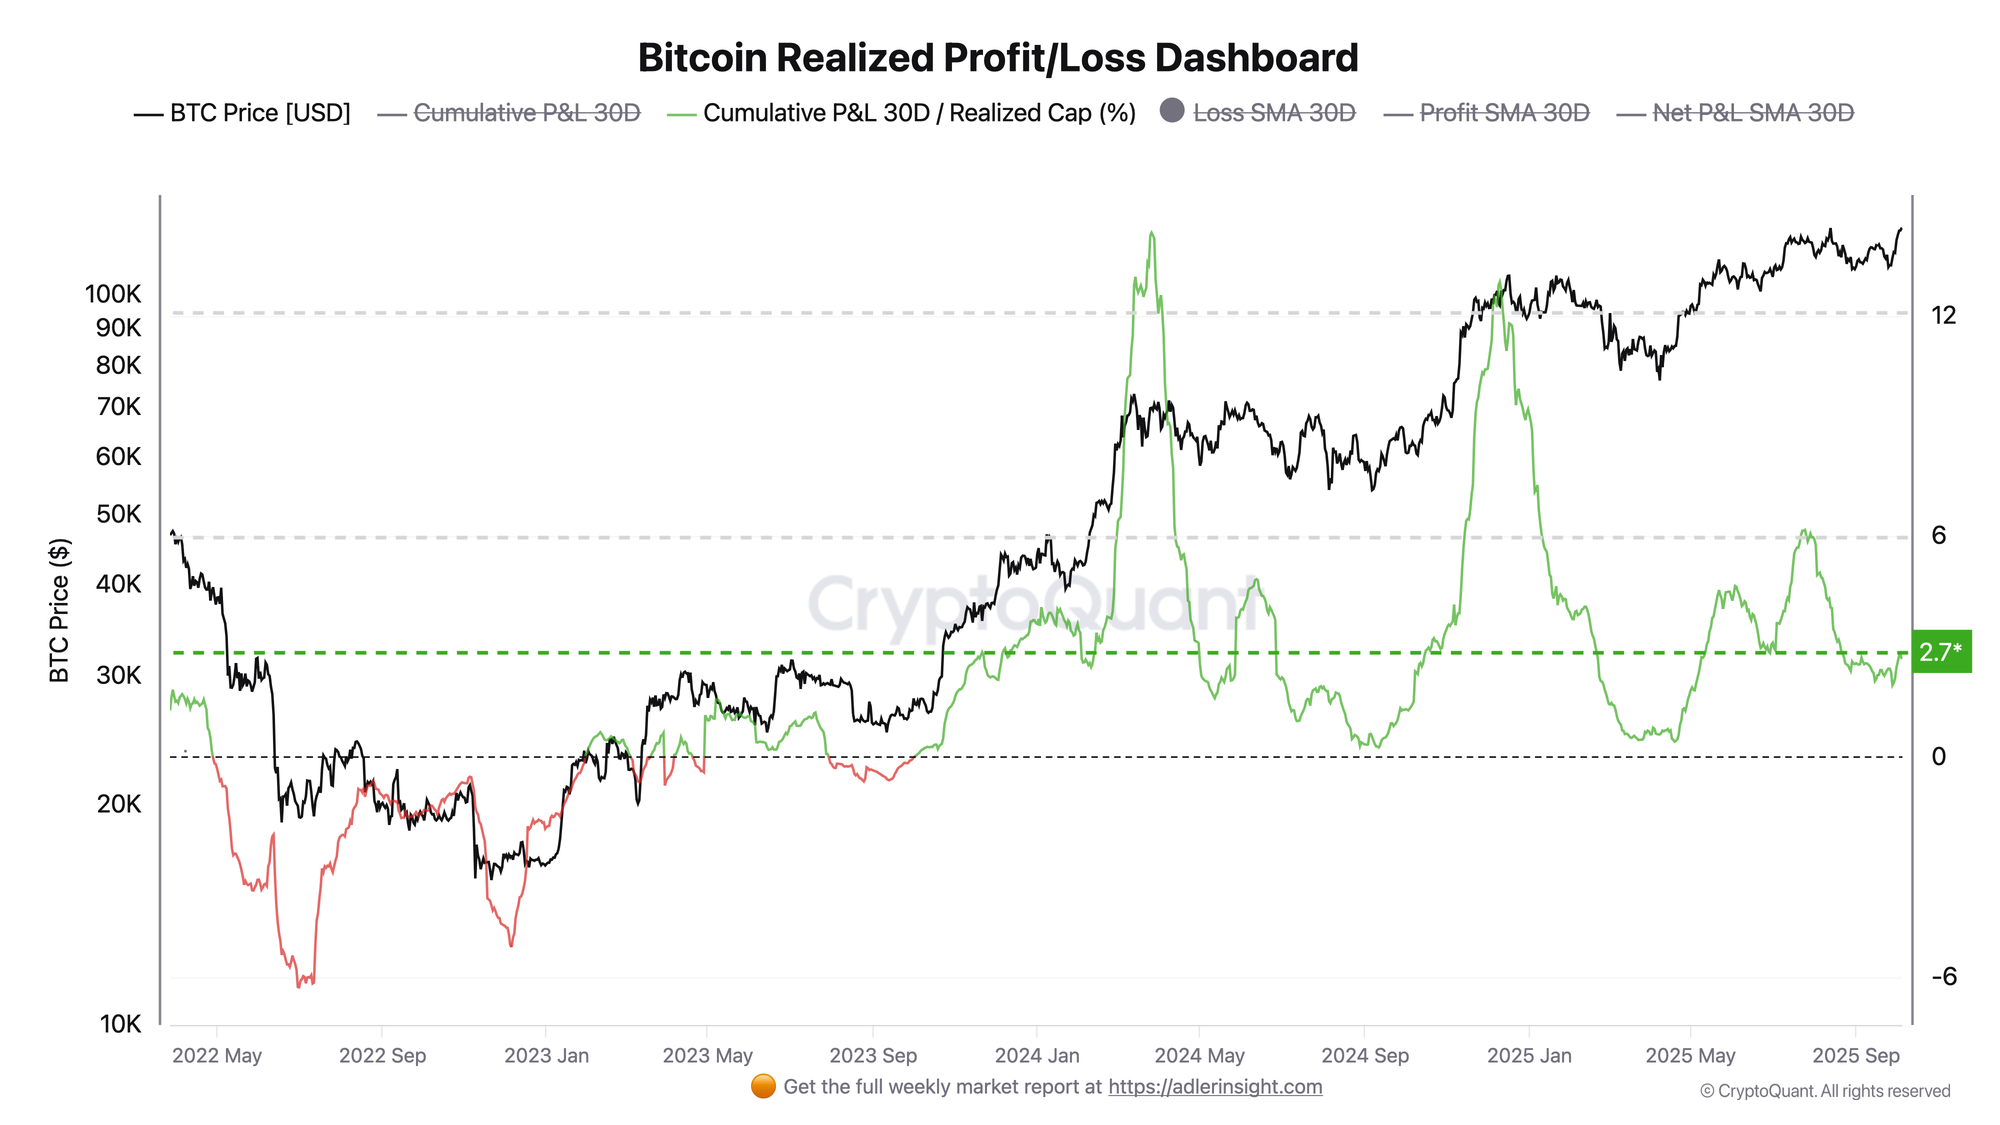
Cumulative P&L 30D / Realized Cap (%) is the intensity of profit and loss realization in the network. Over the last 30 days, cumulative realized profit and loss across all coins that moved on-chain. When the indicator is above 0%, participants are massively locking in profit; when below 0%, loss realization (capitulation) dominates. Dividing the metric by Realized Cap makes the curve comparable between cycles and sensitive to demand overheating/cooling.
In this cycle, we've seen spikes above 6–12% during euphoria phases: this was accompanied by powerful overheated waves and subsequent corrections/consolidations. Deep pullbacks coincided with the indicator moving to 0% and below - when the market digested bull pressure. Currently, the value is at 2.7% - a moderately positive zone: profit is being locked in, but without panic dumping or extreme distribution, as at peaks.
Current demand inflow covers sales, there is no immediate overheating risk. If the indicator expands to 5–6%+ on high updates, the probability of "distribution" and a sharper pullback will increase (such clusters led to 10–20% corrections). Conversely, gradual sliding to 1–2% while holding price at the top is a bullish signal of solid demand support. It's critical to monitor moves <0% together with loss of key levels - this will be a sign of phase cooling.

FAQ
What does RSI at 78% mean with Bitcoin's surge above $125K?
RSI at 78% signals strong momentum and entry into overbought territory. In bullish phases, RSI can hold >70 for weeks while demand inflow covers profit-taking. First signs of exhaustion are bearish divergence and sustained RSI return below 70–65 with slowing high updates.
How to read the Cumulative P&L 30D / Realized Cap metric?
The metric shows the share of realized result (profit–loss) over 30 days relative to Realized Cap. In the 1–4% zone, the trend is usually healthy, demand absorbs sales. Sustained expansion to 5–6%+ precedes intensified selling and 10–20% pullbacks.
Conclusions
The momentum breakout is confirmed: RSI holds in overbought territory, but local correction risk emerges. On-chain P&L indicates moderate profit-taking - far from distribution extremes.