


Aggressive buying once again dominates, while open interest is shrinking at the same time. This is an important combination: buy-side initiative has strengthened, but it is not yet accompanied by an expansion in derivatives positions and has not pushed Bitcoin out of its range.
TL;DR
Over the past 48 hours, the 6-hour Net Taker Volume Oscillator was positive in 35 of 48 readings, with an average value of +2.93%. At the same time, the 6-hour change in Open Interest was negative in 31 of 48 readings and averaged -0.30%.
Buyers are currently more active than sellers, but the market is not adding open derivatives positions. This is a constructive structure, but it does not yet confirm a new upward impulse.
Bitcoin Net Taker Volume Oscillator
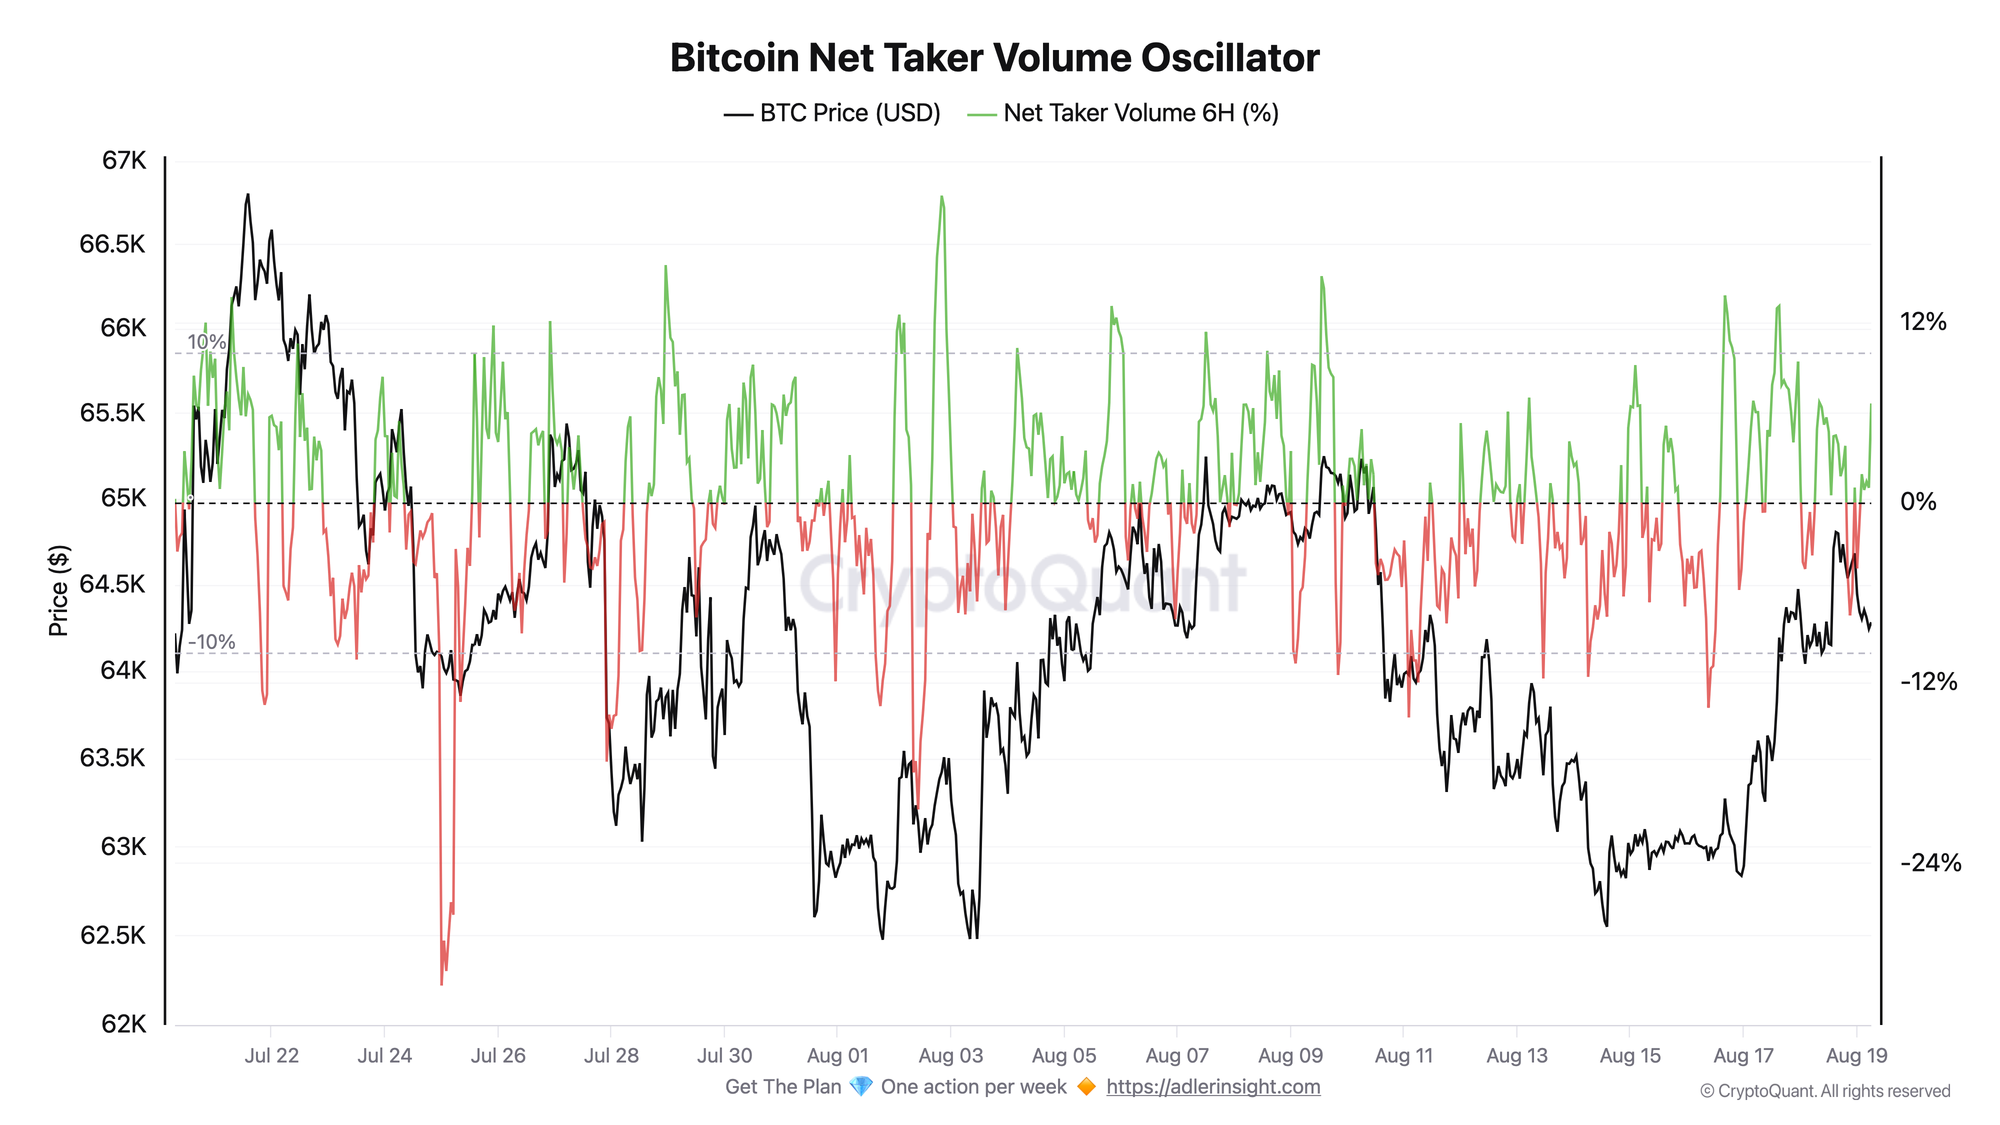
The oscillator shows the balance between aggressive buying and selling over a rolling 6-hour window. Positive values mean taker buy volume dominates, while negative values mean taker sell volume dominates.
Over the past 30 days, the indicator moved from a low of -32.17% on July 25 to a high of +20.43% on August 2. Its average value for the entire period was only +0.27%, meaning the balance remained nearly neutral on a monthly basis.
The latest readings are noticeably stronger. The 6-hour oscillator was above zero in 35 of the past 48 readings, with an average value of +2.93% over this period. Over the past 24 hours, 19 of 24 readings were positive, with an average of +1.81%. The current reading has risen to +6.60%.
This shows a sustained short-term advantage for aggressive buyers. However, positive taker flow alone does not mean the price must rise quickly: opposing limit sellers can absorb this flow.
Bitcoin Open Interest Change
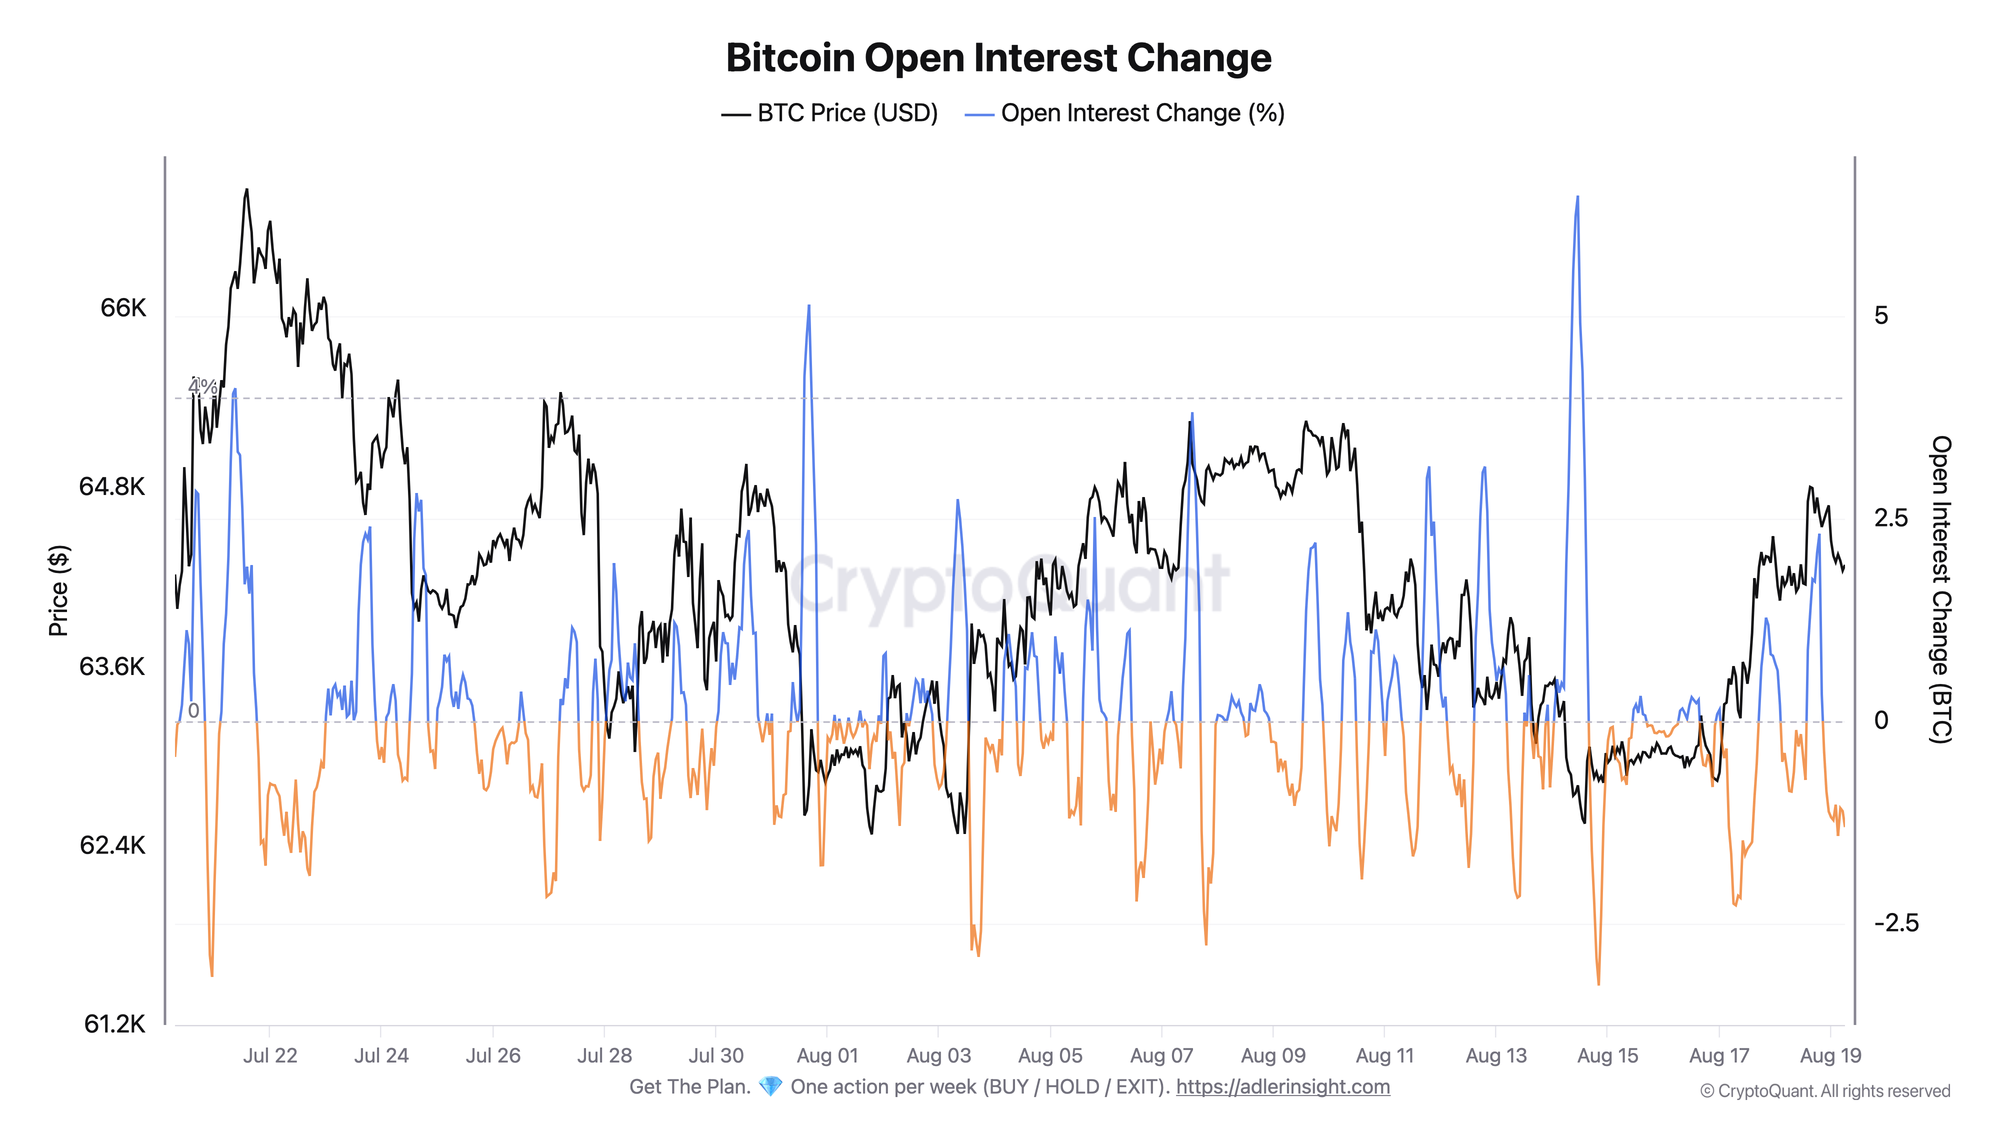
The metric shows the change in BTC open interest over the previous 6 hours and is recalculated every hour. A positive value means there are more open derivatives positions, while a negative value means there are fewer.
On August 14, the market went through a sharp expansion and subsequent contraction in open interest. The 6-hour change first reached +6.49%, then fell to -3.27% several hours later.
Over the past 48 hours, negative readings were recorded in 31 of 48 cases, with an average change of -0.30%. Over the past 24 hours, 17 of 24 readings were negative, with an average of -0.15%. The current reading is -1.31%.
At the same time, Bitcoin is trading at $64.3K and has gained 1.17% over the past 48 hours.
This means the current buy-side advantage is not accompanied by an increase in open interest. New derivatives positions are not an obvious source of the move - aggregate OI is declining instead.
Your biggest Bitcoin loss may come from staying exposed after the market regime has changed. Weekly Engine tells you when to hold, reduce risk, or stay out - with clear triggers, exposure caps, and invalidation levels. Try it free for 7 days.
FAQ
Why are takers buying while the price is not breaking higher? Aggressive buying shows who is initiating trades, but it does not show the amount of passive supply on the other side. If large limit sellers are willing to absorb this demand, positive taker flow may fail to produce strong price growth for an extended period. The current data are consistent with such absorption, but do not prove it on their own.
Is declining Open Interest a positive signal? Not automatically. Declining OI means there are fewer open derivatives positions, but it does not show which specific positions are being closed. The combination matters in the current setup: the price is holding, taker flow is positive, and OI is not expanding. This means the market is not yet showing signs of an aggressive buildup in derivatives risk.
CONCLUSIONS
The short-term structure has become more constructive: aggressive buyers dominate while open interest declines. Bitcoin has gained 1.17% over the past 48 hours, but the buy-side advantage has not yet produced a full breakout from the range.
The main continuation signal is sustained positive Net Taker Volume alongside a price break above the upper boundary of the past 30 days near $66.8K.
Until that happens, the current picture shows a buy-side advantage without an expansion in derivatives positions.
Live Charts
Explore the metrics behind this brief with live, auto-updating charts:
Open Interest (BTC) - Total futures positioning and 7-day BTC-denominated change.
Funding Rates - Perpetual futures funding to track long-side or short-side leverage pressure.
Coinbase Premium Index - Coinbase vs global market premium as a proxy for US spot demand pressure.
Exchange Netflow - Net BTC moving to and from exchanges across positive and negative flow regimes.
Derivatives - All funding, open-interest, and leverage charts in one view.