


Bitcoin continues to trade only modestly above the long-term holder cost basis, while the frequency of declines in their supply has fallen close to a minimum. The two charts show both the market valuation and the degree of distribution pressure from LTHs.
TL;DR
Bitcoin trades at 1.30x the LTH cost basis and has remained in the Low Risk zone for 78 consecutive days. At the same time, the amount of Bitcoin held by long-term holders remains near its all-time high, and their supply declined on only 2 of the past 15 days. This points to low distribution pressure from long-term holders, but does not by itself confirm a new demand impulse.
Bitcoin: Long-Term Holder Cost-Basis Multiples
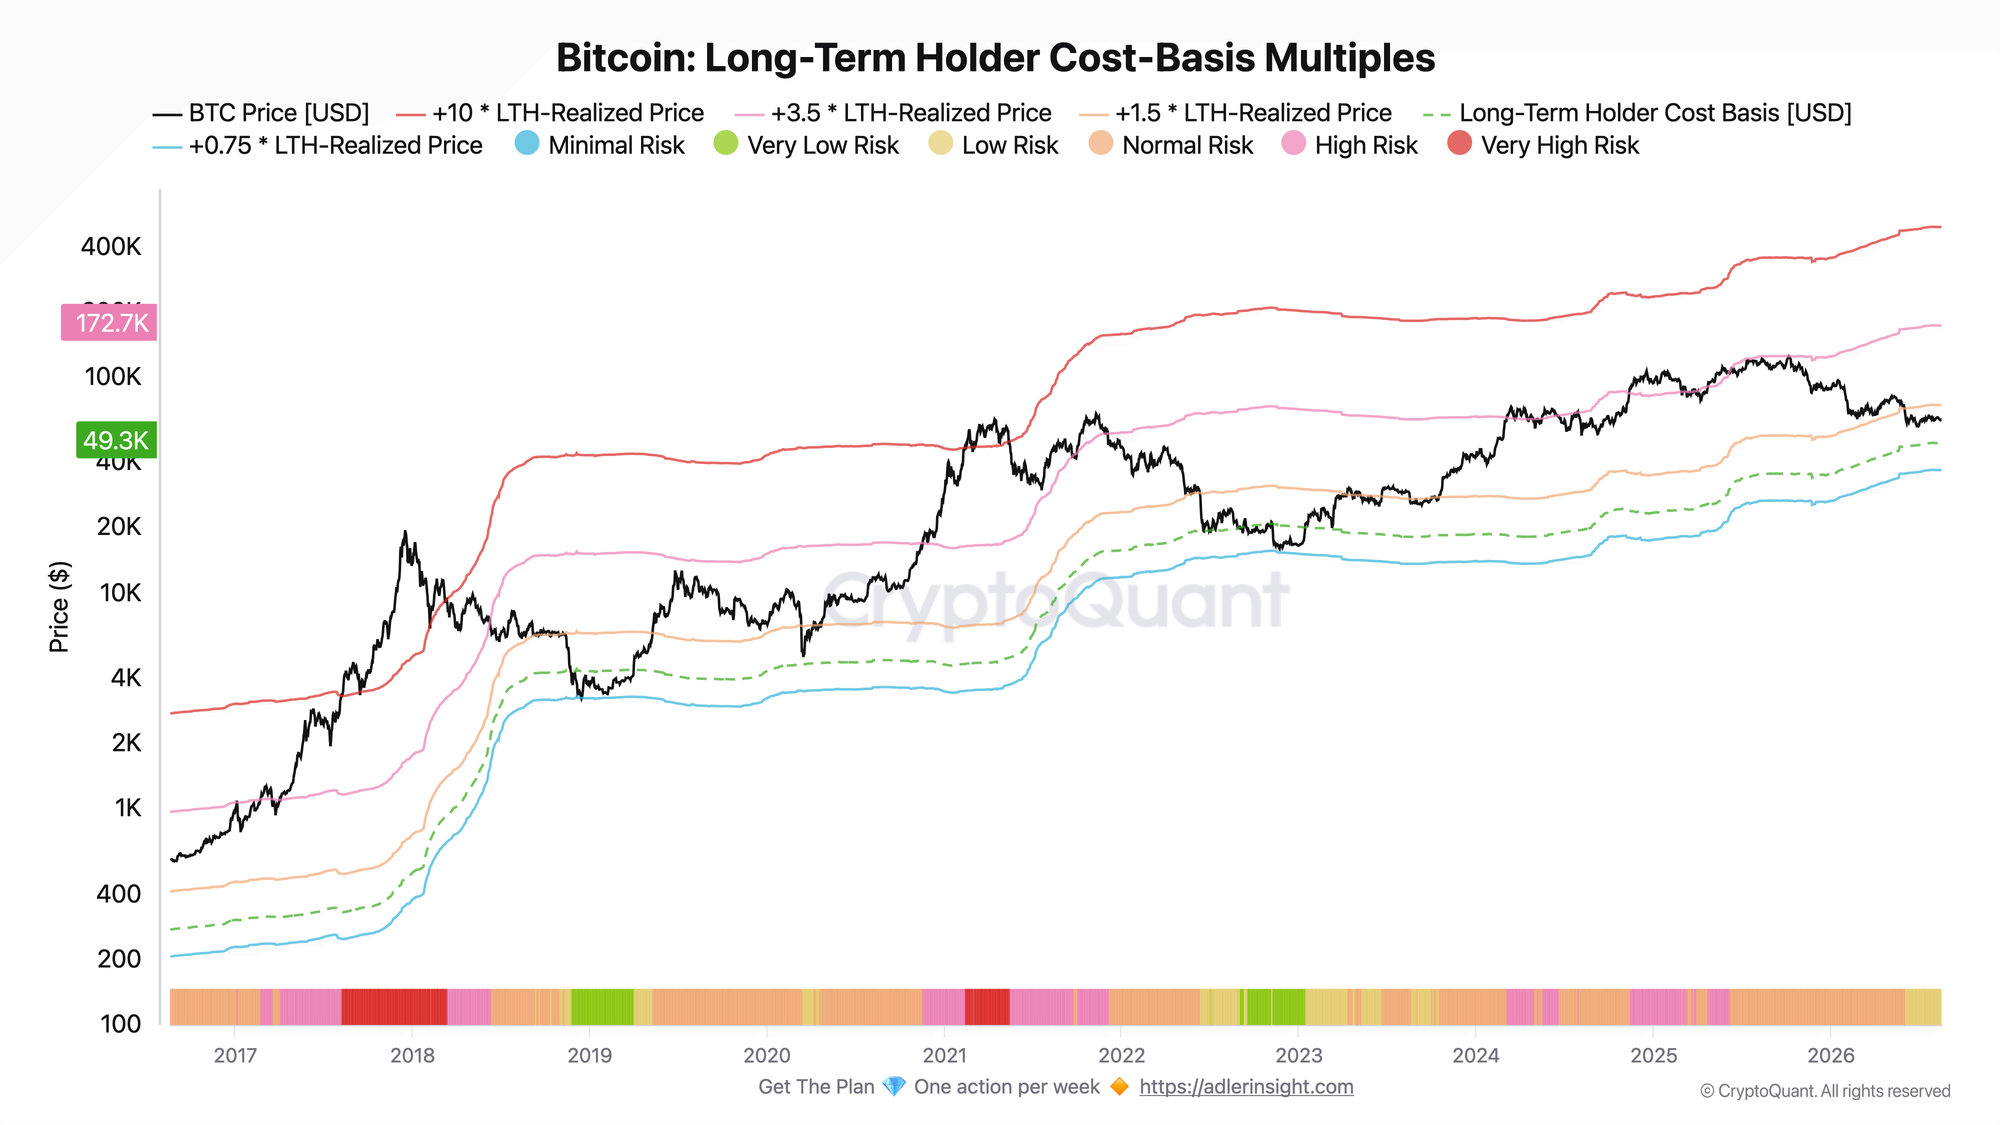
Bitcoin currently trades at $64.2K, while the long-term holder cost basis stands at $49.4K. This corresponds to a 1.30x multiple.
Bitcoin has remained between the LTH cost basis and the 1.5x level for 78 consecutive days. The upper boundary of the current zone is $74.1K, so the model still classifies the market as Low Risk.
These levels need to be interpreted correctly. A move above 1.5x would shift the market from Low Risk to Normal Risk. This would confirm further price expansion relative to the LTH cost basis, but would also make the valuation less cheap.
A drop below $49.4K, by contrast, would put the LTH cohort as a whole into an unrealized loss. From a valuation perspective, this would represent an even lower-risk zone, but from a market-state perspective, it would signal a noticeable increase in stress among long-term holders.
Bitcoin Long-Term Holder Spending Binary Indicator (15D-MA)
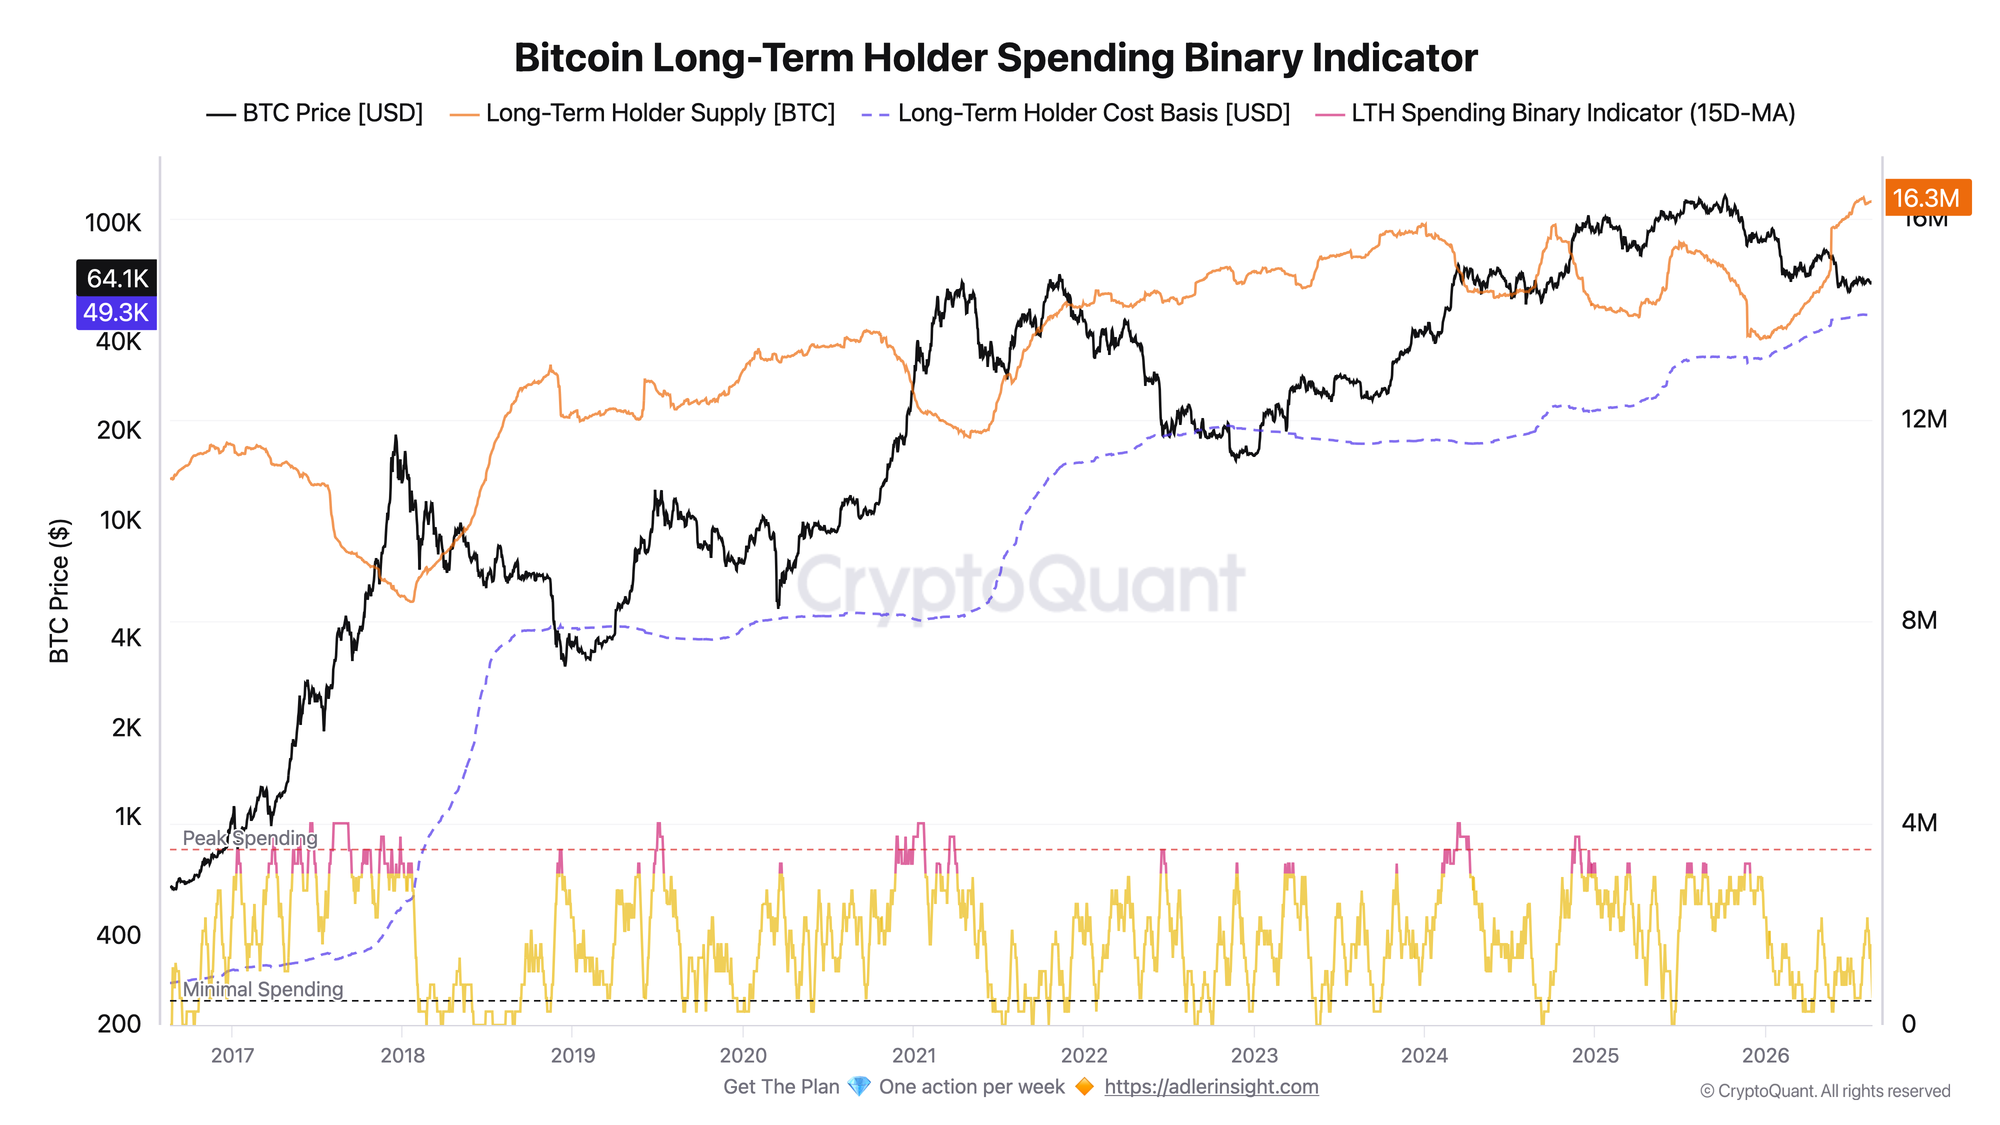
LTH Supply currently stands at 16.35M BTC, only 58K BTC below the all-time high of 16.41M BTC set on July 30. Over the past 90 days, the cohort's supply has increased by 1.38M BTC.
At the same time, the binary indicator has declined sharply. On August 7, LTH Supply had declined on 8 of the previous 15 days. That count has now fallen to only 2 of 15.
This distinction matters: the indicator does not show the volume of BTC sold. It only tracks the days when total LTH Supply was lower than the previous day. Its current reading therefore shows that the frequency of declines in LTH Supply is near its lowest levels.
In other words, there are currently no signs of sustained distribution pressure from long-term holders.
The two charts complement each other. Bitcoin remains in the Low Risk zone relative to the LTH cost basis, while the cohort itself is barely reducing its total supply. This creates a constructive supply structure, but does not separately confirm that demand is already strong enough to drive a new price impulse.
Invest in Bitcoin without emotional decisions - Start free.
Deterministic signals built to remove fear, FOMO, and panic selling.
FAQ
What does a 1.30x multiple relative to the long-term holder cost basis mean? The market price is approximately 30% above the aggregate LTH cost basis. This means the cohort remains in unrealized profit on average, while the price is still in the lower part of the model's historical valuation range.
What does the Spending Binary Indicator show? The indicator shows how often total LTH Supply declined relative to the previous day over the past 15 days. This has occurred on only 2 of the past 15 days.
CONCLUSIONS
Bitcoin trades at $64.2K, or 1.30x above the long-term holder cost basis of $49.4K, and has remained in the Low Risk zone for 78 consecutive days.
At the same time, LTH Supply remains near its all-time high - 16.35M BTC versus a peak of 16.41M BTC - and declined on only 2 of the past 15 days.
The combination of these two signals points to a low valuation relative to the LTH cost basis and weak distribution pressure from long-term holders. This is a constructive supply structure, but not a standalone signal that a new rally has begun. Further improvement in the market structure will require confirmation from demand and price.
Live Charts
Explore the metrics behind this brief with live, auto-updating charts:
Realized Price Bands - Dynamic realized-price valuation zones from live BTC price and on-chain cost basis.
LTH vs STH Supply - Supply split between long- and short-term holders to track accumulation and distribution.
LTH-SOPR - Long-term holder profit/loss realization around the 1.0 breakeven threshold.
Reserve Risk - Long-term holder conviction relative to price to gauge risk/reward at cycle extremes.
Supply in Profit - Share of circulating supply in profit as a cycle-phase and euphoria gauge.