
🎧 Morning Brief 0086 - audio debate on today’s market setup
The market completed a classic cycle: extreme optimism → long overload → cascading liquidation. Two charts show the cause and effect of this move.
TL;DR
Overheated sentiment in the 80% zone ended with a $205M long liquidation cascade and a regime change.
Bitcoin: Advanced Sentiment Index
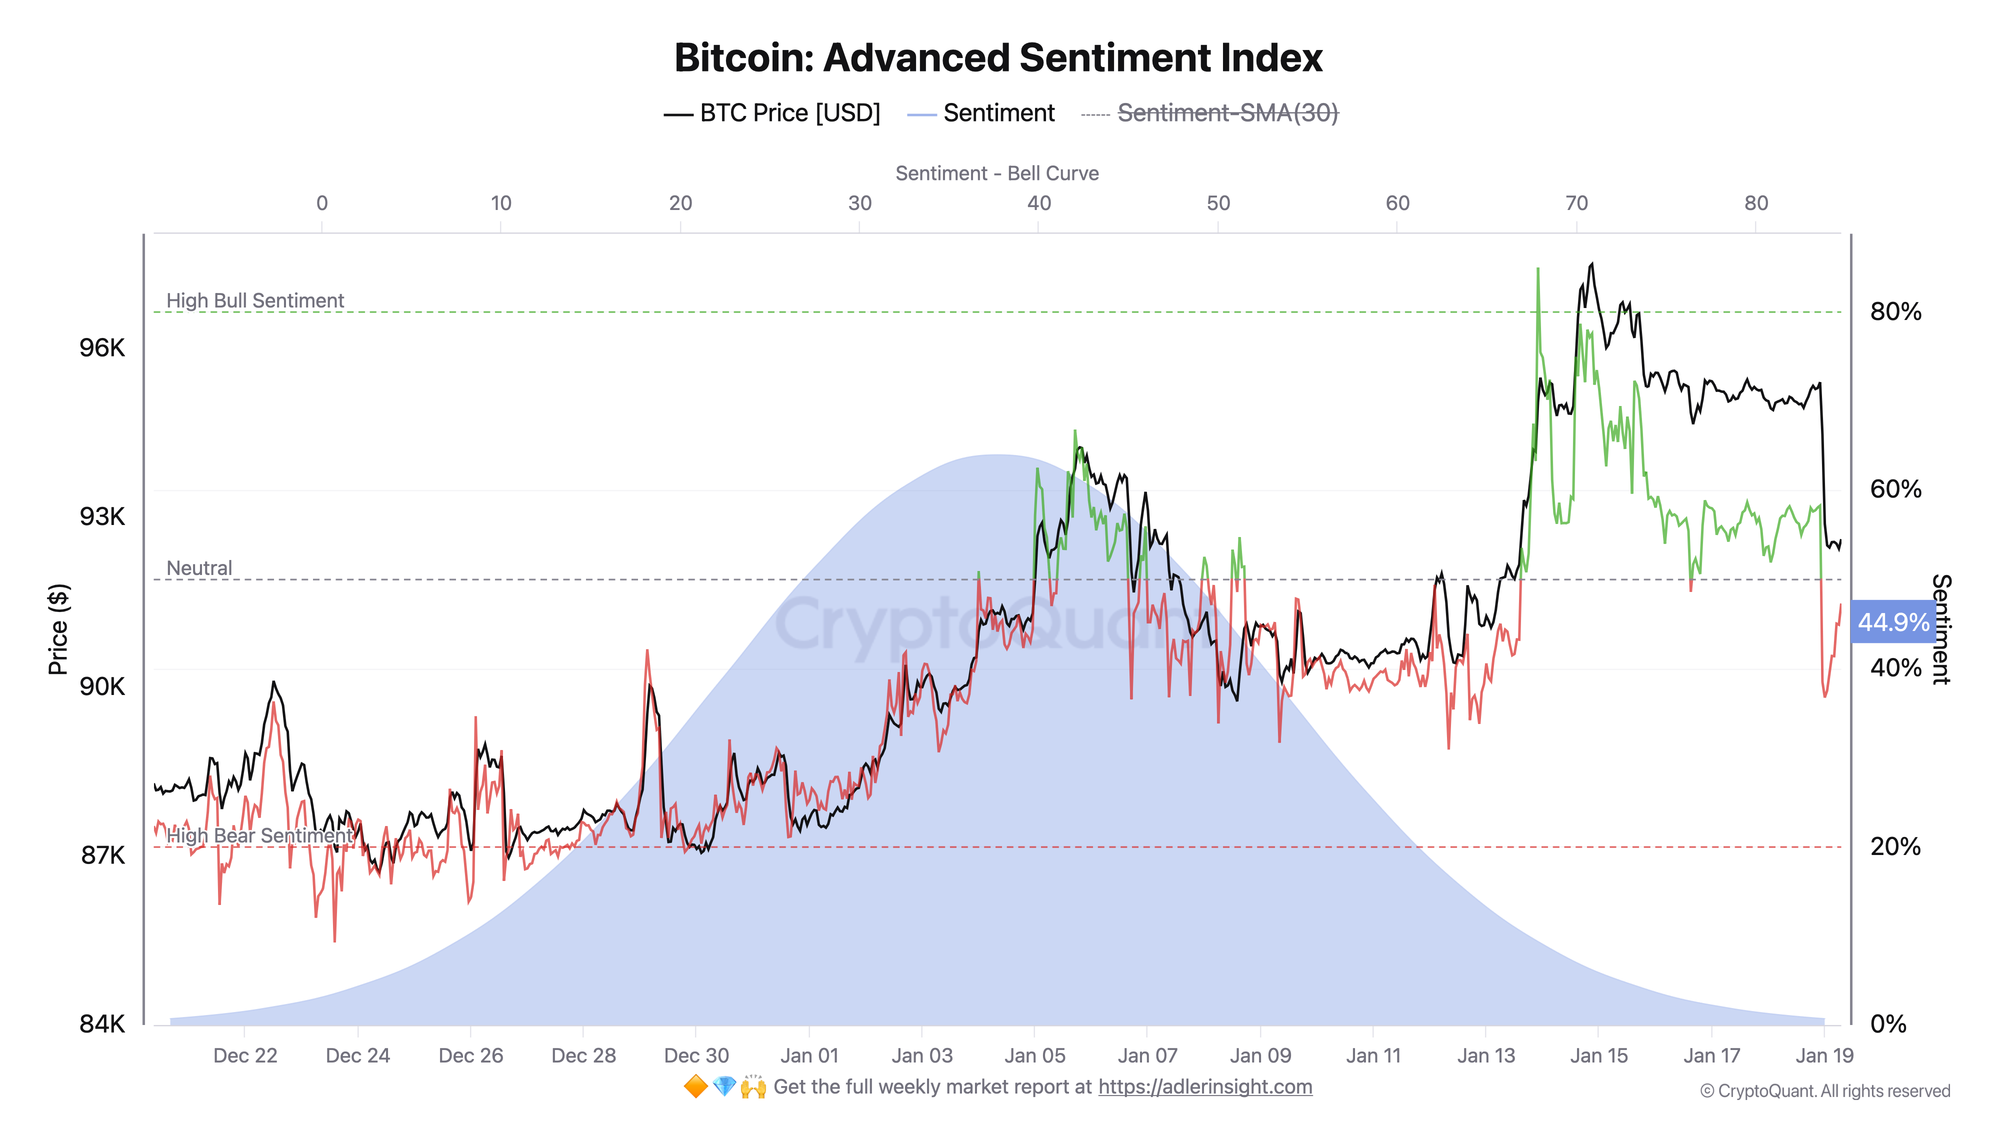
The integrated index combines VWAP, net taker volume, open interest, and volume delta.
Between January 13–15, sentiment reached the extreme bullish zone around 80% - this coincided with the local price high near $97K. Over recent days, the index collapsed to 44.9%, breaking below the neutral 50% level from above.
The break below neutral signals a regime change and deteriorating risk quality. A return above 50% with sustained holding would be the first sign of stabilization; further decline toward the High Bear zone (20%) would open the risk of a deeper correction.
Bitcoin Futures Long, Short Liquidations Dominance
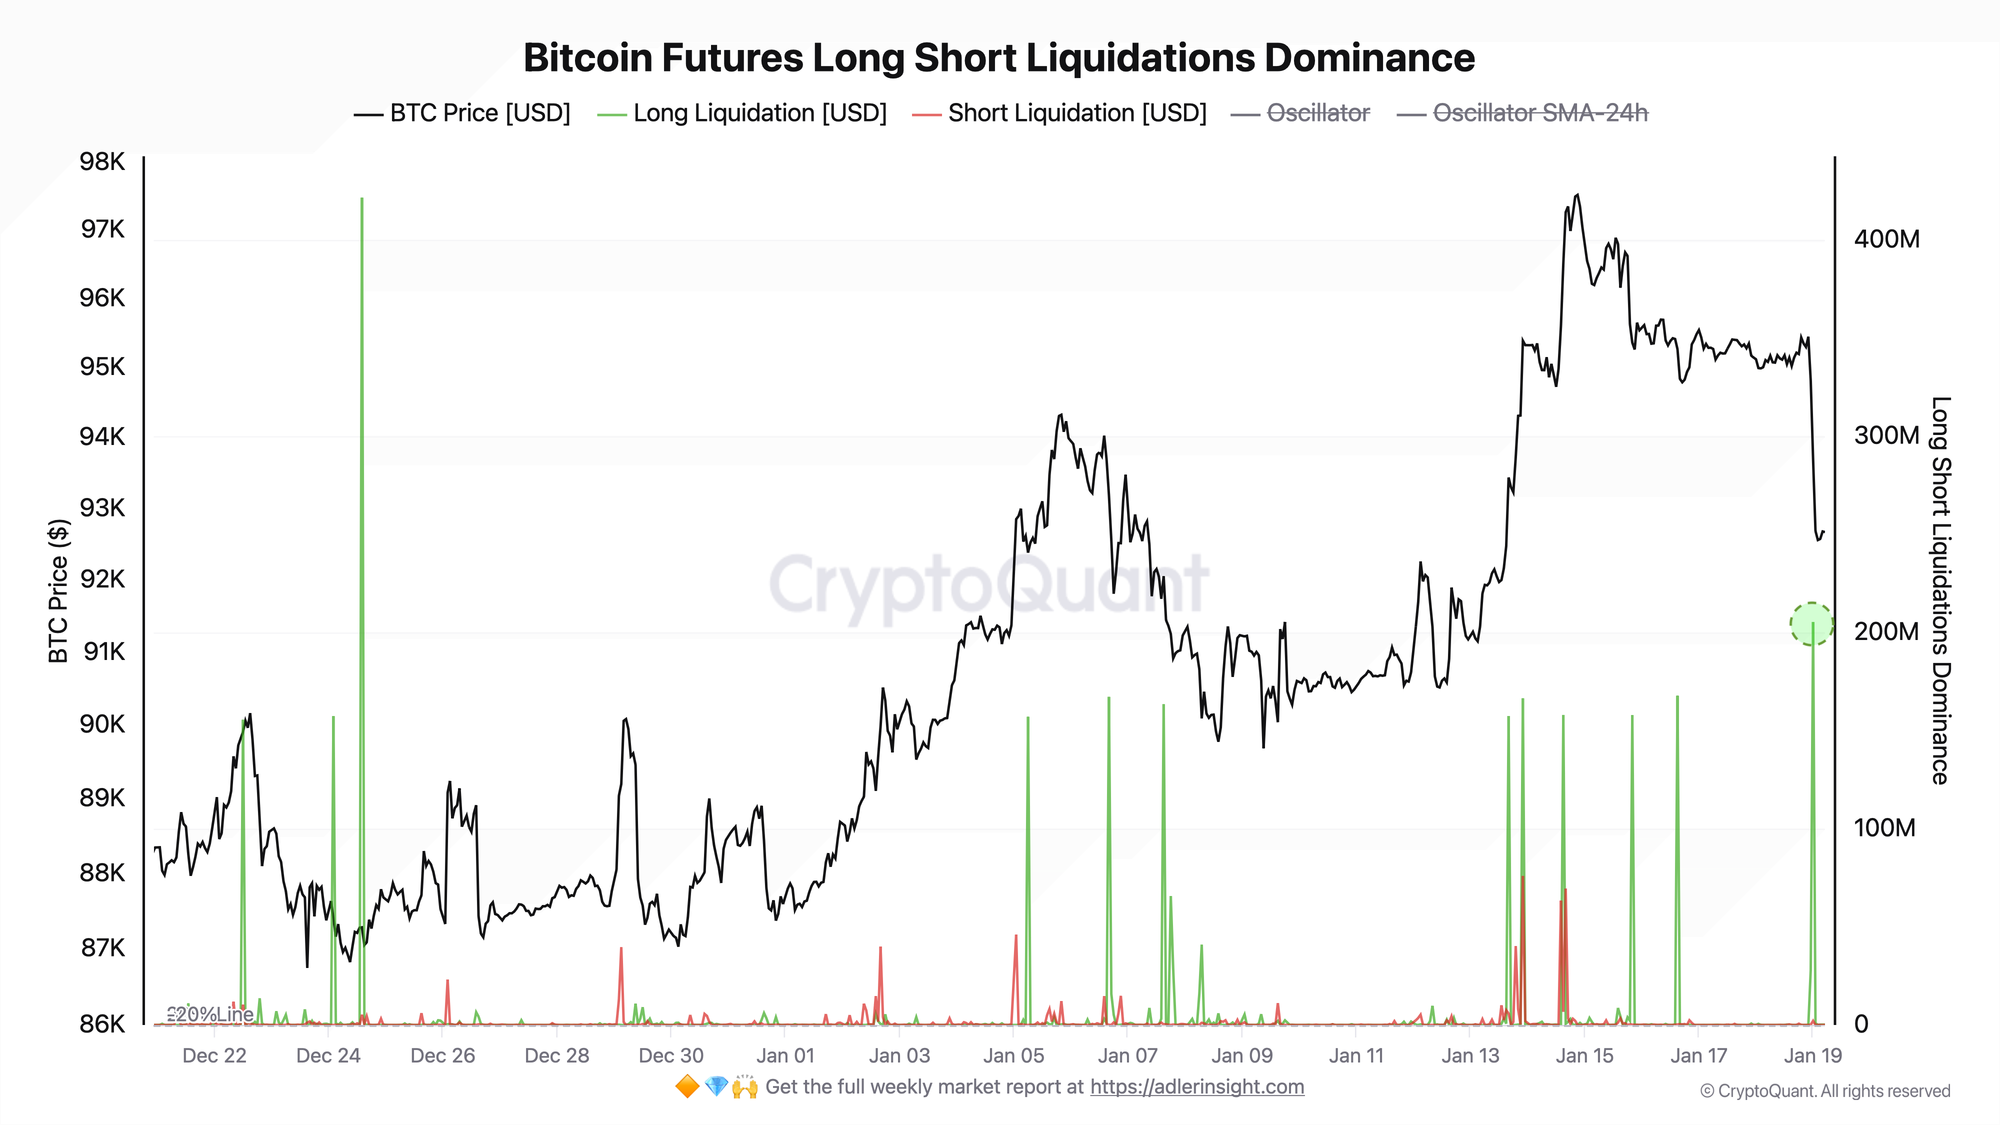
At midnight on January 19, the largest long liquidation cascade over the entire observation period occurred - over $205M in a single hour. The spot oscillator reached +97.96%, indicating near-total dominance of long liquidations. Price dropped from $95.4K to $92.6K within 24 hours.
The liquidation volume indicates forced position closures rather than organic selling. This is a typical "washout" pattern for an overheated market — for a full breakdown of how liquidation cascades develop, see Bitcoin Liquidation Cascade: How It Works and How to Predict It.
The charts form a clear cause-and-effect relationship: extreme sentiment (80%+) on the first chart is the cause of overheating, while $205M in long liquidations on the second chart is the effect. The market completed a structural phase of clearing excess leverage.
Every week I publish one SQL query with a full breakdown of the logic - from raw data to a finished indicator.
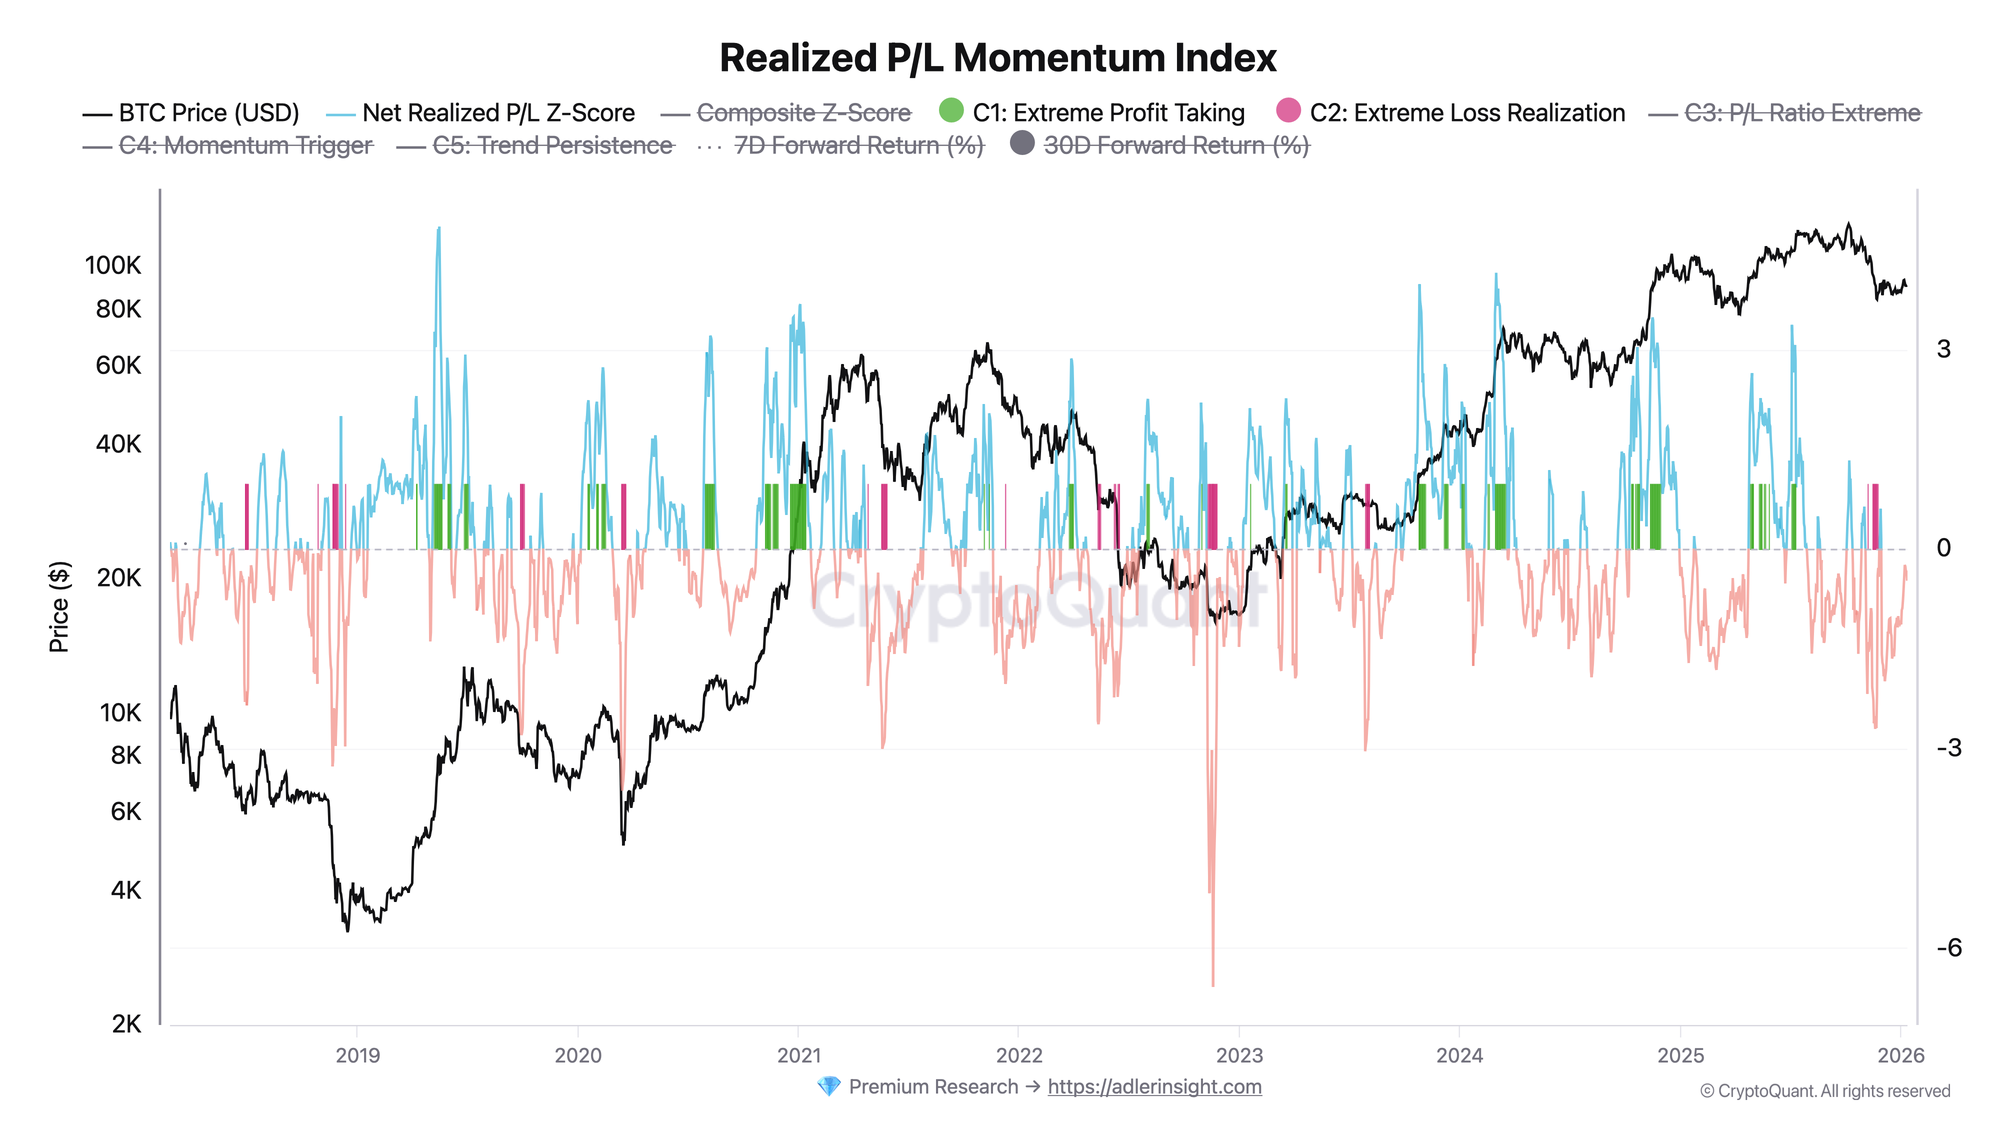
In the latest SQL of the Week 010: Realized P/L Momentum Index, we break down an indicator that measures how extreme the current condition of Short-Term Holders (STH) is relative to their recent baseline.
If you want to go beyond just looking at charts and actually understand where the numbers come from, this is for you.
FAQ
Why was the 24h SMA oscillator negative while price was falling?
The SMA is a lagging indicator - it averaged data from the previous 24 hours when short liquidations dominated. The spot oscillator at the time of the cascade showed +97% - that's what reflects current dynamics.
What sentiment level would signal a reversal?
A sustained return above 50% with confirmation on the SMA-30 would indicate stabilization. A decline below 30% marks a capitulation zone, historically attractive for medium-term buying.
CONCLUSIONS
The market completed a classic deleveraging cycle: bullish euphoria with sentiment at 80%+ led to accumulation of overheated long positions, the correction triggered a $205M+ liquidation cascade — driven by extreme open interest and leverage buildup (see Bitcoin OpenInterest & Leverage Ratio Guide)
- and sentiment collapsed below neutral to 44.9%. Current regime is neutral with a cautious risk-off tilt. Improvement trigger: sentiment returning above 50% with no new liquidation waves. Key risk: continued sentiment decline toward the 20–30% zone would open the path to test $90K support.