
🎧 Morning Brief #143 - audio debate on today’s market setup
Against the backdrop of a local ceasefire in the Middle East, BTC recovered sharply, and futures sentiment exited the local pressure zone. However, the price structure has only approached the neutral zone so far, meaning the market looks better in terms of flow and sentiment than in terms of confirmed technical base.
TL;DR
Over the past three days, futures sentiment reversed upward, but the price structure is still catching up to this shift. The market has grown stronger, but a full confirmation of the reversal has not yet been received.
Bitcoin Futures Advanced Sentiment Index
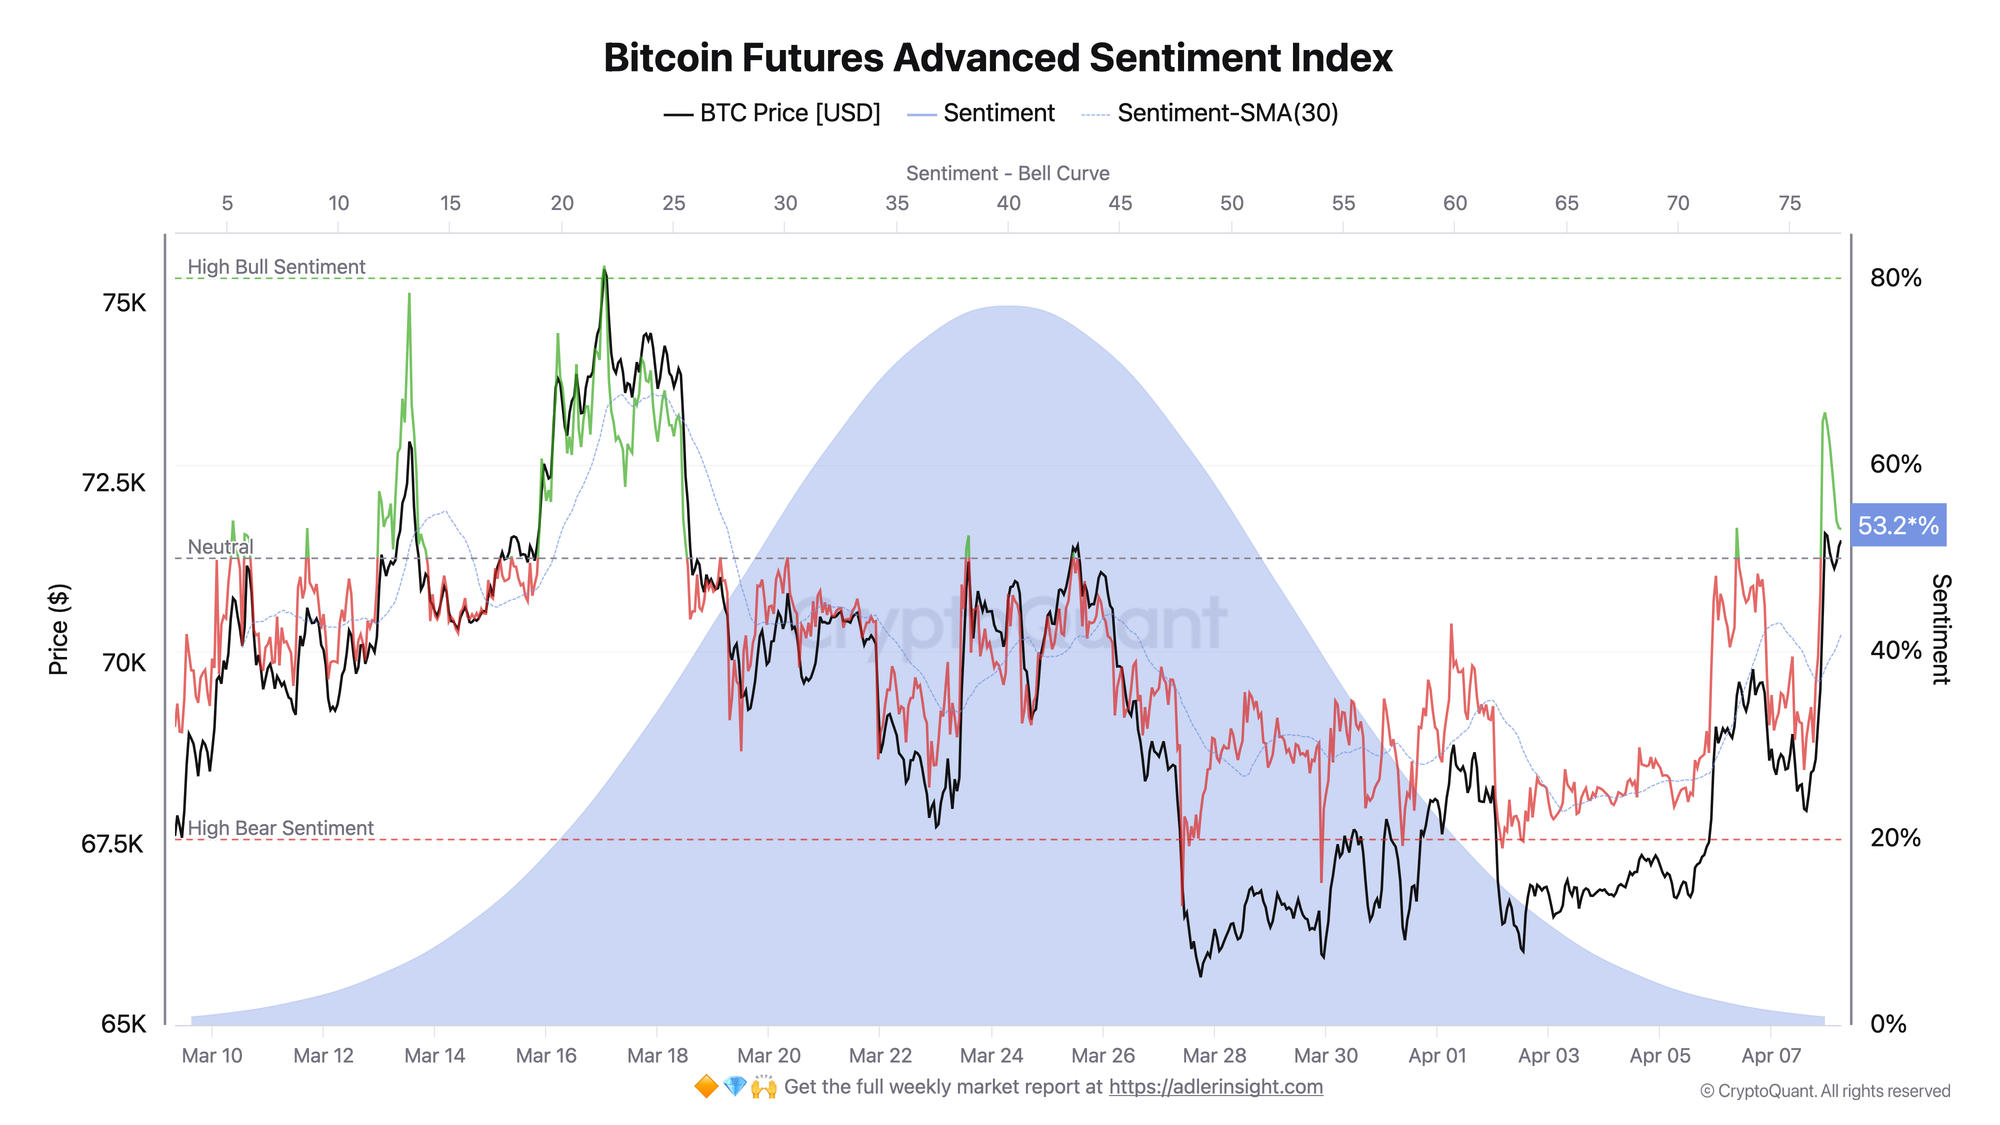
The metric combines price, taker flow, open interest, and signed volume delta into a single futures sentiment index.
Over the past three days, price rose from approximately $66.8K to $71.7K, while the index itself climbed from 23.4 to 53.1. This was not simply a price rally - it was a full flow reversal: the derivative components of the index moved upward alongside the market. At the same time, the local peak was already above the current value - sentiment reached 65.6, after which some momentum cooled, although the 30-hour smoothing continued to rise and is currently holding around 41.8.
This means the market exited pressure mode in a short period of time and transitioned into a mode of active risk appetite recovery. But the final hours already show not acceleration, but cooling after a strong push, so continuation requires not just elevated sentiment, but sustained holding of that level without a sharp pullback.
Bitcoin Price Structure
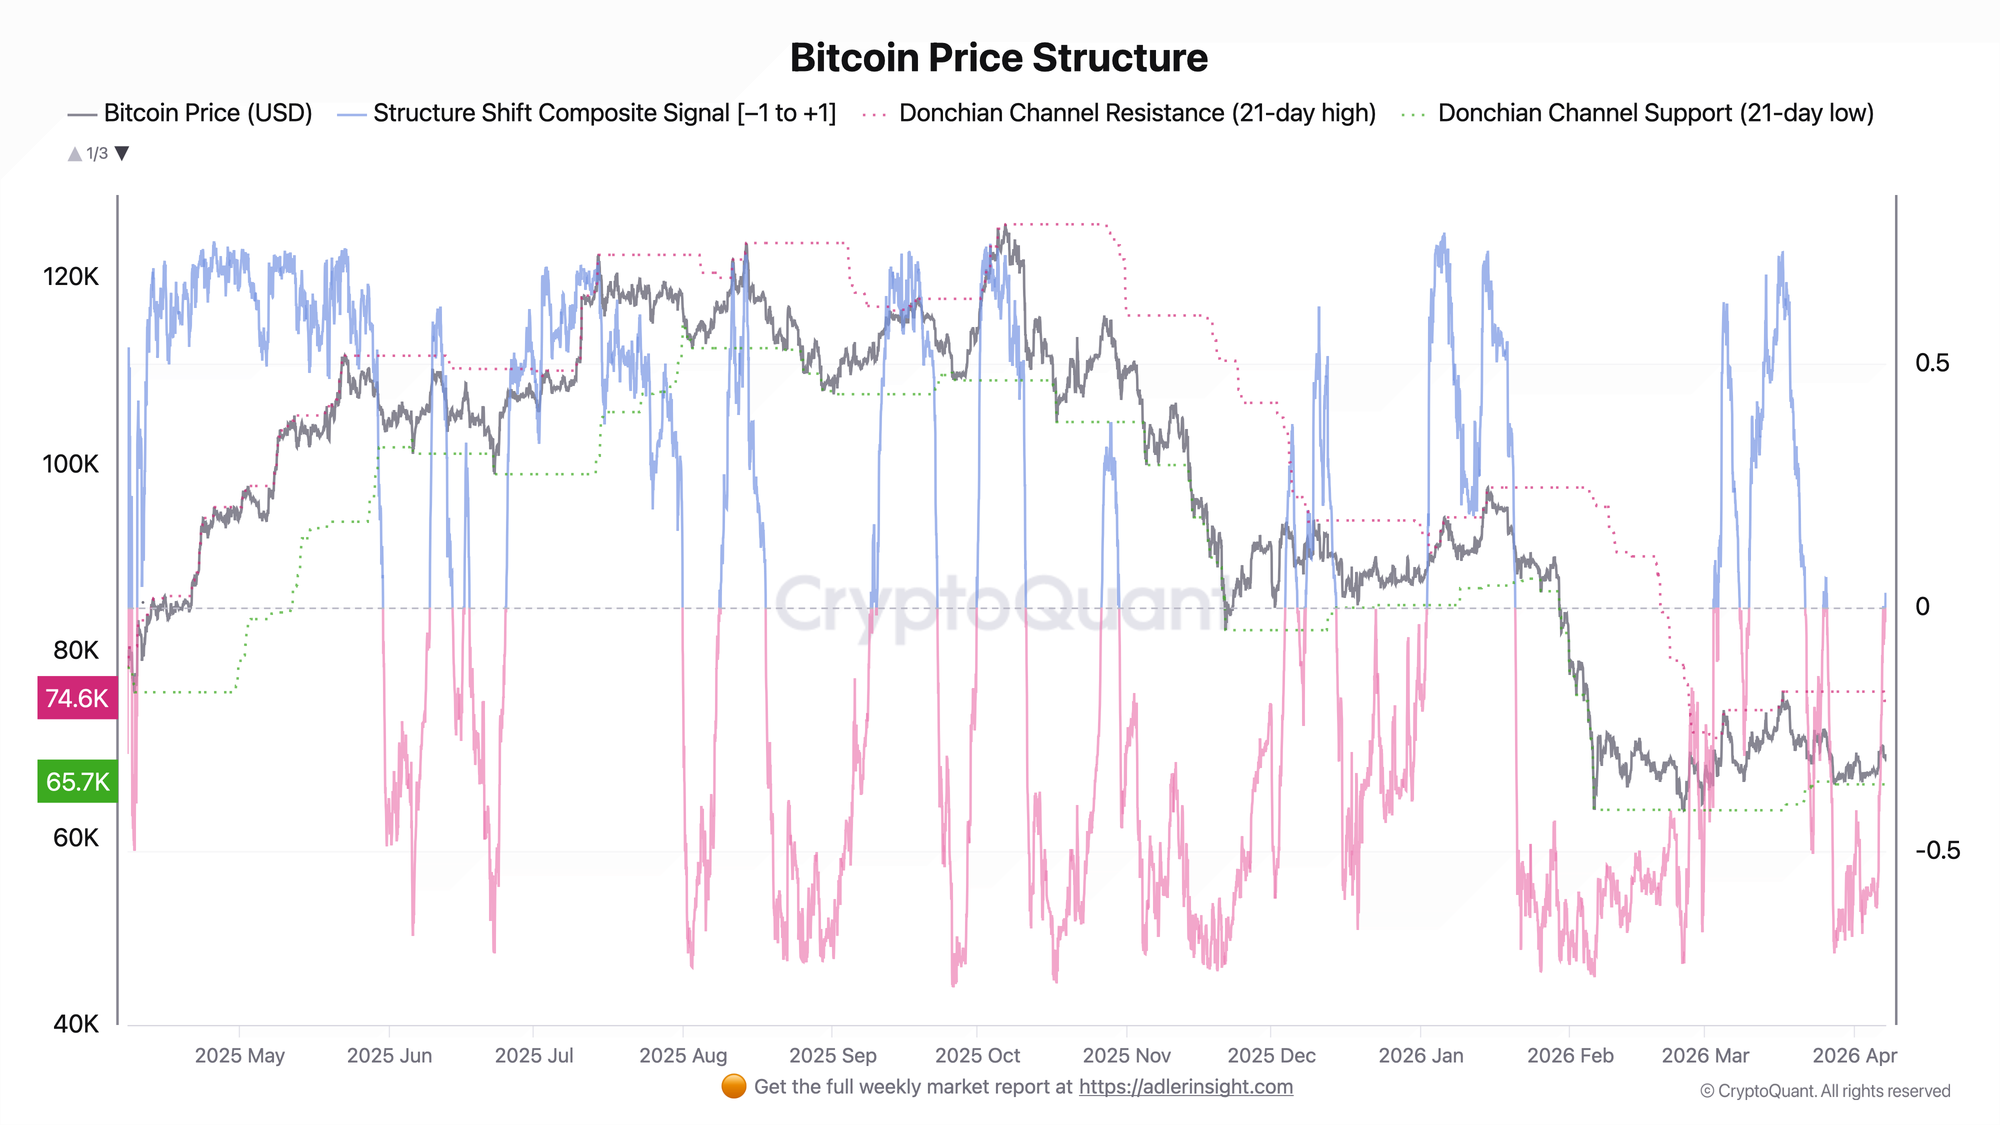
The metric shows the position of price within a 21-day channel and the composite signal of the structure.
Here the picture has improved, but noticeably less so than in derivatives. The Structure Shift Composite Signal rose from -0.58 to -0.03, meaning the market moved from a confidently negative structure to neutral. Price is still at 29% of its 21-day channel range, meaning the recovery is still progressing within the lower part of the range, not at its upper boundary.
This means the structure has stopped deteriorating and has cleared noticeably, but has not yet transitioned into a mode of sustained confirmation. For a genuine reversal, the market needs not just to hold above the medium-term EMA, but to consolidate a positive structural signal and advance higher within the channel - otherwise the current rally will remain nothing more than a bounce within the range.
Together, these two charts say the following: the derivative block reversed faster than the price structure itself. This is a good sign for short-term recovery, but not final proof that the market has already entered a sustained growth phase.
🟠 Outperform Buy & Hold with a rules-based strategy - Start free. One weekly action, clear triggers and invalidation levels. No guessing.
FAQ
What is the main thing that changed over the past three days? The main change is that the market has stopped looking one-sidedly weak. Flow and sentiment in futures improved sharply, and the price structure has stopped being deeply negative and has nearly returned to neutral.
What will confirm a full regime change? Confirmation will not be the bounce itself, but continued structural improvement: sustained positive momentum, consolidation of the composite signal above zero, and price advancing higher within the 21-day channel. If this does not happen, the current shift may remain a local spike following oversold conditions.
CONCLUSIONS
Over the past three days the market has recovered noticeably in futures sentiment and partially recovered in price structure, so the overall regime can now be described as neutral with a clear improvement. The main trigger ahead is the transition of the price structure into a sustainably positive zone with further price advancement within the channel, and the main risk is that derivative optimism has already accelerated more than the underlying market structure, in which case this impulse will again run into a local downward rejection.
Further Reading
Bitcoin Funding Rates: Definition, Formula & Cycle Signals A breakdown of how funding rates work in perpetual futures markets, what elevated or negative readings signal, and how to use them as a sentiment indicator across Bitcoin market cycles.
Bitcoin Open Interest & Leverage Ratio An explanation of open interest as a measure of active derivative exposure, how the leverage ratio contextualizes it against market cap, and what rising or falling OI tells you about positioning risk.
Bitcoin Open Interest and Funding Rate: The Combined Framework for Reading Derivatives Markets A unified framework for reading OI and funding rate together - covering the four key combination patterns and how to interpret divergences between price, positioning, and sentiment.
Bitcoin Open Interest vs Price: 4 Divergence Patterns Every Trader Must Know A practical guide to the four core OI-vs-price divergence patterns, what each signals about the strength or fragility of a move, and how to apply them to real market conditions.
Bitcoin Liquidation Cascade: How It Works, Why It Happens & How to Predict It A detailed look at how overleveraged positioning triggers cascading liquidations, why they amplify volatility, and what on-chain and derivatives data can help anticipate them in advance.