
🎧 Morning Brief #101 - audio debate on today’s market setup
Following Friday's crash, Bitcoin recorded the maximum drawdown of the current cycle at -46% from the October peak of $124,450. The bear market that started in November 2025 has transitioned into a qualitatively new stage. Two key charts show that the drawdown has accelerated to levels characteristic of mature correction phases, while price tests the critical 1.25x Realized Price level.
TL;DR
The bear market ongoing since November 2025 has entered a deep phase after Friday's crash with a -46% drawdown. Price has approached the 1.25x Realized Price Band, which historically served as the boundary between correction and capitulation.
Bitcoin Bear Market Correction Drawdowns
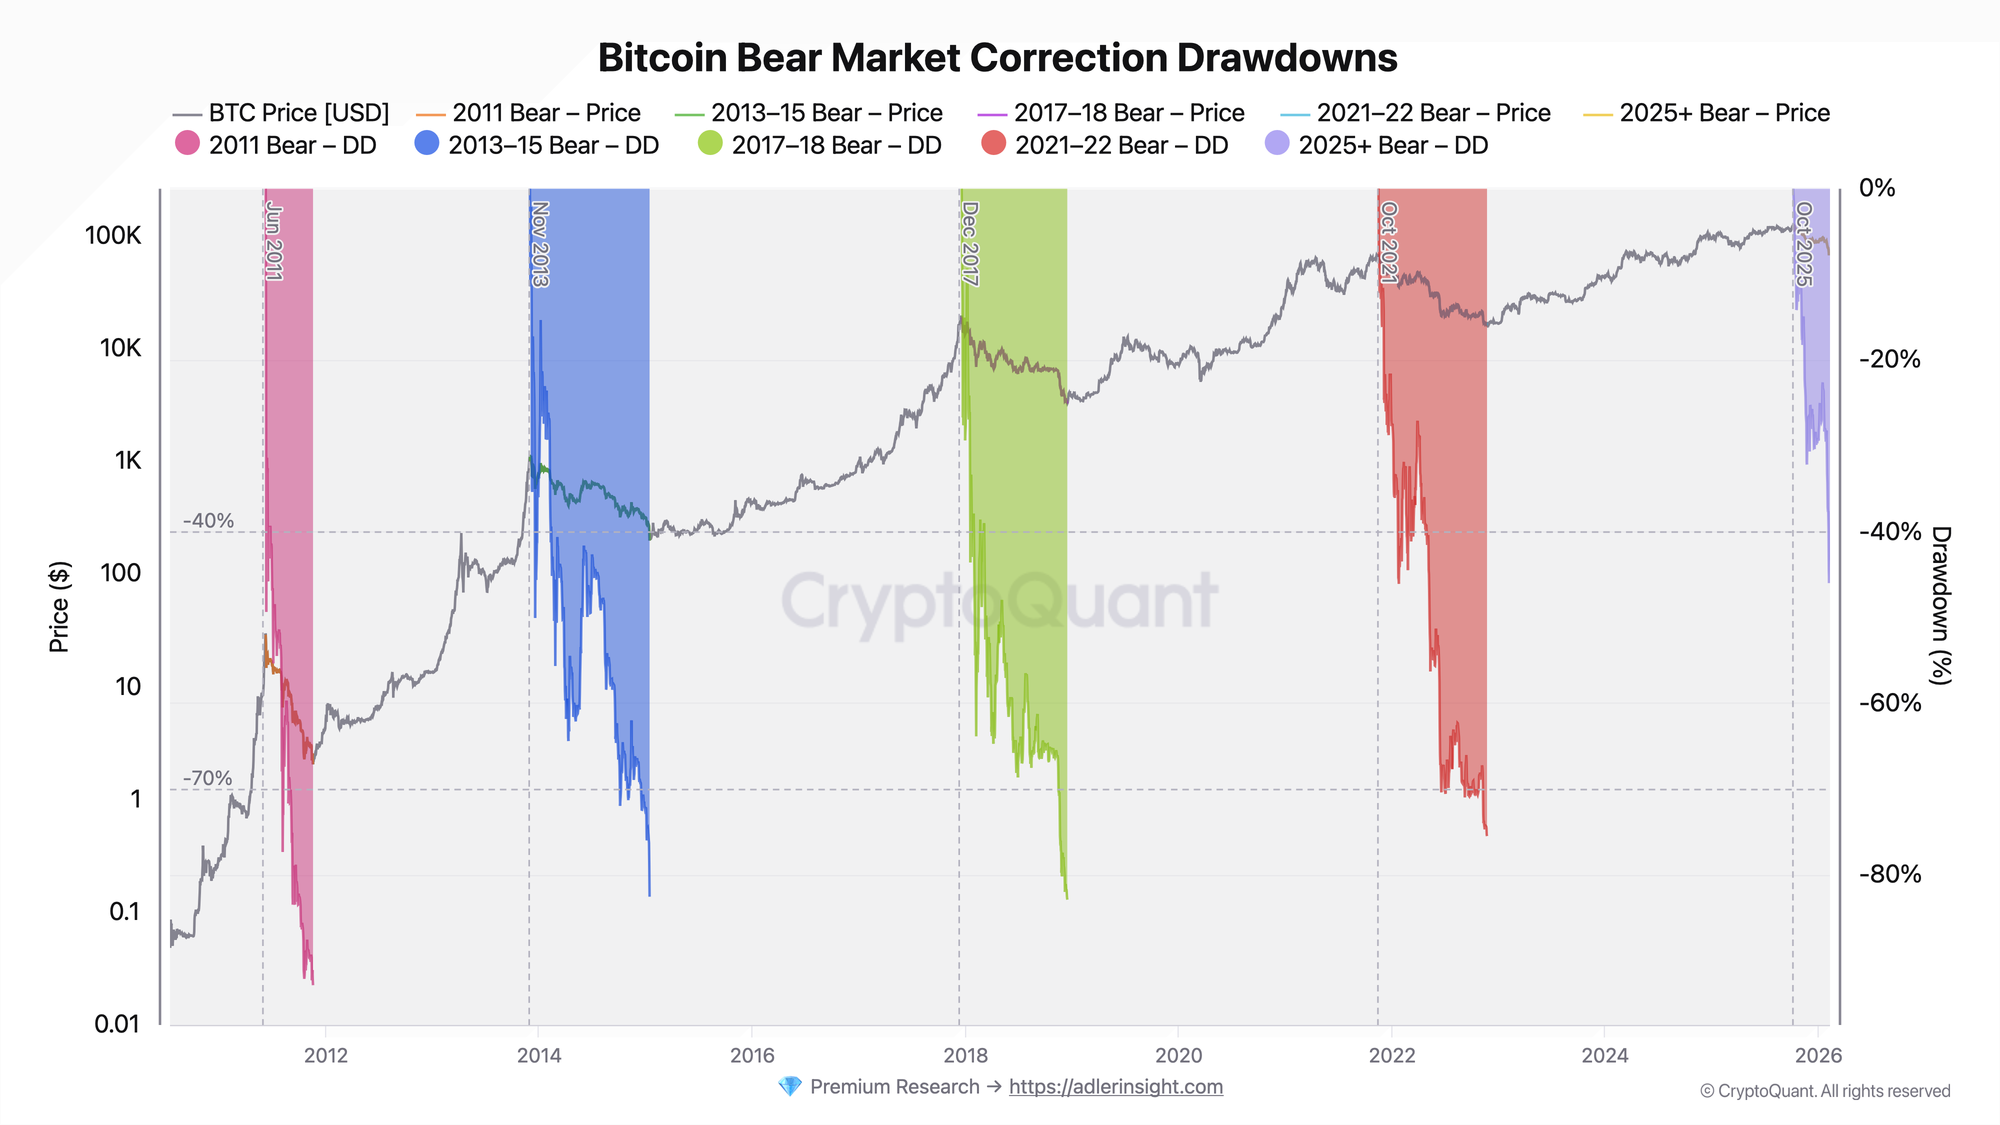
The metric displays the percentage drawdown from the local ATH for each bear cycle in Bitcoin history on a logarithmic price scale.
The current bear cycle started from the $124,450 peak in October 2025. By November, the market transitioned into a sustained decline phase, and over three months the correction traveled from moderate -20/-30% to aggressive -46%. In the last week alone, the drawdown accelerated from -28% (January 28) to -46% (February 6). As of February 9, price has partially recovered to ~$70,700 (drawdown -43%). Historically, bear markets of 2011 and 2013-2015 reached drawdowns of -93% and -83% respectively, the 2017-2018 cycle reached -83%, and 2021-2022 reached -76%.
Three months of continuous decline with increasing momentum indicate that the market has transitioned from the initial correction phase into a deep phase. If the drawdown stabilizes in the -40/-50% range, this will mean the ETF era is indeed softening cycles. A move below -50% opens the path to a classic bear market scenario with targets of -60/-70%. Key trigger: the ability of price to hold above $62,000-65,000.
Bitcoin Realized Pricing Bands
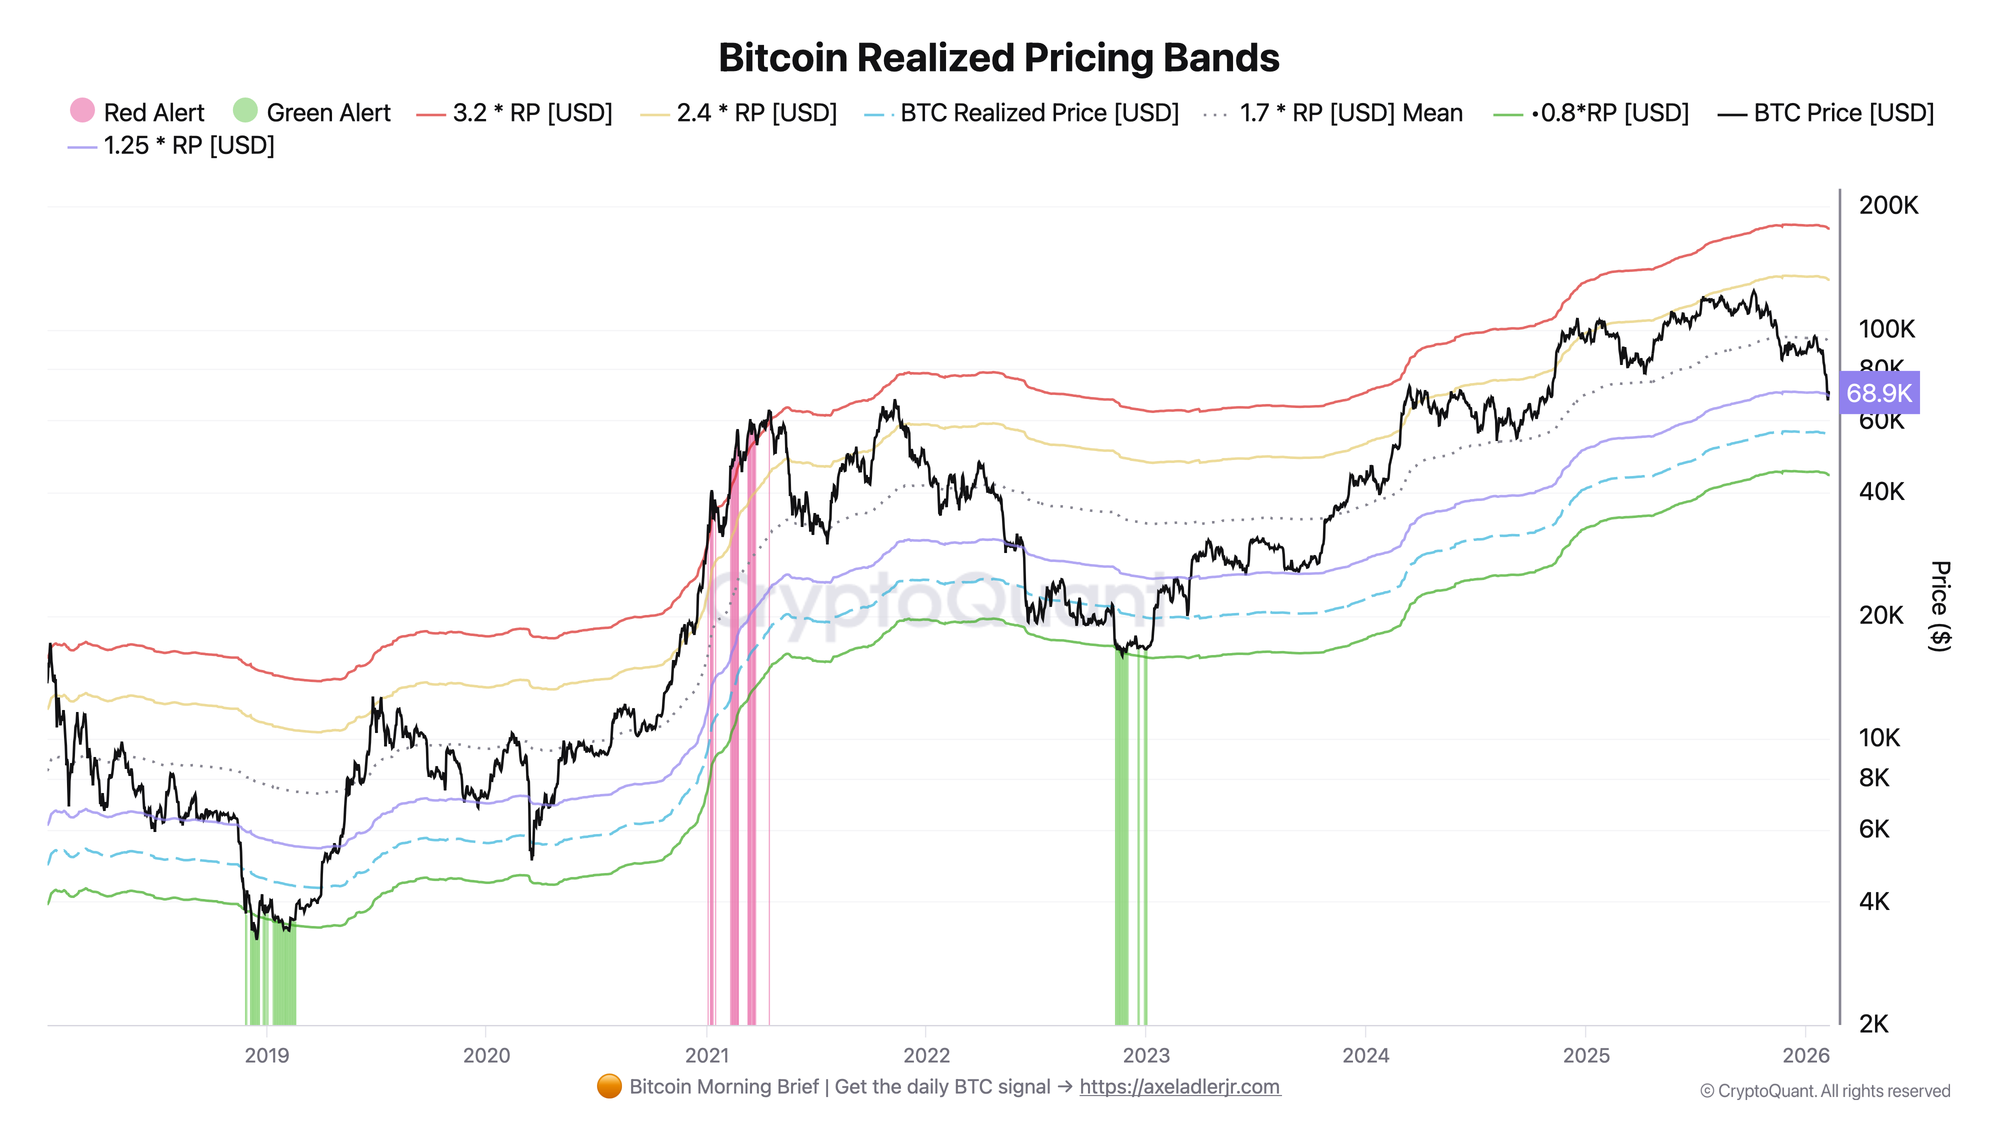
The metric shows Bitcoin price relative to Realized Price and its multipliers (0.8x, 1.25x, 1.7x Mean, 2.4x, 3.2x), forming overbought and oversold zones.
Current price ~$70,700 trades at a 1.28x coefficient to Realized Price ($55,179). This means price is practically touching the 1.25x RP band (~$68,973), which historically served as a key support zone for bull trends and the first line of defense before transitioning into deep capitulation mode. For comparison: at the 2021 peak, price reached the Red Alert zone above 3.2x RP, and during the 2022 capitulation it dropped below Realized Price itself.
Holding above 1.25x RP (~$69,000) is critically important for maintaining constructive market structure. A breakdown of this level will bring price into the zone between Realized Price ($55,000) and 1.25x RP, which historically corresponded to a deep bear market with high probability of further capitulation. Friday's low of $67,208 already briefly broke this boundary, which is a serious warning signal.
Both charts confirm the overall picture: the bear market developing since November has entered a deeper correction phase zone. The -46% drawdown and test of the 1.25x Realized Price band coincided in time, but a bounce within a bear market does not mean trend reversal: this is rather a pause before the next stage, and the key question remains whether price can establish itself above 1.25x RP or selling pressure will resume.

FAQ
How dangerous is the current -46% drawdown in historical context?
In previous cycles, a -40/-50% drawdown was an intermediate phase followed by deepening to -70/-80%. The fundamental difference of the current cycle: the presence of institutional ETF flows and changed holder structure, which theoretically may limit correction depth. However, three months of continuous decline and Friday's crash showed that even in the ETF era aggressive selloffs are possible.
What level will trigger the transition to capitulation phase?
A sustained break of the 1.25x Realized Price band (~$69,000) and consolidation below it will shift the market into a mode historically associated with prolonged capitulation. In drawdown terms, passing the -50% mark (~$62,000 level) will confirm that the current cycle is developing according to a classic bear scenario rather than a shortened ETF-era correction.
CONCLUSIONS
The bear market ongoing since November 2025 has entered a deep phase after Friday's crash: drawdown reached -46%, and price briefly broke the 1.25x Realized Price zone. Two signals combined indicate serious deterioration of market structure. Regime: risk-off, deep bear market phase. Main trigger for assessment change: sustained return above $80,000 (drawdown less than -35%) and consolidation above 1.7x RP Mean (~$94,000). Main risk: loss of the $69,000 level (1.25x RP) on weekly close, which would open the path to testing Realized Price itself ($55,000) and deepening drawdown to -55/-60%.