
🎧 Morning Brief #0095 - audio debate on today’s market setup
The derivatives market showed a cascade of forced closures: over the past 24 hours, long liquidations reached extreme levels amid a sharp price drop to $82.9K. At the same time, Funding Rate remains in positive territory, which may indicate sustained demand for long exposure and incomplete deleveraging.
TL;DR
Long liquidations dominated: 96.7%, oscillator at extreme; 30D SMA = 31.4%. Funding remains positive: 43.2% annualized, demand for long exposure is not broken - risk of repeated squeeze on new downside impulses persists.
Bitcoin Futures Long, Short Liquidations Dominance
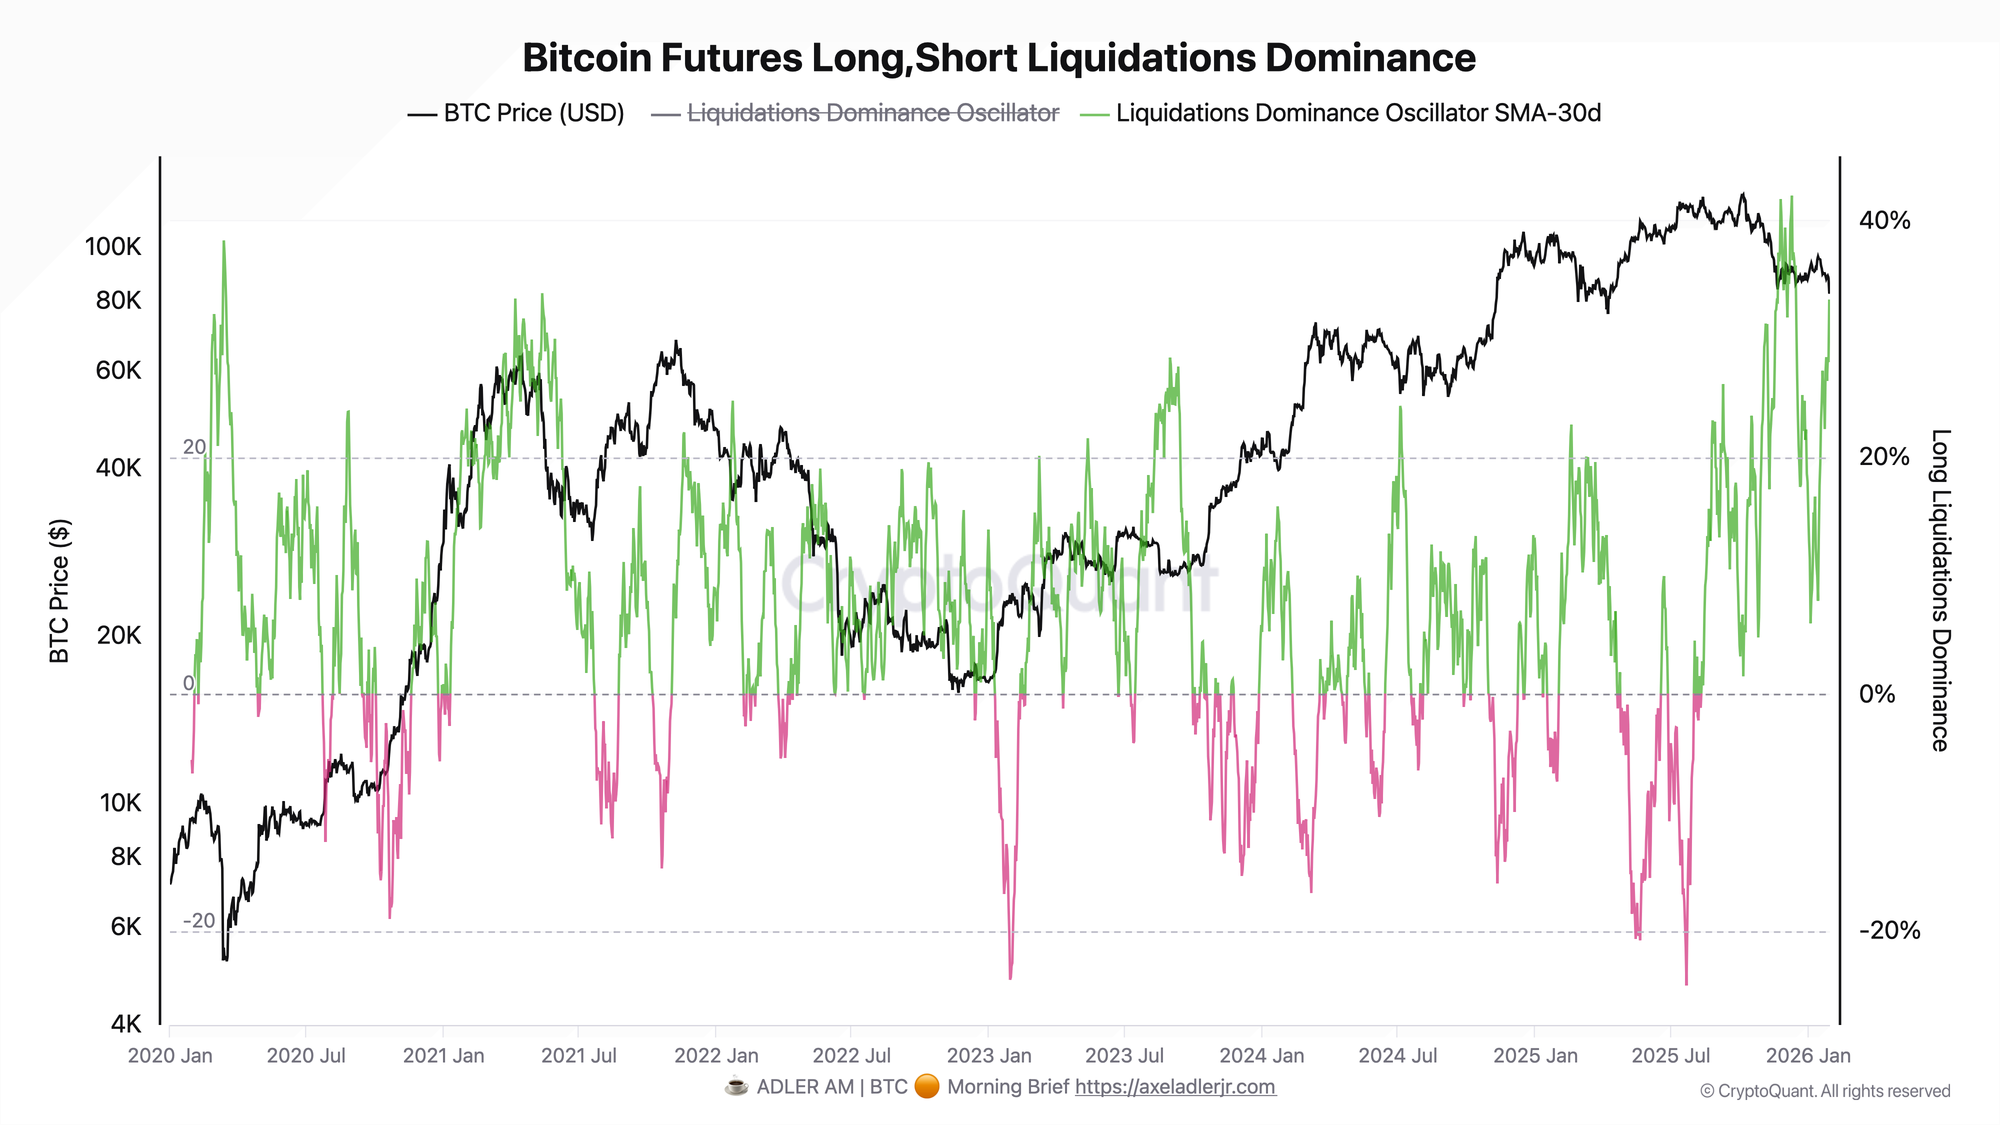
The oscillator measures the balance between liquidations of long and short positions:
- values above 0 indicate predominance of long liquidations,
- values below 0 indicate predominance of short liquidations.
Yesterday the oscillator reached 97%, and the 30-day moving average rose to 31.4%. This level means that virtually all forced closures were on long positions, and pressure on buyers has been systematic throughout the past month.
Oscillator extremes often coincide with the culmination of forced selling and can lead to short-term stabilization. However, this is not a reversal signal without confirmations - for a sustainable "local bottom" scenario, it is important to see at least normalization of the oscillator to zero or a decline in the 30-day average.
Bitcoin Perpetual Funding Rates
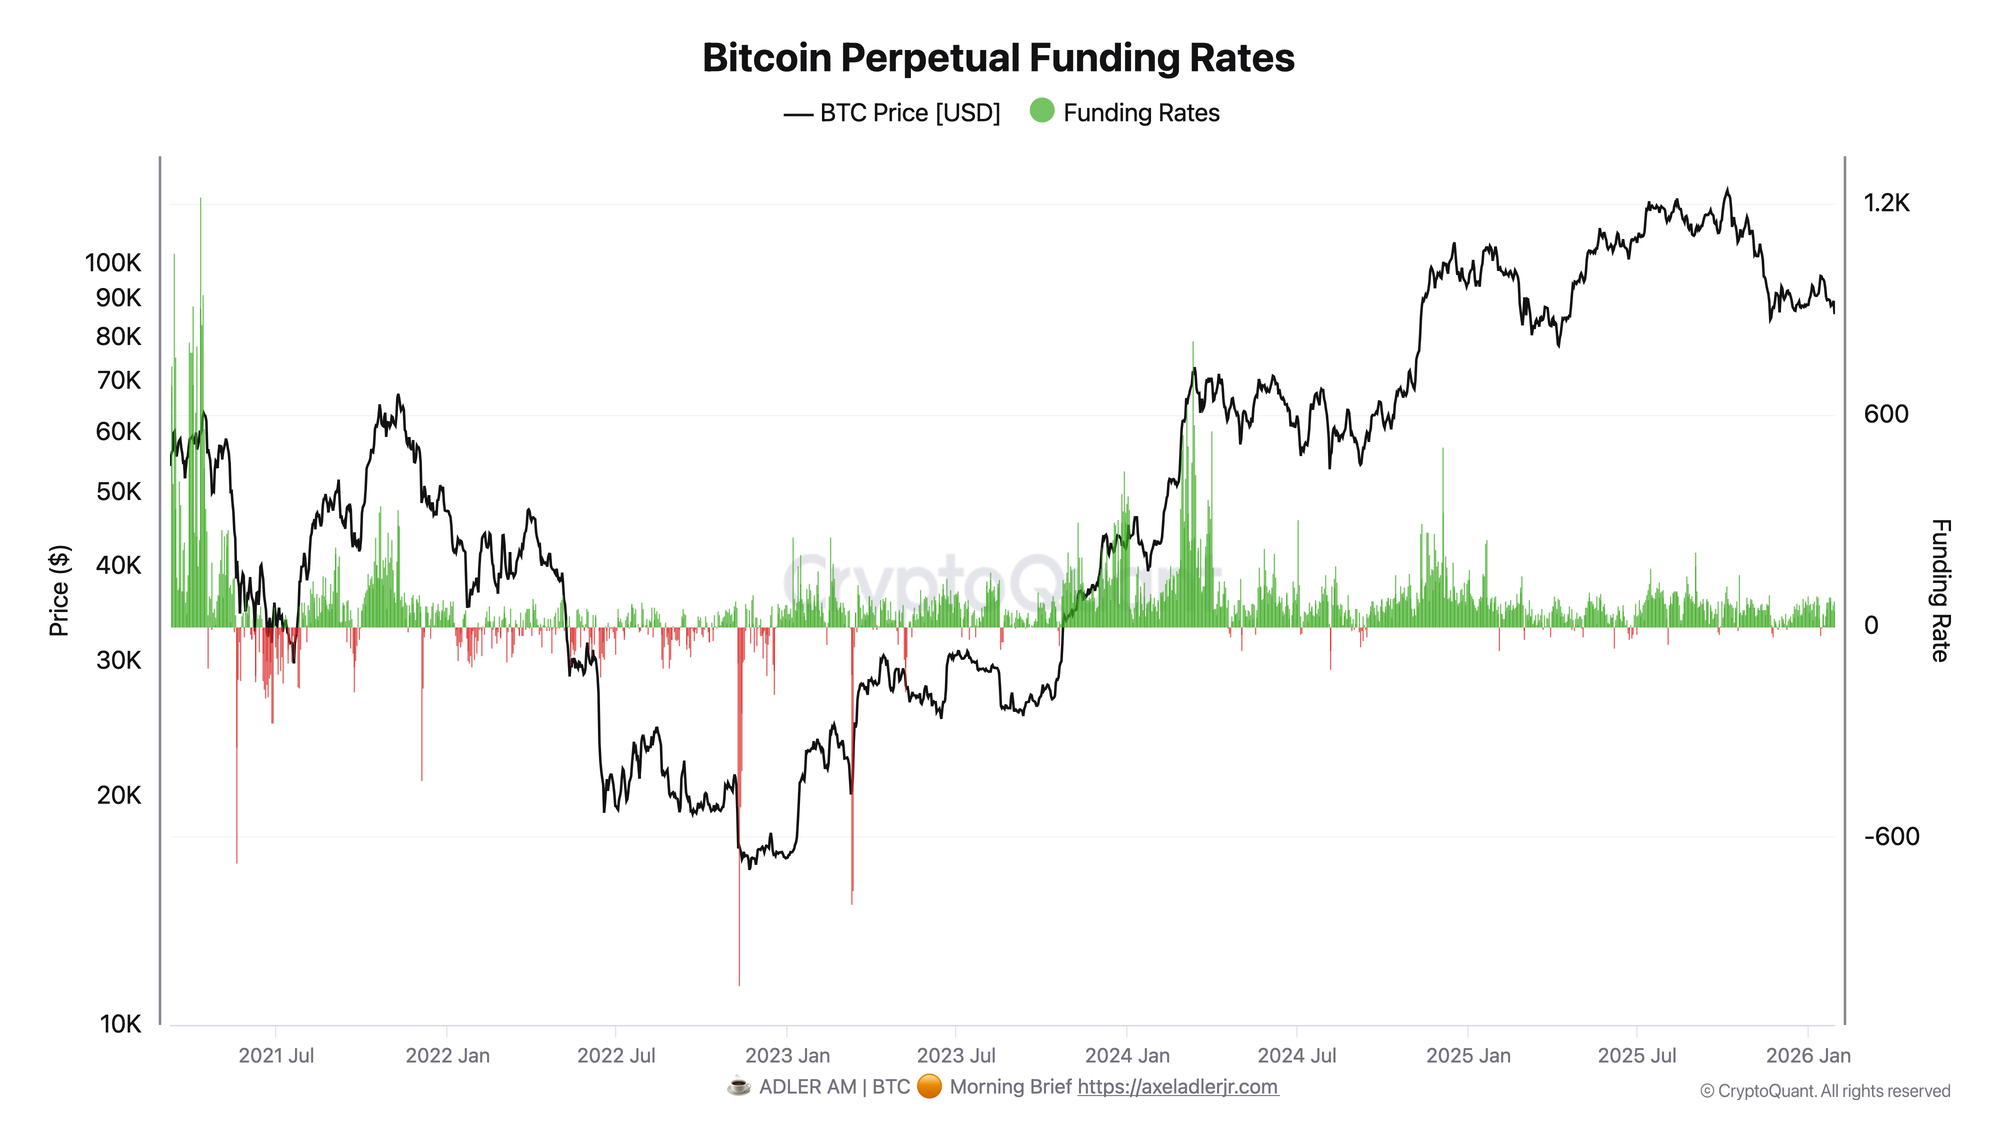
Funding Rate reflects the cost of holding a position:
- positive values mean longs pay shorts,
- negative values mean shorts pay longs.
Despite the sharp price drop and cascade of liquidations, Funding Rate remained positive: yesterday the reading was 43.2% (annualized). This is noticeably lower than October-November peaks (100%+), but still indicates prevailing demand for long exposure. Negative values over the past month were observed episodically and briefly.
Positive Funding amid massive liquidations increases the risk of repeated deleveraging: this means the market is recovering long positioning quickly enough or is not ready to fully unwind it. Complete "derivatives capitulation" is often accompanied by Funding transitioning to neutral or negative territory - this has not happened yet.
Together, the two charts paint a picture of likely incomplete deleveraging: liquidations hit longs extremely hard, but overall positioning remains tilted bullish.
This Sunday, the full in-depth Bitcoin market report comes out. It includes:

1) Bitcoin Strategy
Key components: Regime (main filter) → Bitcoin Index Market Phase → Bitcoin Halving Cycles Timing → Point triggers: Bitcoin Advanced Net UTXO Supply → BTC Buy/Sell Index & Risk → Weekly strategy status
2) Market Analysis
Deep market analysis using key on-chain metrics and final market state with forecast for the following week.
3) Adler Insight Light
Adler Insight Light - a one-page weekly brief based on our proprietary models. It aggregates over 50 on-chain and market parameters and uses machine learning-based forecasting.
7-day trial subscribers receive both reports in full. → Subscribe before Sunday
FAQ
Why is positive Funding Rate during a drop a risk?
Positive Funding means that demand for long exposure persists even after a selloff. This increases the probability of repeated deleveraging: on a new downside impulse, long positions can again become fuel for a liquidation cascade. In on-chain terms, a similar picture is usually confirmed by short-term holder capitulation metrics, such as STH SOPR.
What needs to happen to confirm a local bottom?
For a more confident "local bottom" scenario, it is important to see a combination of confirmations: Funding normalizes to 0 or goes negative, Liquidations Oscillator returns to 0 and/or goes into negative territory, and 30D SMA starts declining. Additionally, it makes sense to cross-check on-chain filters: STH SOPR behavior and absence of sustained growth in BTC inflows to exchanges Exchange Netflow and for cycle phase context NUPL analysis helps.
CONCLUSIONS
The liquidation cascade (long dominance ~97%) is a symptom of market overload with long positions, but not necessarily final cleansing. Persistently positive Funding (43% annualized) may indicate that demand for long exposure is not broken, and the deleveraging process is not complete.
Current regime: risk-off with elevated volatility. Potential trigger for regime change - Funding normalization to neutral/negative and liquidations oscillator transitioning to zero or below. Main risk - a repeated wave of decline while bullish positioning persists, capable of triggering a new liquidation cascade.