
🎧 Morning Brief #146 - audio debate on today’s market setup
The BTC derivatives market has gone through a sharp restructuring over the past two weeks: from aggressive leverage buildup to a notable reduction, while price held above $70,000. Two indicators - the weekly change in OI and funding rates across the three largest exchanges - show that overheated positioning has been unwound, and the market has shifted toward a more cautious and, in places, clearly short-biased stance.
TL;DR
Over the past two weeks, the BTC futures market transitioned from aggressive leverage accumulation into a deleveraging regime: OI contracted by 7%, and funding flipped negative. This is not yet a confirmed reversal, but a clear shift in positioning regime. As long as spot holds above $70,000, this configuration creates conditions for a short squeeze - though it does not guarantee one.
Bitcoin Futures Open Interest: 7-Day Change (%)
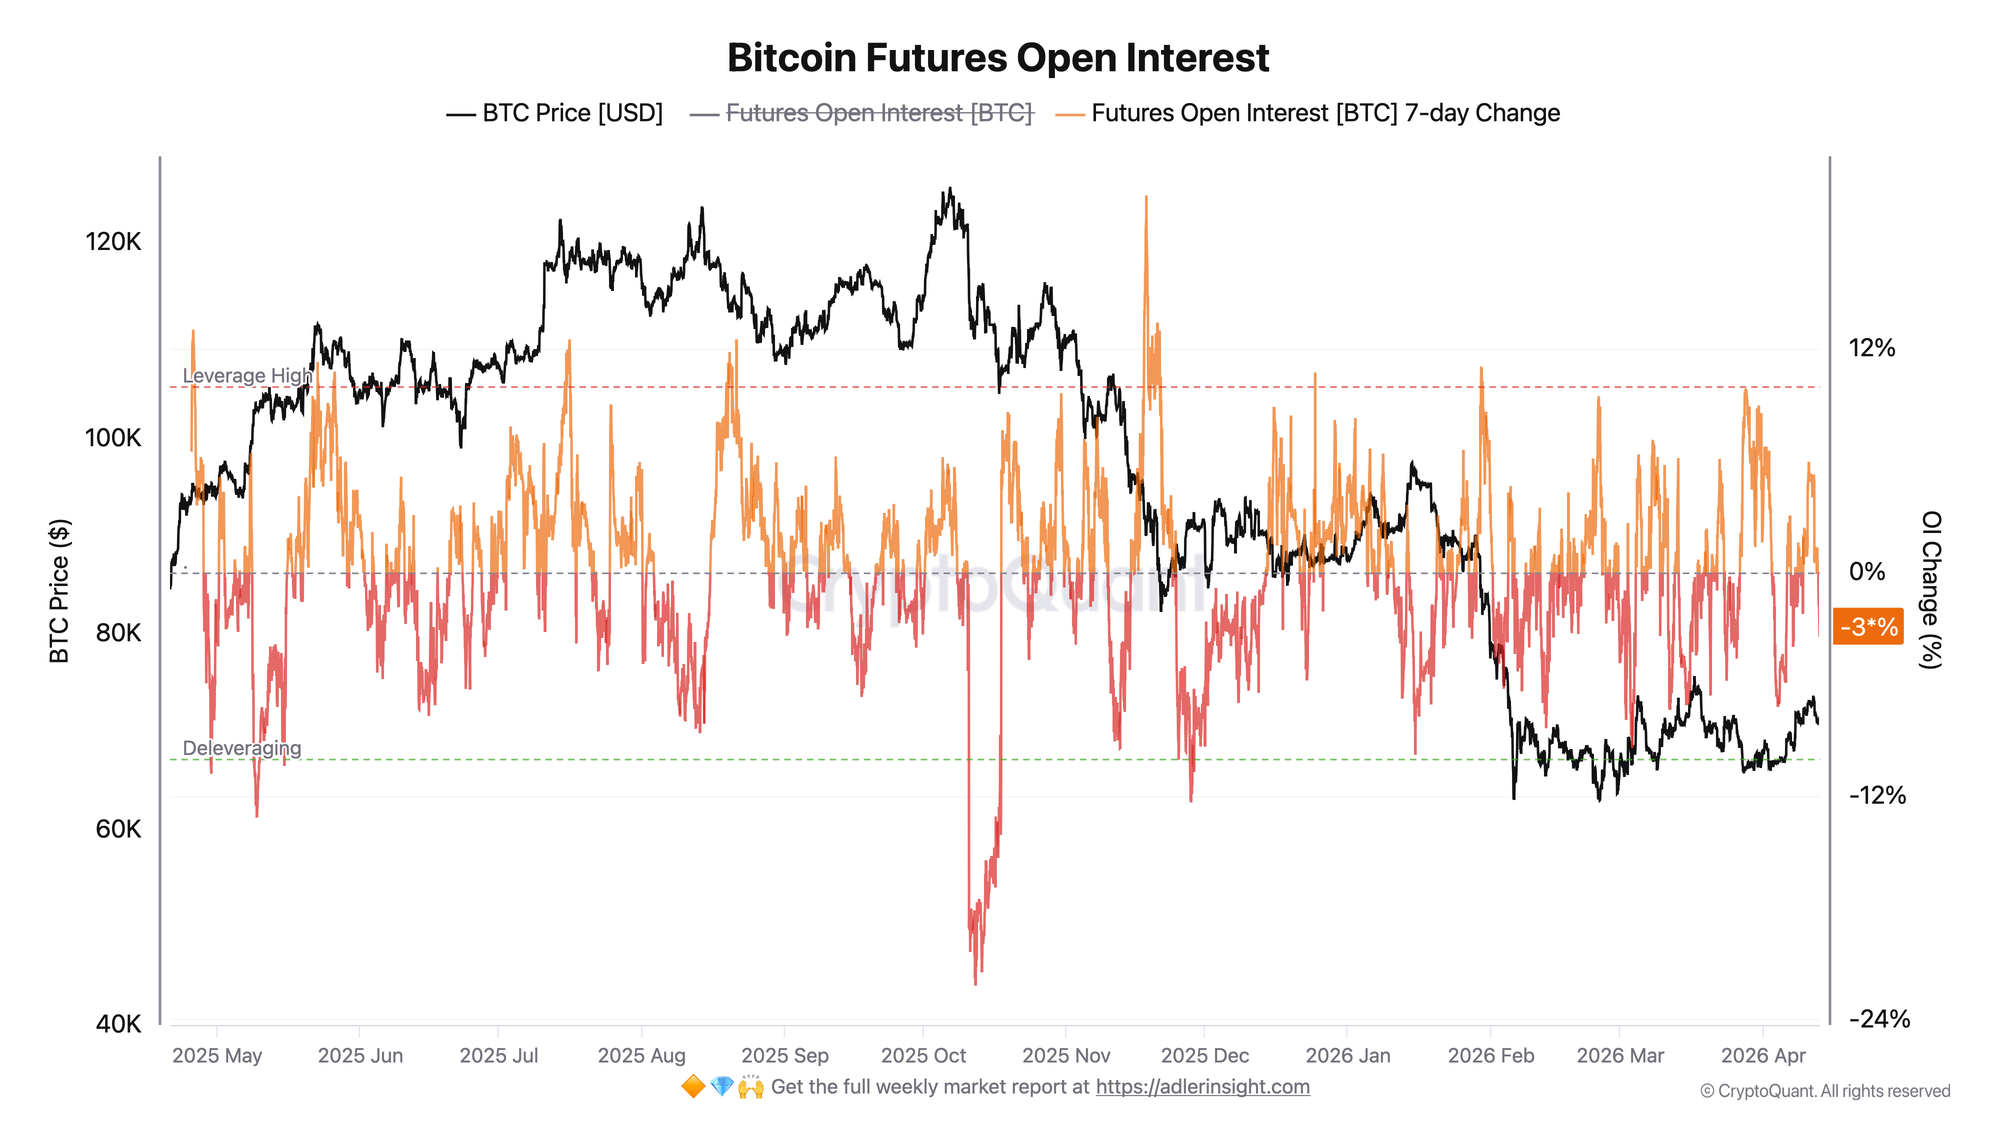
The metric shows the weekly change in aggregate BTC futures open interest, denominated in BTC.
From late March through early April, the 7-day OI change peaked at +8.9% on March 31, indicating active leverage expansion as price pushed toward $73,000+. By April 4, the metric had dropped to -7.2% - the sharpest contraction over the observed period. As of April 13, the 7D Change stands at -2.46% with OI around 318,000 BTC. The crossover into negative territory only occurred on April 12, meaning the deleveraging is still fresh.
Such an OI contraction while spot price holds above $70,000 means that a significant portion of prior long-side leverage has been removed from the market. However, OI alone does not allow for a clean separation between voluntary position closures and liquidations, so it is more accurate to speak of deleveraging rather than a liquidation cascade.
If OI stabilizes and begins recovering while price holds at current levels, that will be the first signal that the market has digested the leverage flush and is ready for a new positioning phase. The key risk to the bullish scenario is a further acceleration of OI decline combined with a break below $70,000.
Bitcoin Futures Perpetual Funding Rate (7D-SMA) - Binance, Bybit, OKX

The metric reflects the 7-day moving average of the perpetual futures funding rate for BTC across the three largest exchanges.
In late March through early April, the mean funding rate reached +0.33% on March 31. Bybit and OKX were in the +0.39-0.59% range at that point, indicating pronounced overheating on the long side. By April 11, the mean had crossed into negative territory, and as of April 13 it stands at -0.1738%. Binance remains the least negative at -0.0565%, while Bybit at -0.2233% and OKX at -0.2416% show a notably more pronounced short-side skew.
Negative funding alongside stable price means shorts are paying to hold their positions. This alone is not a signal for immediate upside, but in an environment of stable price it increases the vulnerability of short positions. The longer BTC fails to break below key levels, the higher the probability that accumulated negative funding begins to work against short holders.
Together, both charts tell a sequential story: first the market shed overheated longs through OI contraction, then funding went negative, showing a shift toward short-side positioning. With spot holding firm, this creates an asymmetry in favor of a sharp move higher if a catalyst emerges - but does not yet confirm that scenario.
When Bitcoin moves, context matters more than opinions. DECISION TERMINAL filters the noise and delivers one actionable market read backed by real data and AI analysis. Access here.
FAQ
What does negative funding mean when price is stable? It means short position holders are paying longs to keep their positions open. If price does not decline in the meantime, pressure on shorts gradually accumulates, increasing the probability of forced closures.
Under what scenario does deleveraging continue instead of reversing? If BTC breaks below $70,000 while OI continues to contract and negative funding deepens further, that would confirm a weaker market scenario. For the structure to improve, at minimum price needs to hold current levels and OI needs to stabilize.
CONCLUSIONS
The BTC derivatives market has gone through a significant leverage flush over the past two weeks: the OI peak of +8.9% has given way to a decline to -7.2%, and funding has reversed from +0.33% to -0.1738%. This is not a confirmed reversal - it is primarily a shift in positioning regime. Overheated longs have been cleared, and the market has moved into a more cautious, in places short-biased configuration. As long as spot price holds above $70,000, the divergence between a resilient spot and a bearish derivatives structure keeps the short squeeze potential intact. The key risk is a break below $70,000 accompanied by further deleveraging. The key positive trigger is OI stabilization and leverage rebuilding without losing current price levels.
Further Reading
- Bitcoin Open Interest & Leverage Ratio
- Bitcoin Funding Rates: Definition, Formula & Cycle Signals
- Bitcoin Open Interest and Funding Rate: The Combined Framework for Reading Derivatives Markets
- Bitcoin Open Interest vs Price: 4 Divergence Patterns Every Trader Must Know
- Bitcoin Liquidation Cascade: How It Works, Why It Happens & How to Predict It