
🎧 Morning Brief #113 - audio debate on today’s market setup
Three market structure indicators are sending a consistent signal today: USDT liquidity is contracting, the derivatives market is not responding, and there are no signs of demand returning - neither spot nor futures. This is not a correction with accumulation potential - this is a structural weakening of demand.
TL;DR
This brief covers liquidity quality and buying structure against the backdrop of BTC correcting to ~$63.8K. The key focus: USDT MC has been falling for 34 days, SSR is declining through capital outflow rather than stablecoin accumulation - ELR confirms this.
Bitcoin vs USDT Market Capitalization
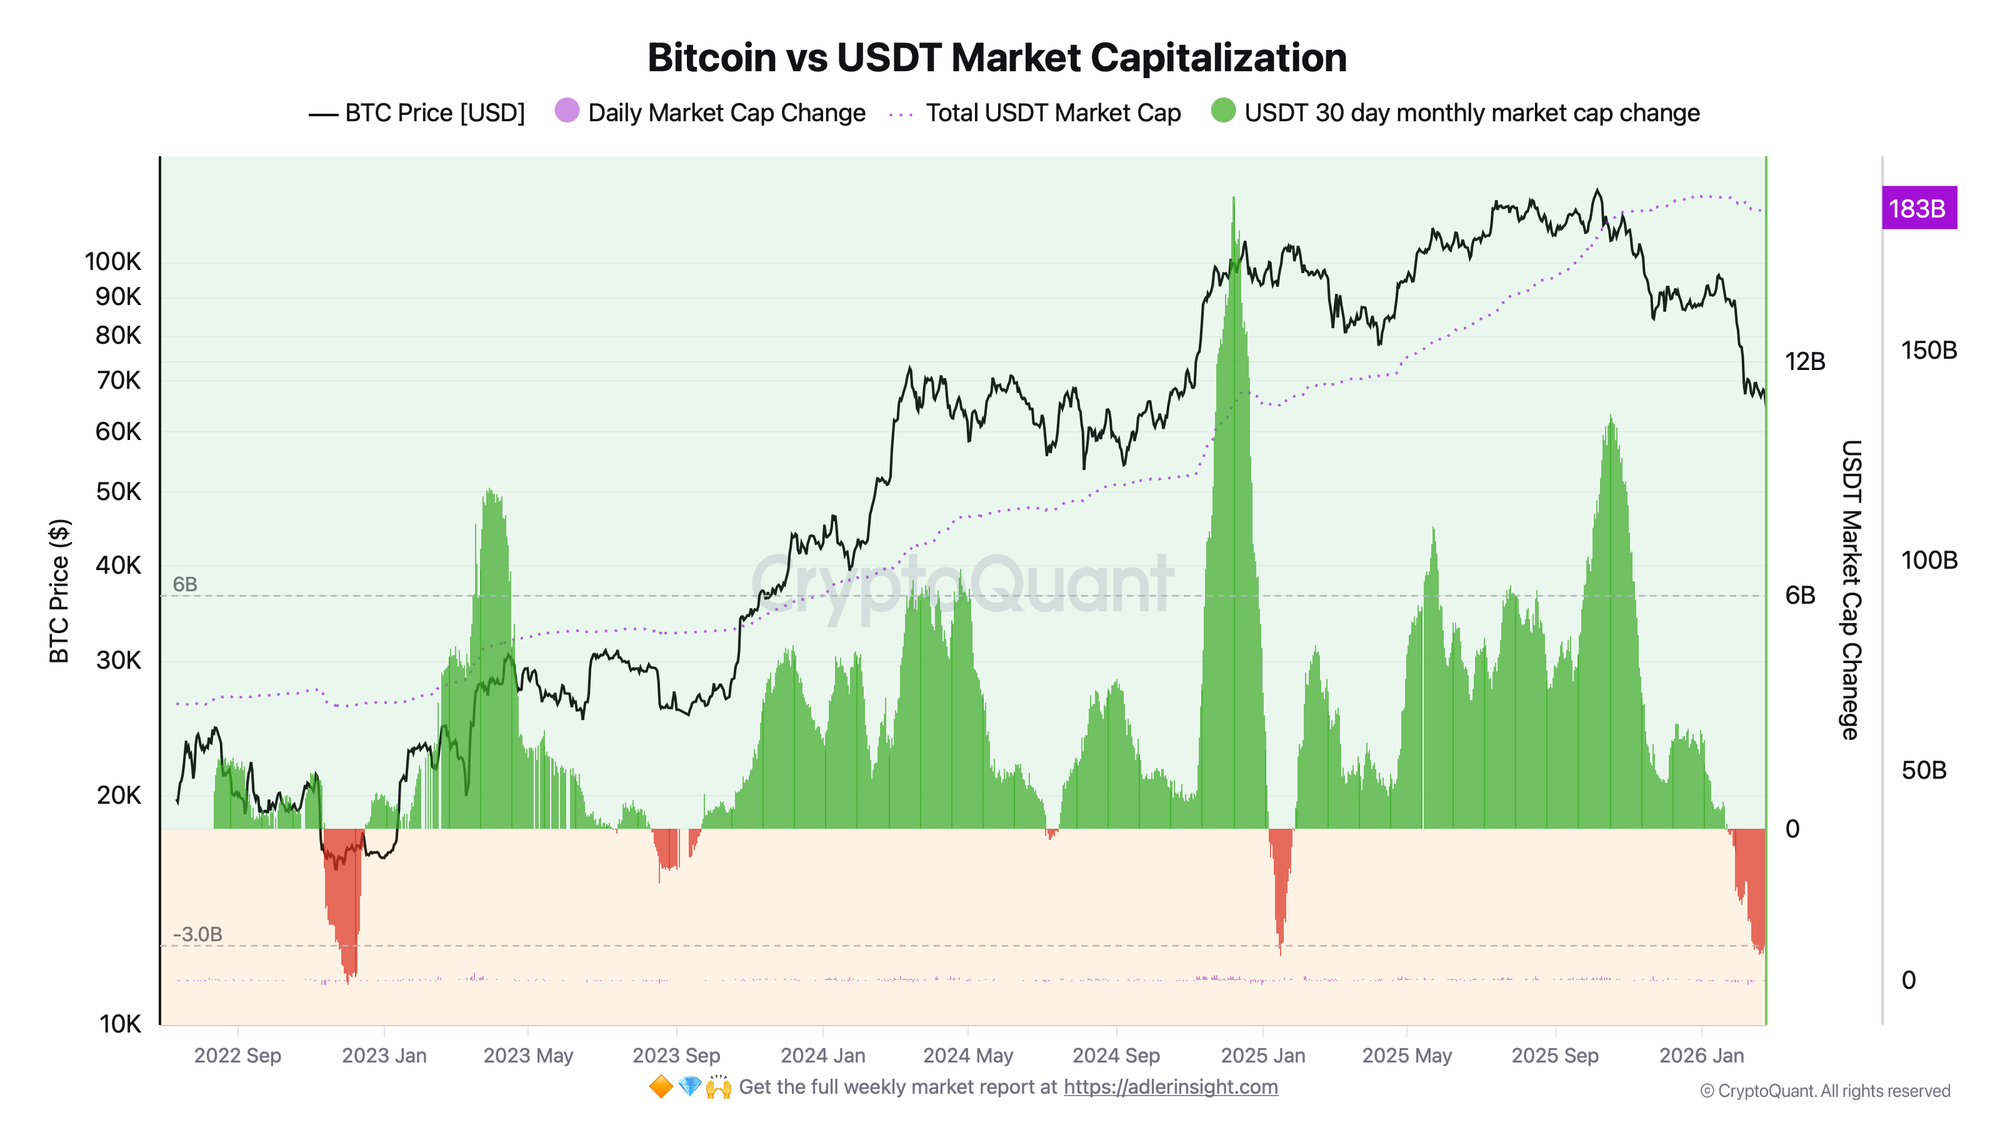
USDT Market Cap is a direct indicator of fresh capital inflow into the crypto ecosystem. When the 30-day change is positive and growing - new money is entering the market. When negative - capital is leaving.
USDT capitalization peaked at $187.2B on December 30, 2025, and has since contracted by $3.6B to $183.6B. The 30-day change has remained in negative territory (-$3.08B) for 34 consecutive days - the last time sustained inflow above $2B per month was recorded was in early January. Over the same period, BTC corrected from ~$87.8K to ~$63.8K, meaning the price decline and liquidity outflow are moving in sync, reinforcing each other.
This is the key fact today: stablecoins are not accumulating on the sidelines waiting for an entry point - they are leaving the ecosystem. The reversal signal will be a return of the 30-day USDT change to a sustained positive zone, preferably above $2B per month.
Bitcoin Stablecoin Supply Ratio (SSR)
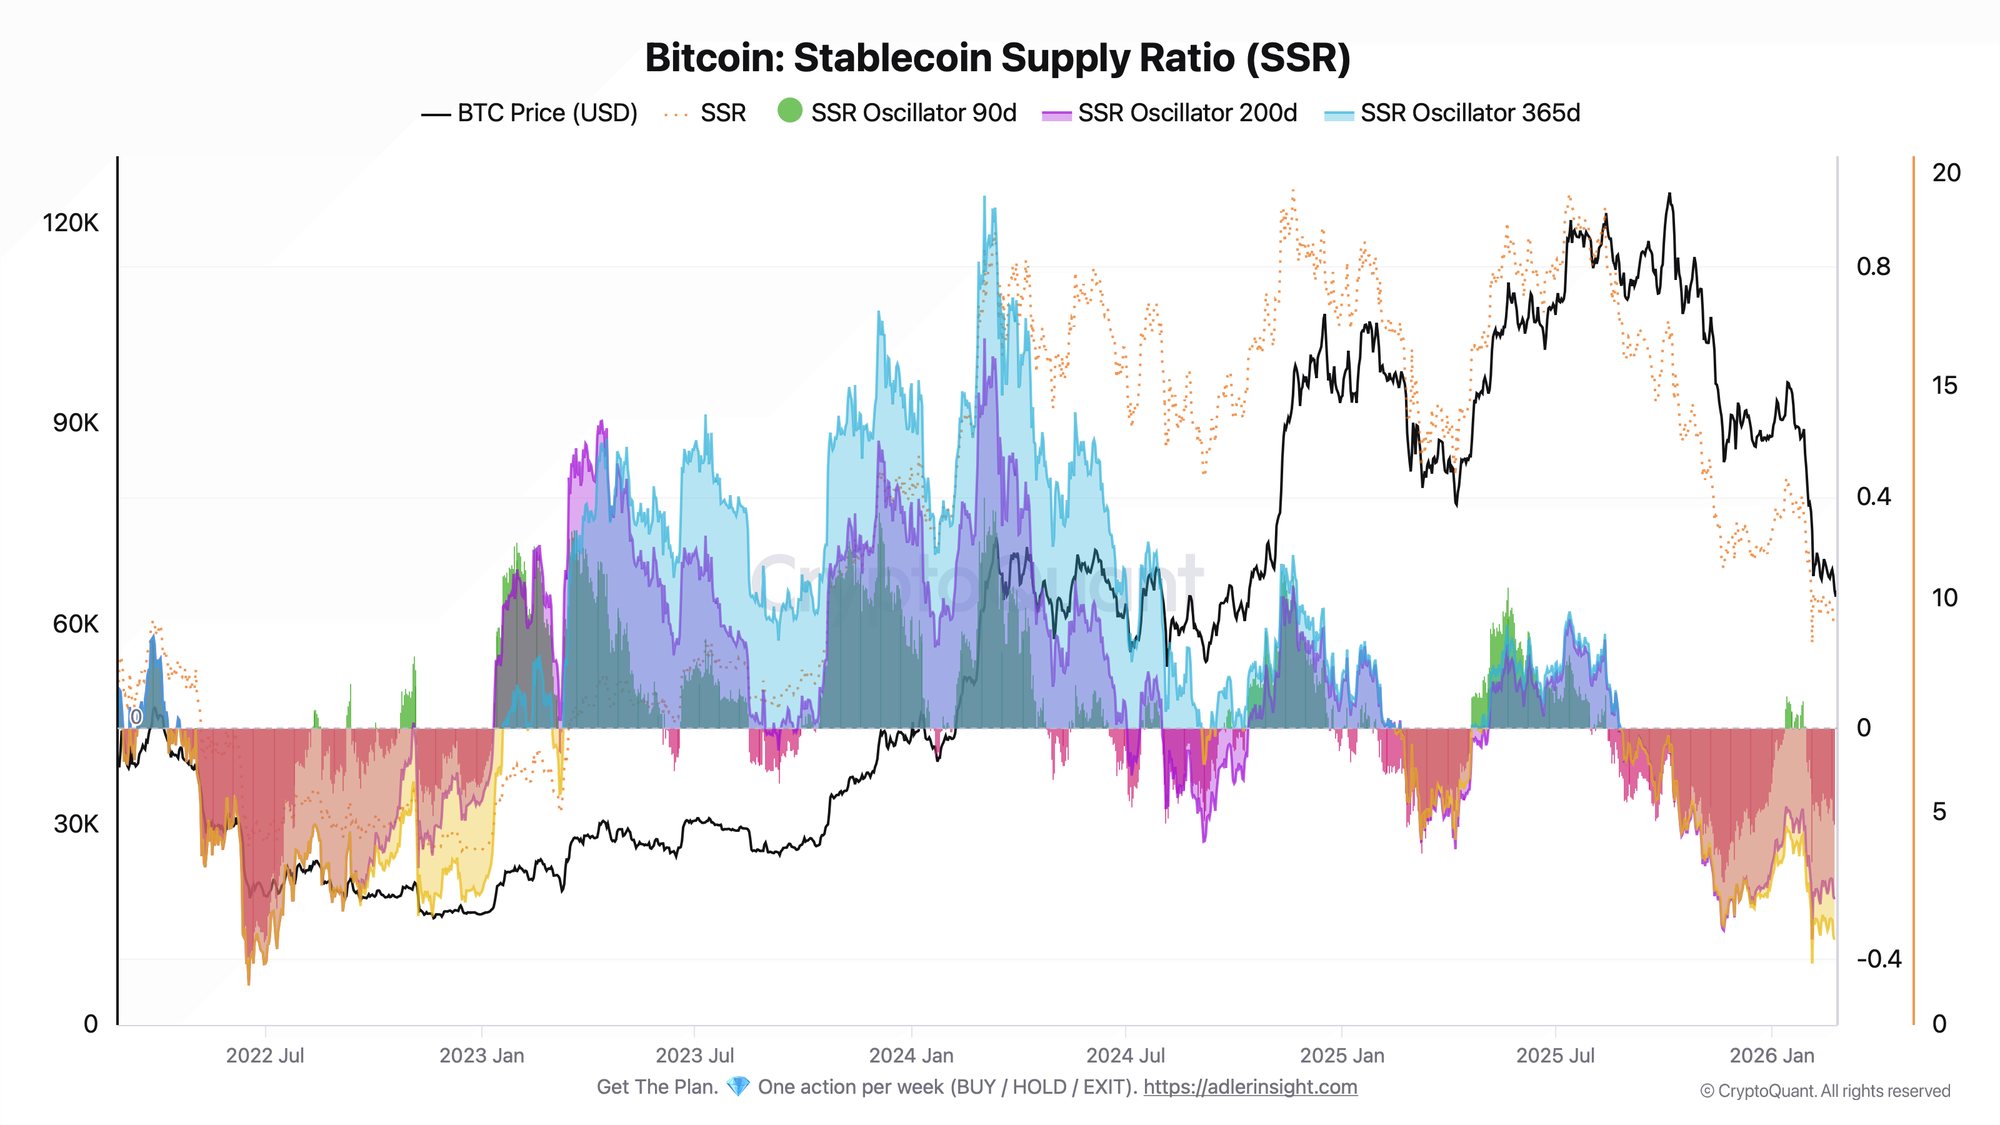
SSR = BTC market capitalization / USDT market capitalization. The metric moves together with BTC price: the cheaper BTC gets - the lower SSR falls. An oscillator below zero means the current SSR is below its moving average for the period - meaning USDT is relatively expensive by historical standards.
The current SSR is 9.36, with the 365d oscillator at -0.37 - that is, 37% below the annual norm. At first glance this looks like "a lot of USDT relative to BTC" - the classic signal of potential demand. But USDT MC data breaks this interpretation. Technically SSR falls mathematically because BTC market cap (the numerator) has collapsed by 27%, but the simultaneous contraction of USDT MC (the denominator) strips this signal of any bullish potential.
Low SSR here is not accumulated "dry powder" - it is simply a consequence of BTC price falling faster against a backdrop of exiting liquidity. This is a fundamentally different situation from when SSR falls with a growing USDT supply against a stable price. Interpreting it as a bullish signal without confirmation from USDT MC is incorrect.
Bitcoin Estimated Leverage Ratio - All Exchanges
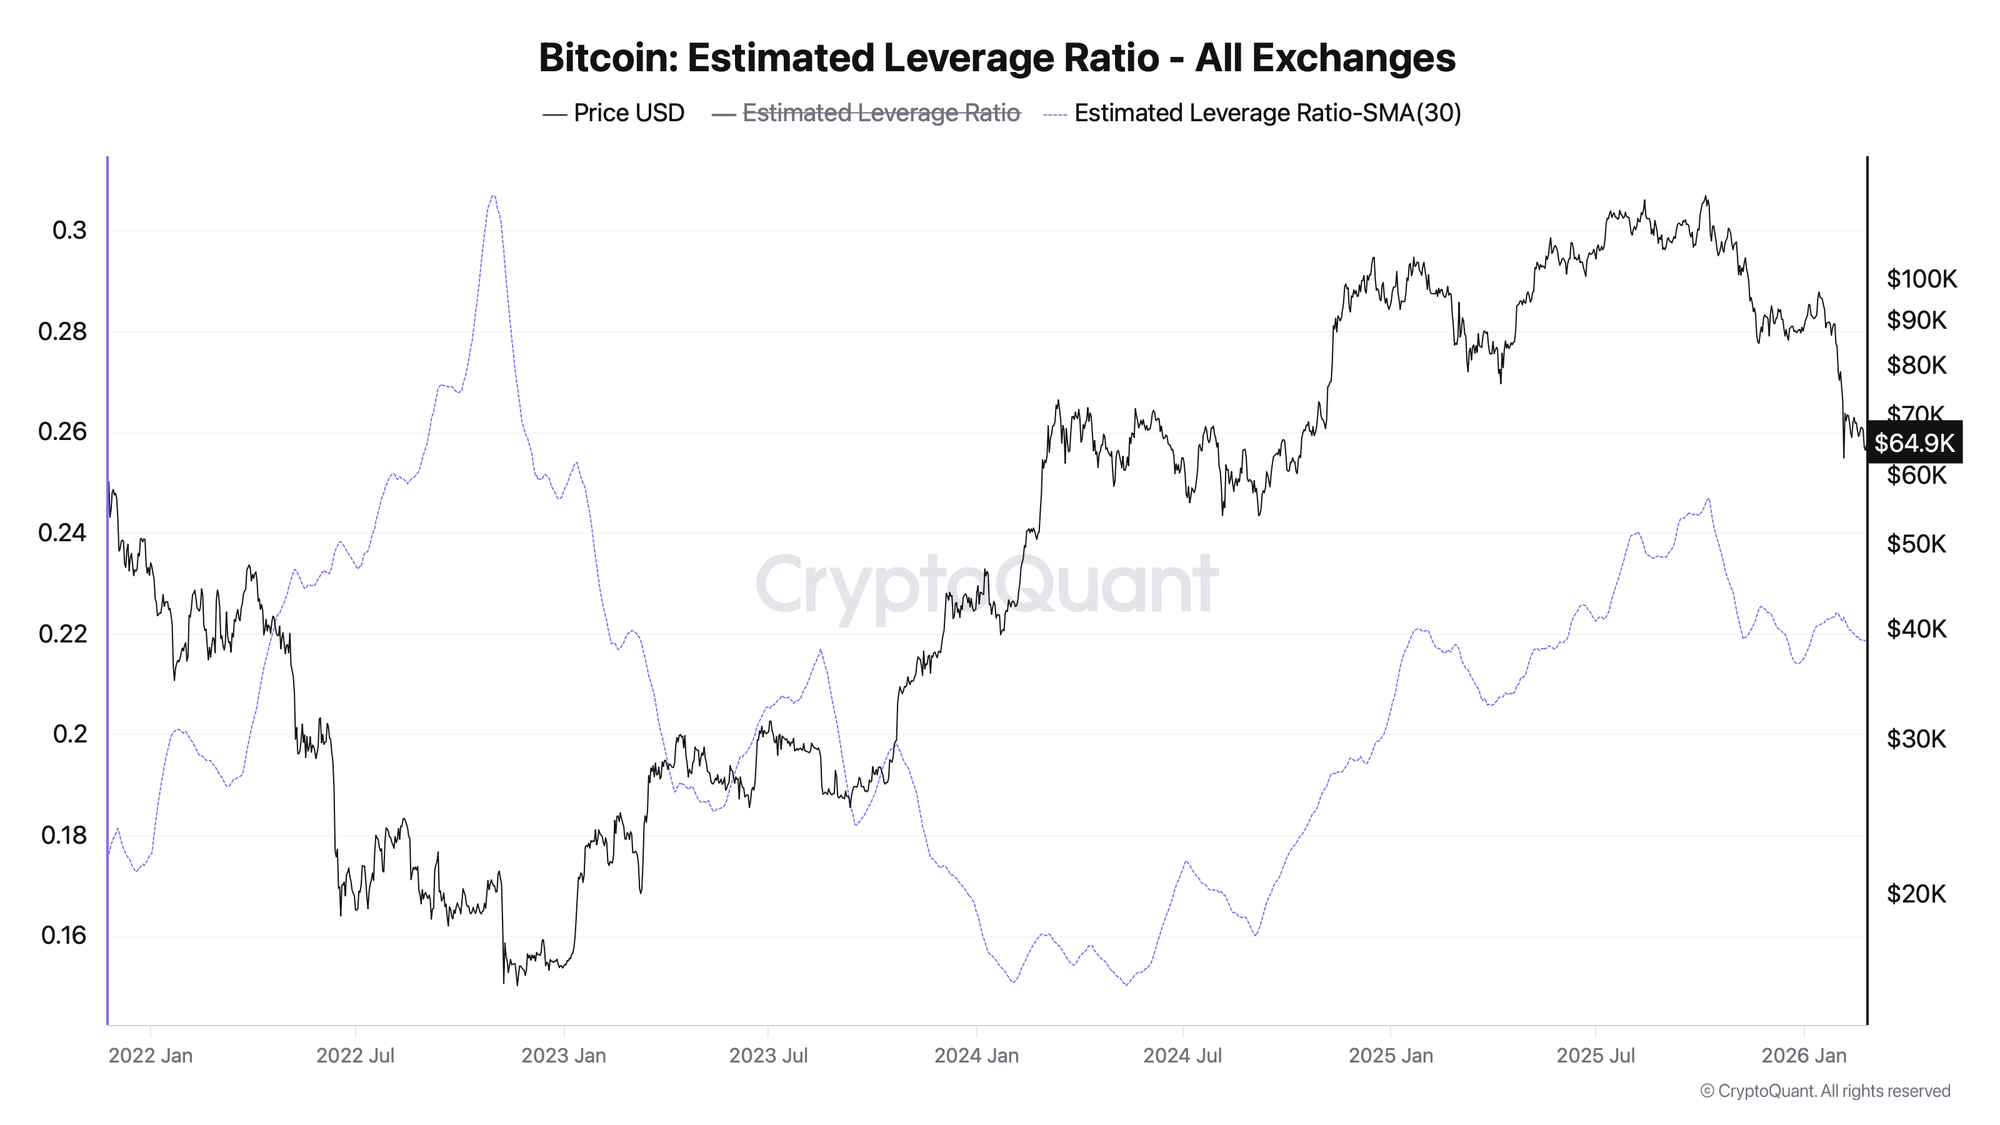
ELR = open interest in derivatives / BTC balances on exchanges. High values mean the market is driven by leveraged traders, low values mean the structure is predominantly spot.
ELR stands at 0.219 - virtually unchanged over 7 days (-0.2%), 30 days (-0.6%), and 90 days. The indicator is at the 78th percentile of its historical distribution. This is objectively an elevated level, meaning significant leverage is still present in the system. Notably, against a ~27% BTC correction over the past month, ELR has not moved: the market has not yet cleared, and marginal positions are simply riding out the drawdown, or shorts are offsetting longs.
The absence of a deleveraging flush at such an elevated percentile carries a hidden risk of cascading liquidations on further decline. A flat ELR during a sharp price move means one thing: speculative capital is not adding new risk, but it is not shedding old risk either. ELR rising above 0.24-0.25 during price stabilization would be the first signal of returning derivatives demand.
The connection across all three charts is clear: USDT MC contracts - SSR declines through outflow rather than accumulation - ELR confirms the absence of sustained derivatives demand while concealing the risk of unrealized deleveraging. All three metrics independently point to the same conclusion: there are no signs of buyers returning with either fresh capital or leverage.
🟠 Invest in Bitcoin without emotional decisions - Start free. Deterministic signals built to remove fear, FOMO, and panic selling.
FAQ
Doesn't low SSR mean there is plenty of USDT available to buy BTC?
This is only true when USDT MC is growing or stable while BTC price falls. Right now USDT MC is contracting on its own - $3.6B has left the ecosystem over two months. Low SSR here simply reflects that both components of the ratio are weakening simultaneously, not that USDT is waiting for an entry point.
Under what conditions does the picture turn bullish?
Two conditions need to be met simultaneously: the 30-day USDT change returning to a sustained positive zone - as confirmation of fresh capital inflow - and ELR beginning to rise during price stabilization. One without the other is not enough: spot inflow and derivatives demand need to align.
Further Reading
To understand the metrics used in this brief in more depth:
- Bitcoin Open Interest & Leverage Ratio - how ELR is calculated and what historical extremes mean
- Bitcoin Open Interest vs Price: 4 Divergence Patterns - how to read flat ELR against a falling price
- Bitcoin Liquidation Cascade: How It Works - why elevated ELR percentile creates hidden downside risk
- Bitcoin Open Interest and Funding Rate: The Combined Framework - full derivatives market context
CONCLUSIONS
Three metrics paint a consistent picture today: USDT MC has been falling for 34 consecutive days (-$3.6B from peak), SSR is declining through bilateral outflow rather than liquidity accumulation, and ELR has remained flat despite a 27% BTC correction over the past month. The overall regime is risk-off: the structure does not support recovery without a prior reversal in USDT flows. The primary trigger for a regime change is the monthly USDT change returning above $2B alongside a simultaneous rise in ELR. The primary risk is a continuation of the synchronized decline in BTC and USDT MC, which would move the current drawdown out of the "healthy pullback" category and into a phase of structural market weakening and a prolonged bearish correction.