


🎧 Morning Brief #211 - audio debate
Over the past 24 hours, BTC has fallen 1.9% and is trading around $62.8K. However, the key move came from the derivatives market, not spot price: open interest declined almost continuously, while the pressure index dropped below its 30-day average. Both charts point to the same process - the market is unwinding leverage rather than building aggressive short positions.
TL;DR
The price decline is accompanied by a sustained reduction in open interest and a weakening pressure index. At this point, it looks more like positions are being closed and excess leverage is being flushed out than a structural move lower. But buying momentum has weakened noticeably.
Bitcoin Perpetual Market Pressure Index
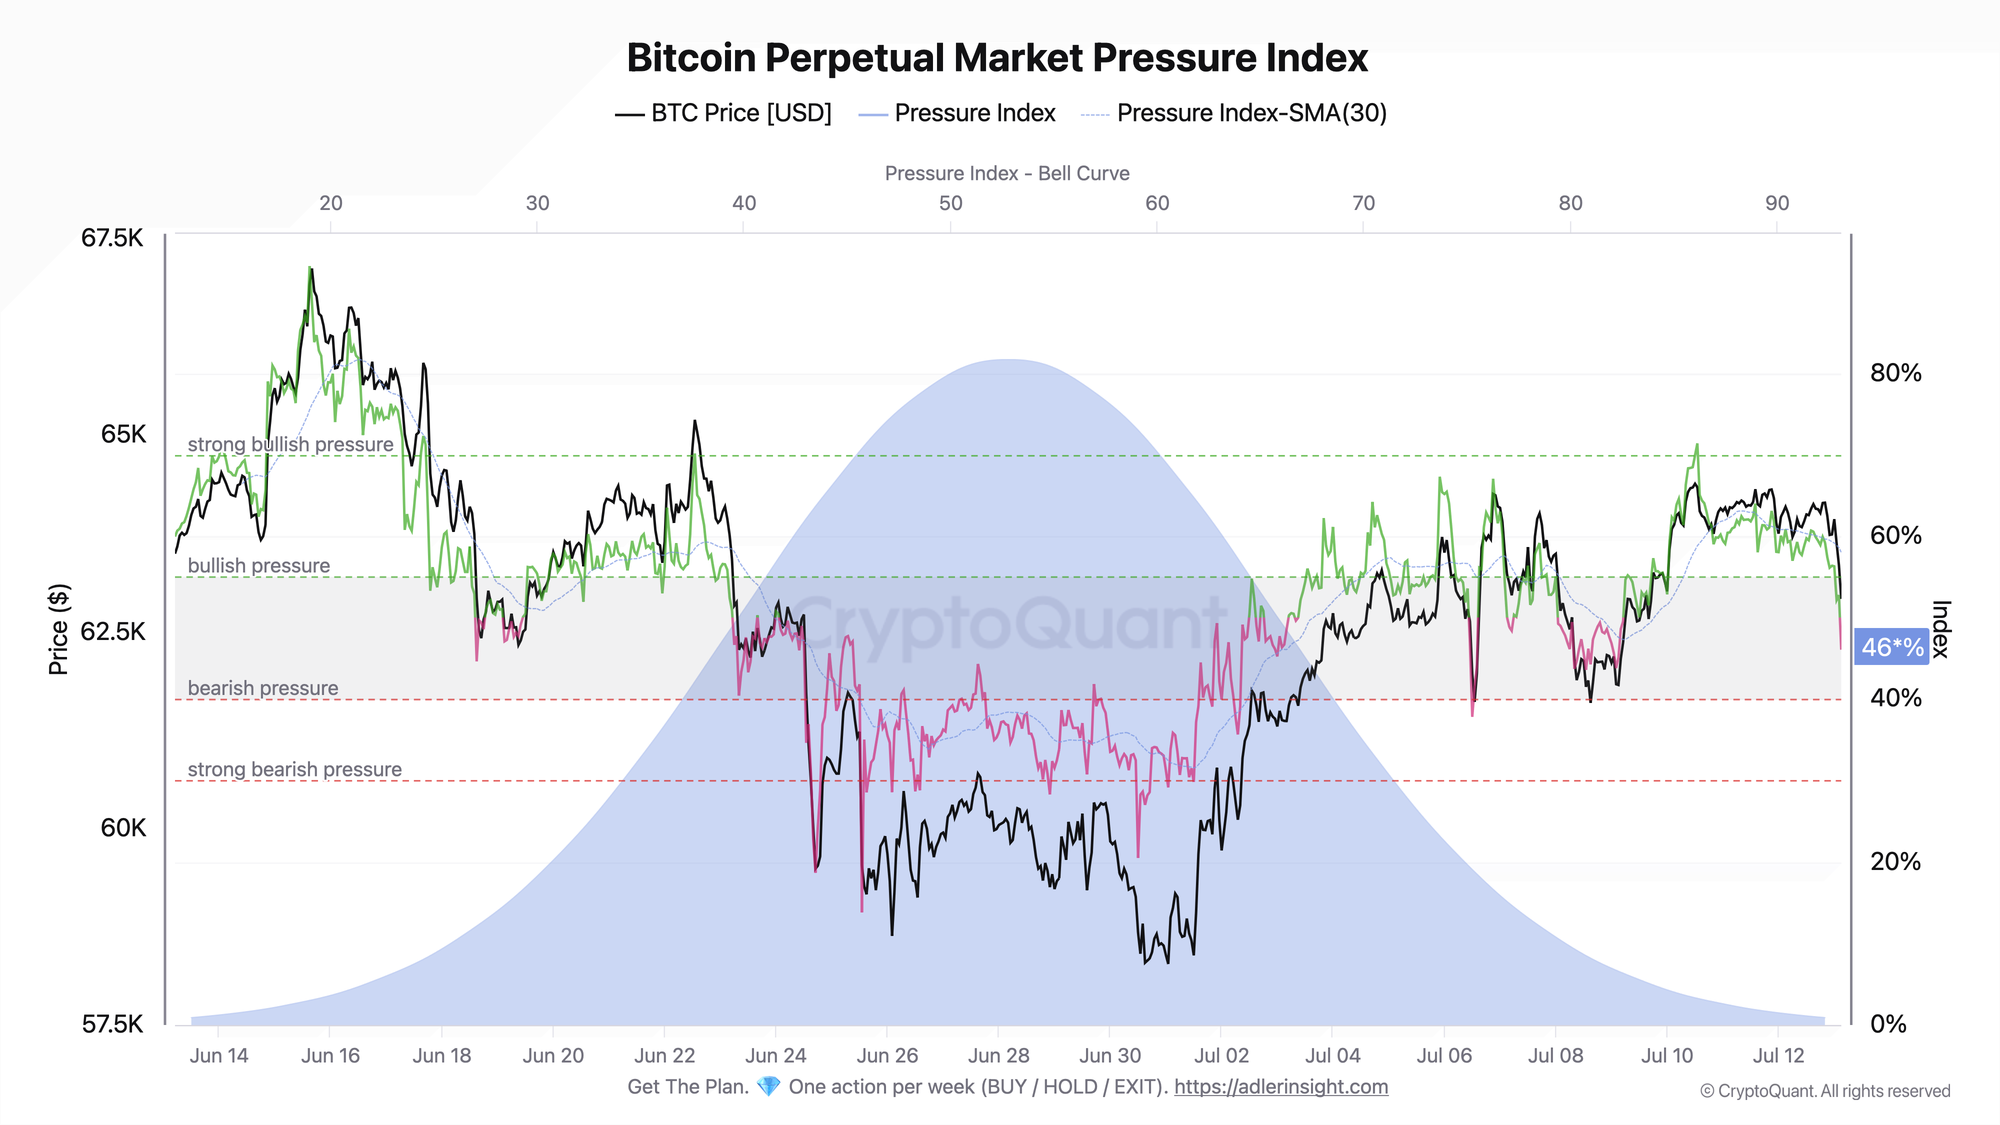
The composite index combines price, net taker flow, open interest, and volume delta into a single scale from 0 to 100.
Over the past six hours, the index has lost around 11 points and fallen to 46. Just 24 hours ago, it was holding in the 57-61 range, but it then broke below 50 and moved under its 30-day average, currently near 58.
A move below 50 means that aggregate buying pressure has weakened. Falling below the 30-day average strengthens that signal, but full confirmation would require the index to remain below it. A return above 58 would be the first sign of recovery.
Bitcoin Open Interest Change
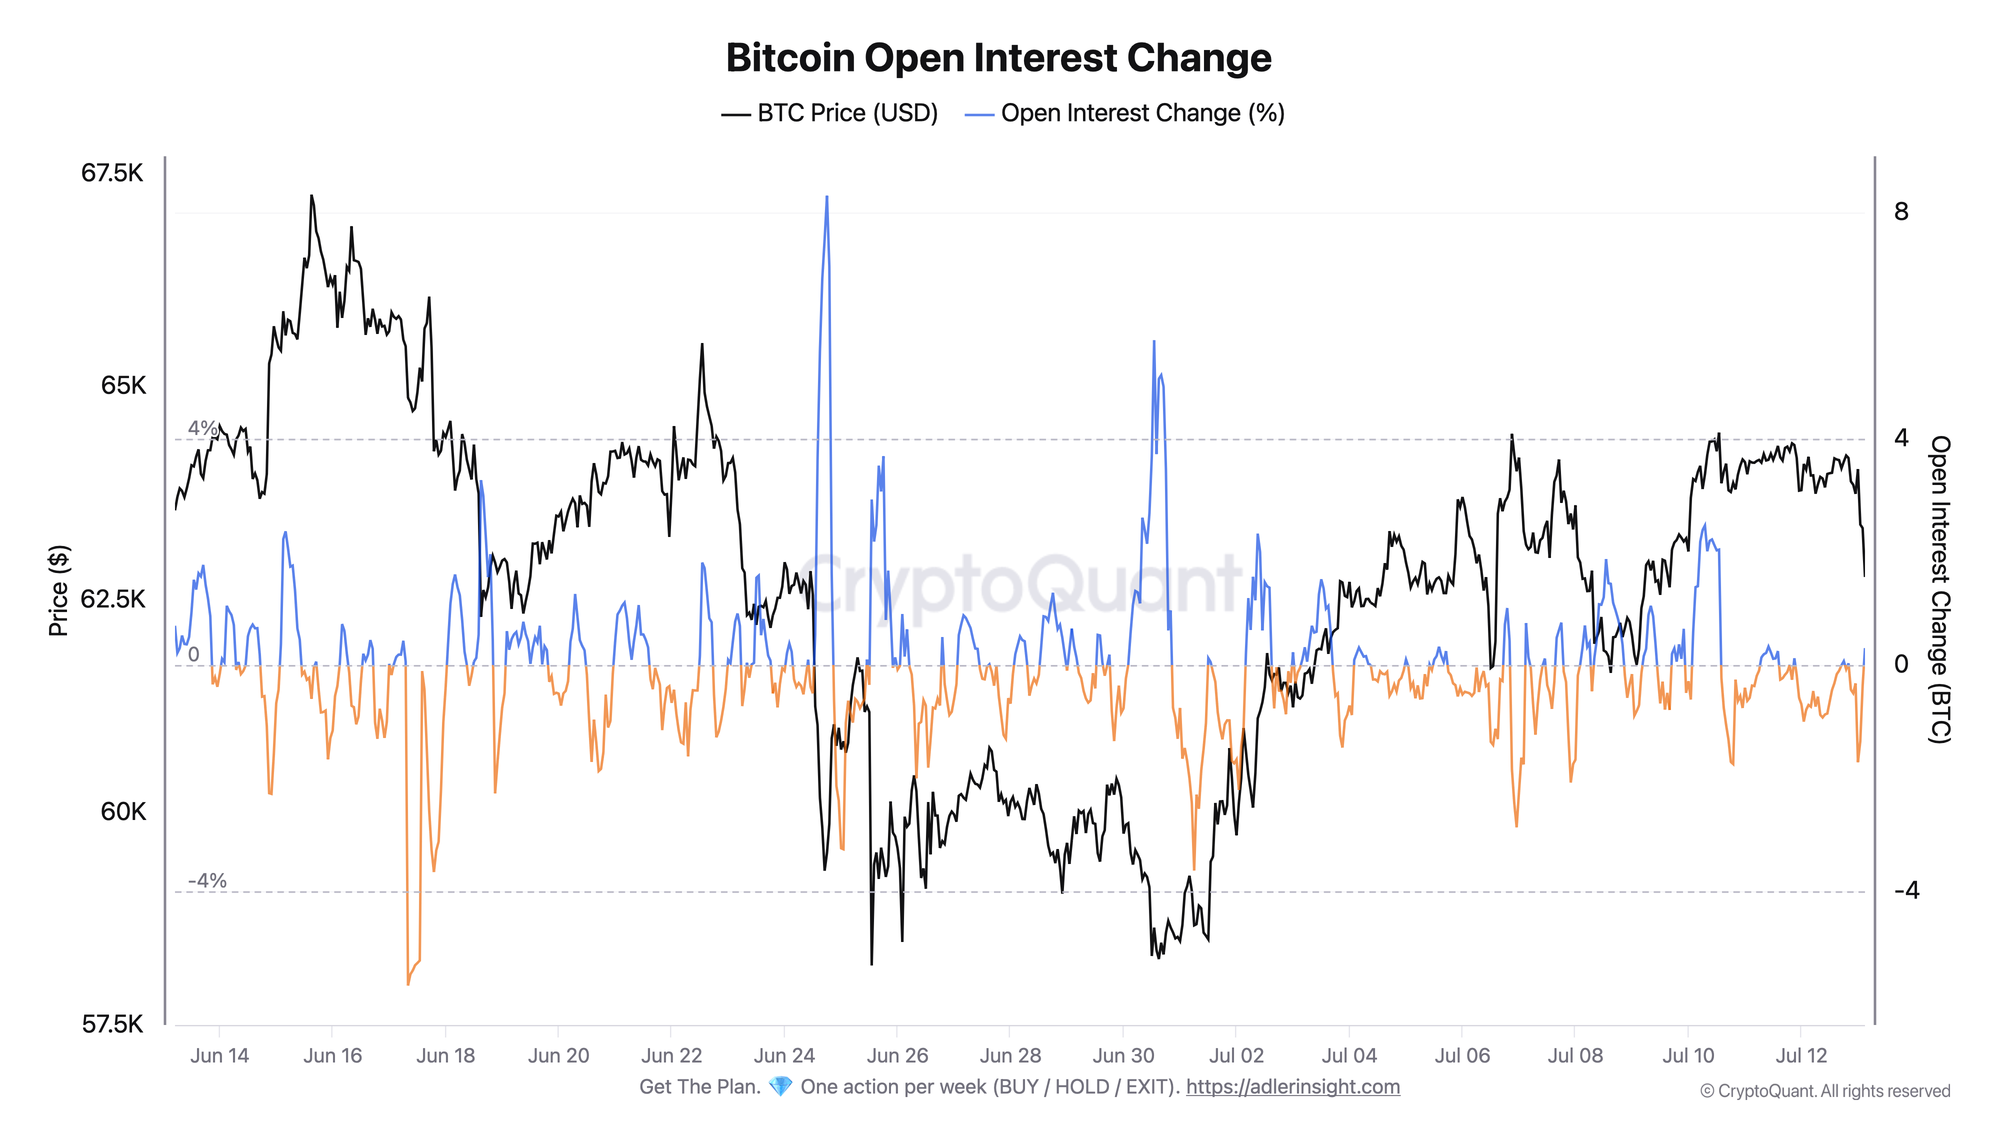
The metric tracks the hourly change in aggregate open interest across BTC perpetual contracts.
Open interest declined in 21 of the past 24 hours, with the total daily contraction reaching 12%. The sharpest hourly drops, at 1.7% and 1.4%, occurred overnight as BTC was also losing ground. Only the latest hour showed a modest uptick in OI.
The combination of "price down + open interest down" points to position closures and leverage reduction. This differs from a scenario in which price falls while OI rises - that would indicate an influx of new short positions and stronger pressure from sellers.
The second chart explains the decline in the pressure index: open positions are being closed rather than the market shifting toward aggressive short accumulation. This makes the current move less dangerous from a structural perspective, but it also confirms weaker demand.
Outperform Buy & Hold with a rules-based strategy - Start free. One weekly action, clear triggers, and invalidation levels. No guessing.
FAQ
Why is a decline in both price and open interest considered less dangerous than falling prices with rising OI? A decline in OI means positions are being closed and leverage is leaving the system. Rising OI alongside falling prices, by contrast, would point to new short positions being opened and stronger downside pressure.
What would confirm further market weakness? The pressure index remaining below its 30-day average while price and open interest continue to decline. A return above 58 and stabilization in OI would move the market back into a neutral regime.
CONCLUSIONS
Both charts capture the same process: BTC has fallen 1.9% over the past 24 hours, open interest has declined by around 12%, and the pressure index has dropped to 46 and broken below its 30-day average.
For now, this looks like deleveraging and cooling demand rather than a structural breakdown or a wave of new short positions. The current regime is neutral with a risk-off bias.
The main improvement signal is a stabilization in open interest and a return of the index above 58. The main risk is a continued price decline alongside further OI contraction and the index sliding into the lower third of its range.
Live Charts
Explore the metrics behind this brief with live, auto-updating charts:
Open Interest (BTC) - Total futures positioning and 7-day BTC-denominated change.
Funding Rates - Perpetual futures funding to track long-side or short-side leverage pressure.
Fear & Greed Index - Composite market sentiment for risk appetite and sentiment extremes.
Derivatives - All funding, open-interest, and leverage charts in one view.