


🎧 Morning Brief #210 - audio debate
The realized pressure model has shifted back toward buyers, as it did at prior local lows, while the Cost Basis cohort map shows price sitting near the lower boundary of the short-term holder range. We break down where the demand and supply zones now sit and what is holding the current structure in place.
TL;DR
Buying pressure is once again outweighing selling pressure at the lows, repeating the February pattern, while price is holding near the Cost Basis of the freshest holders. The logic of this brief is simple: compressed selling pressure and price positioning in the lower part of the cohort range point to an accumulation zone.
Bitcoin STH Realized Pressure Model
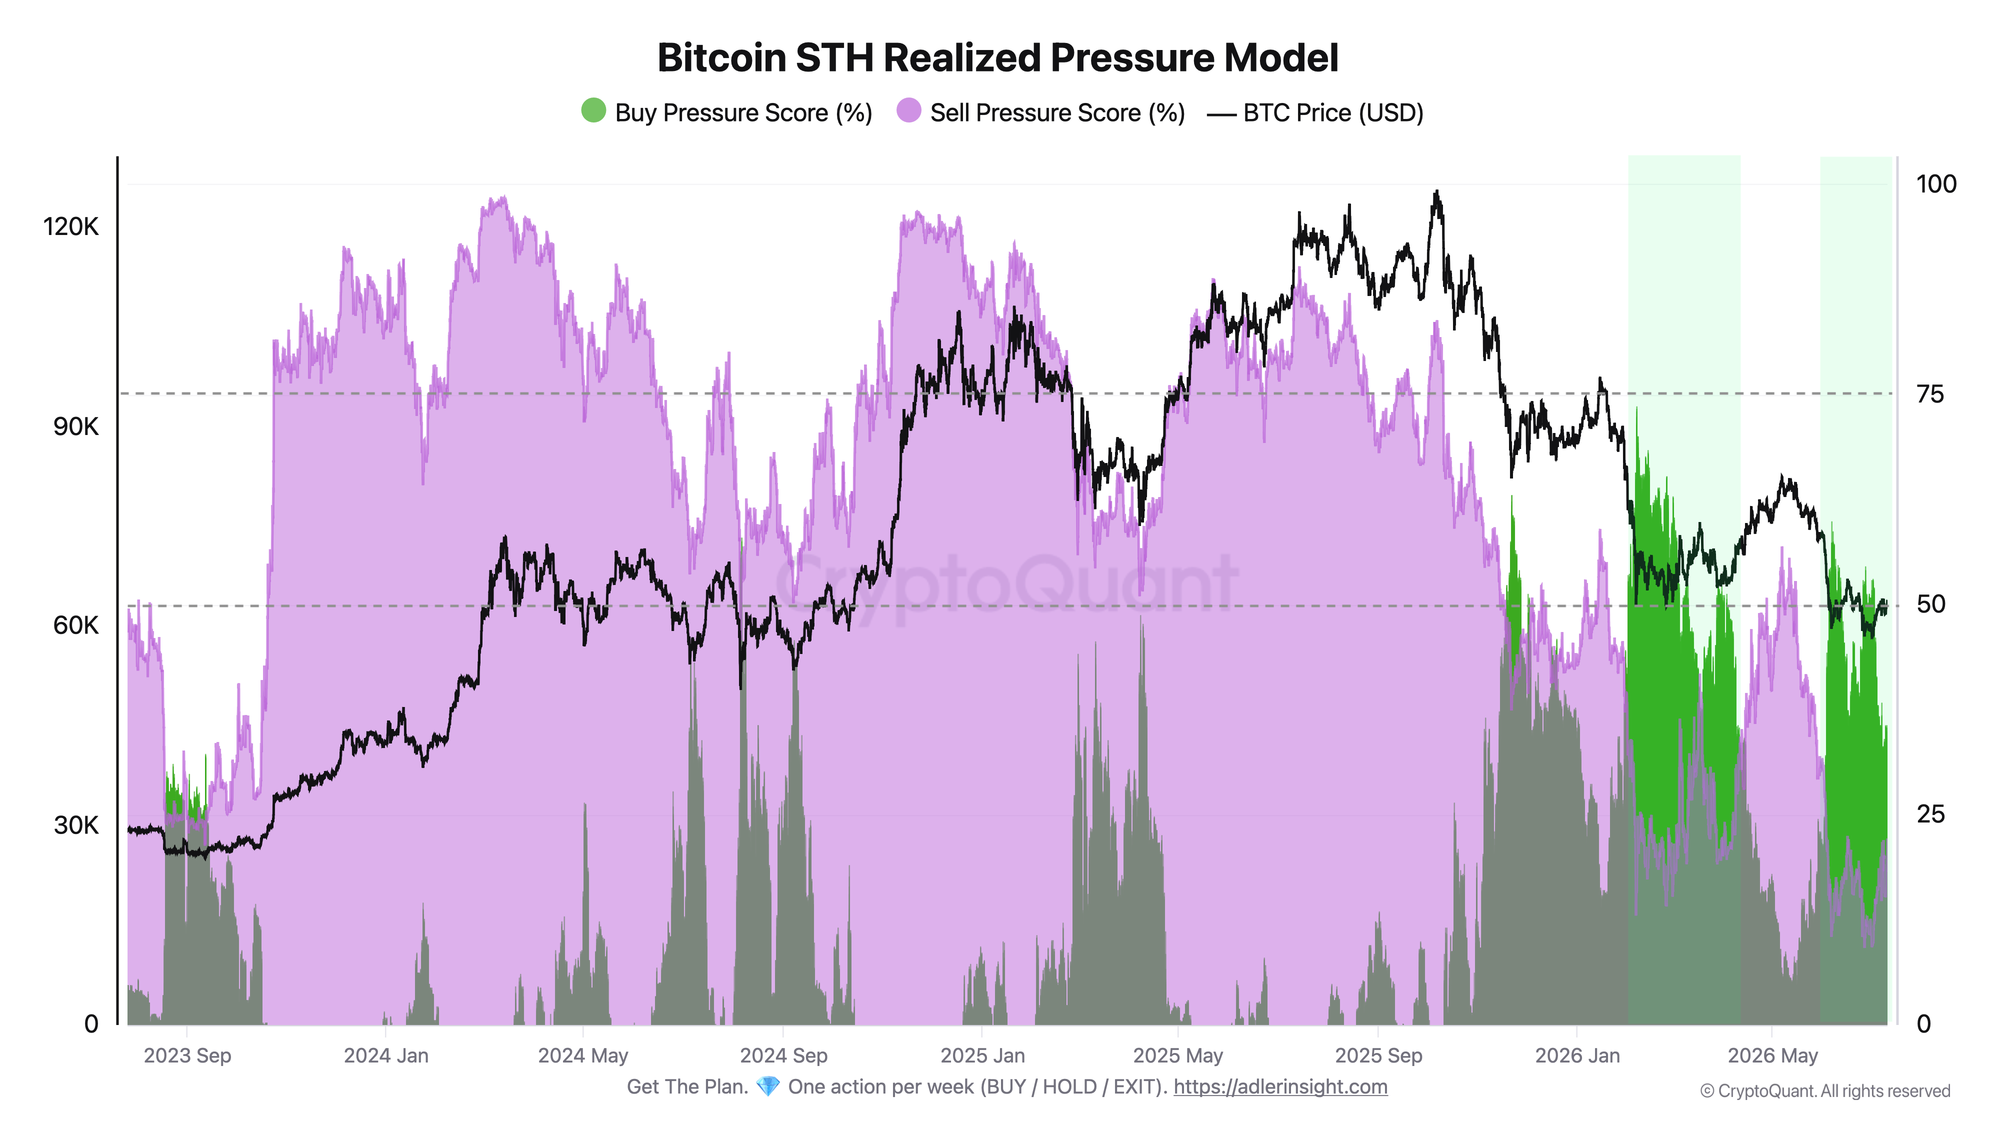
This metric compares the strength of realized buying and selling pressure from short-term holders relative to the current BTC price.
In February, when price fell to around ~$69K, buying pressure dominated with an average reading of about 61% versus ~22% for sellers. In May, as price approached ~$78K, the picture flipped in the opposite direction: sellers rose to ~43%, while buyers dropped to ~11%. In June and July, with price around $62-63K, buying pressure once again outweighs selling pressure at roughly 37-46%, while sellers are compressed to around ~16%. The latest reading also keeps buyers in the lead: about 30% versus 22%.
The model behaves in a countertrend way: buyers become more active at local lows, while sellers become more active at local highs. The current compression in selling pressure and the persistent lead in Buy Pressure Score point to an accumulation phase. A deterioration in the signal would be a return of seller pressure above buyer pressure as price rises.
Bitcoin STH Cost Basis Cohorts
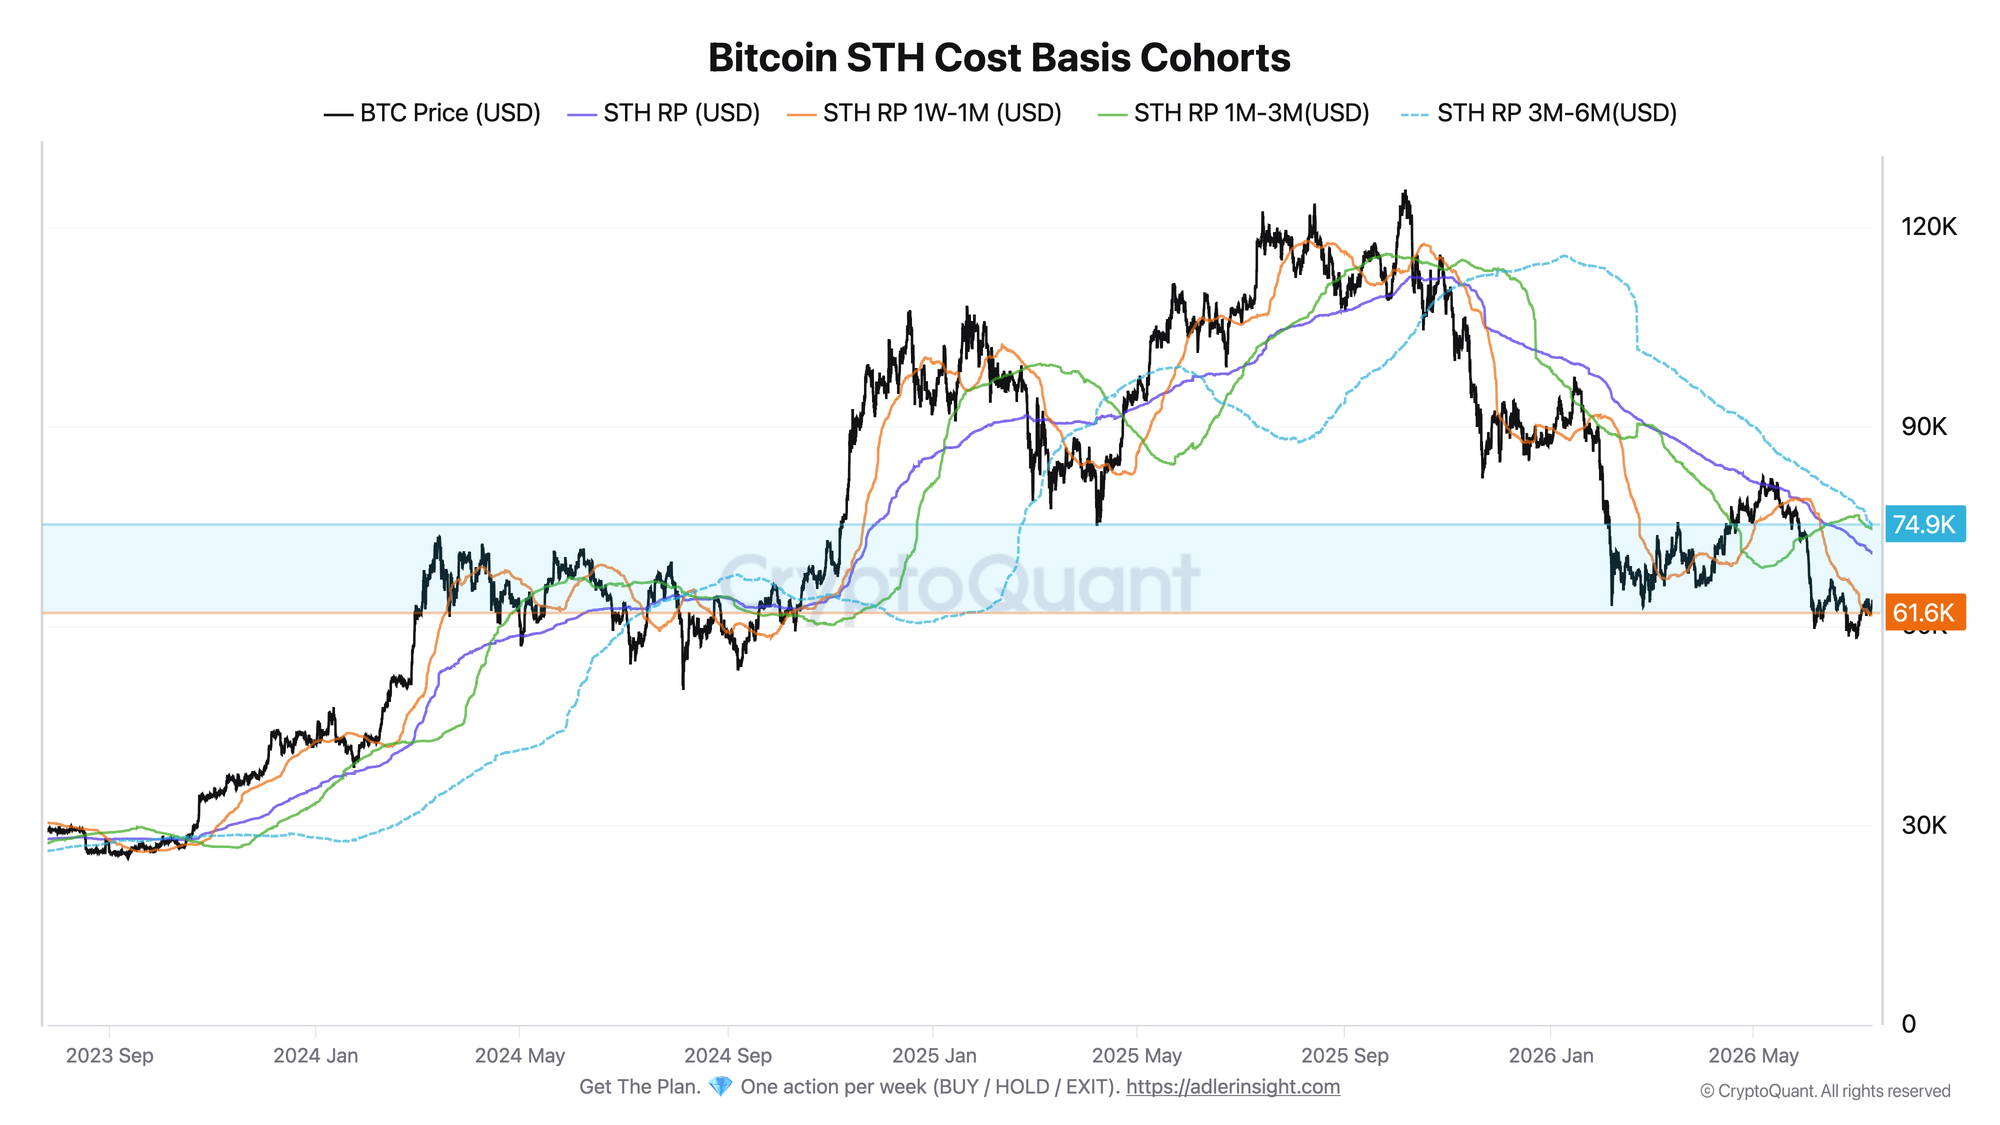
This metric breaks down the purchase price of short-term holders by age cohort, from the freshest, 1W-1M, to the older, 3M-6M.
Right now, the cohort range runs from the lower boundary at STH RP 1W-1M around $61.6K to the upper boundary at STH RP 3M-6M around $74.9K, with a total width of about 21%. Price at $63.9K is holding in the lower part of the range: about 4% above the Cost Basis of the freshest buyers and nearly 10% below the aggregate Cost Basis of short-term holders around $71K. The older 1M-3M and 3M-6M cohorts sit around $74.6-74.9K and remain underwater by roughly 14-15%.
Fresh buyers are still holding a small profit and are forming the nearest support, while the entire STH aggregate remains underwater. This is a typical zone where older short-term holders have already capitulated or are close to doing so. As long as the lower boundary at $61.6K holds, the demand structure remains intact. Losing that level would push even the freshest cohort underwater.
Both charts describe the same market state: compressed selling pressure in the realized pressure model coincides with price sitting at the Cost Basis of the freshest holders, which is where supply from weak hands has historically started to dry up. The key point right now is whether the lower boundary of the range holds while buyer dominance remains in place.
Protect capital first. Capture upside second - start 7 days free. Built for long-term investors who want performance, not stress.
FAQ
Why is buyer dominance at the lows a sign of accumulation rather than further downside?
The model measures realized pressure relative to price. A rise in Buy Pressure Score at the lows means short-term holders are realizing losses and passing coins into stronger hands. That is a sign of supply exhaustion, not confirmation of a fresh move lower.
What level separates the accumulation zone from a return to weakness?
The key lower boundary is the Cost Basis of the freshest cohort at around $61.6K. As long as price stays above it, near-term demand remains intact. The upper reference level is the aggregate STH Cost Basis around $71K. A move back above that level would materially reduce pressure from the older cohorts.
CONCLUSIONS
The combination of these two metrics paints a constructive, but still unfinished, picture: selling pressure has compressed to multi-month lows, buyers are dominating just as they did in February ahead of the recovery, and price is holding the lower boundary of the cohort range at the Cost Basis of the freshest holders. This is an accumulation zone with a moderate risk-on tilt. The main confirmation trigger is a reclaim of the aggregate STH Cost Basis around $71K. The main risk is a loss of the $61.6K lower boundary, which would push the last profitable cohort underwater and hand control back to sellers.
Live Charts
Explore the metrics behind this brief with live, auto-updating charts:
STH-SOPR - Short-term holder profit/loss behavior around the 1.0 breakeven threshold.
Realized Price - Aggregate on-chain cost basis compared with BTC price and long-term trend.
Supply in Loss - Share of supply held at a loss to flag stress and capitulation zones.
LTH vs STH Supply - Supply split between long- and short-term holders to track accumulation and distribution.
Holder Behavior - All holder profitability and supply-cohort charts in one view.