


🎧 Morning Brief #209 - audio debate
Since July 7, the BTC futures market has remained under sellers' control: cumulative buy delta has been shrinking, while net taker flow has stayed negative. A brief attempt by buyers to regain control on July 8 did not hold - it was fully overwhelmed by a single bearish wave of selling, after which price returned to the $62K area, losing about 3% over two days.
TL;DR
This brief explains why initiative in futures still remains with sellers despite a local rebound attempt. Cumulative buy delta is shrinking quickly, and any spike in demand is immediately absorbed. That confirms local weakness in buyer flow.
Bitcoin CVD and Perpetual Trade Volume
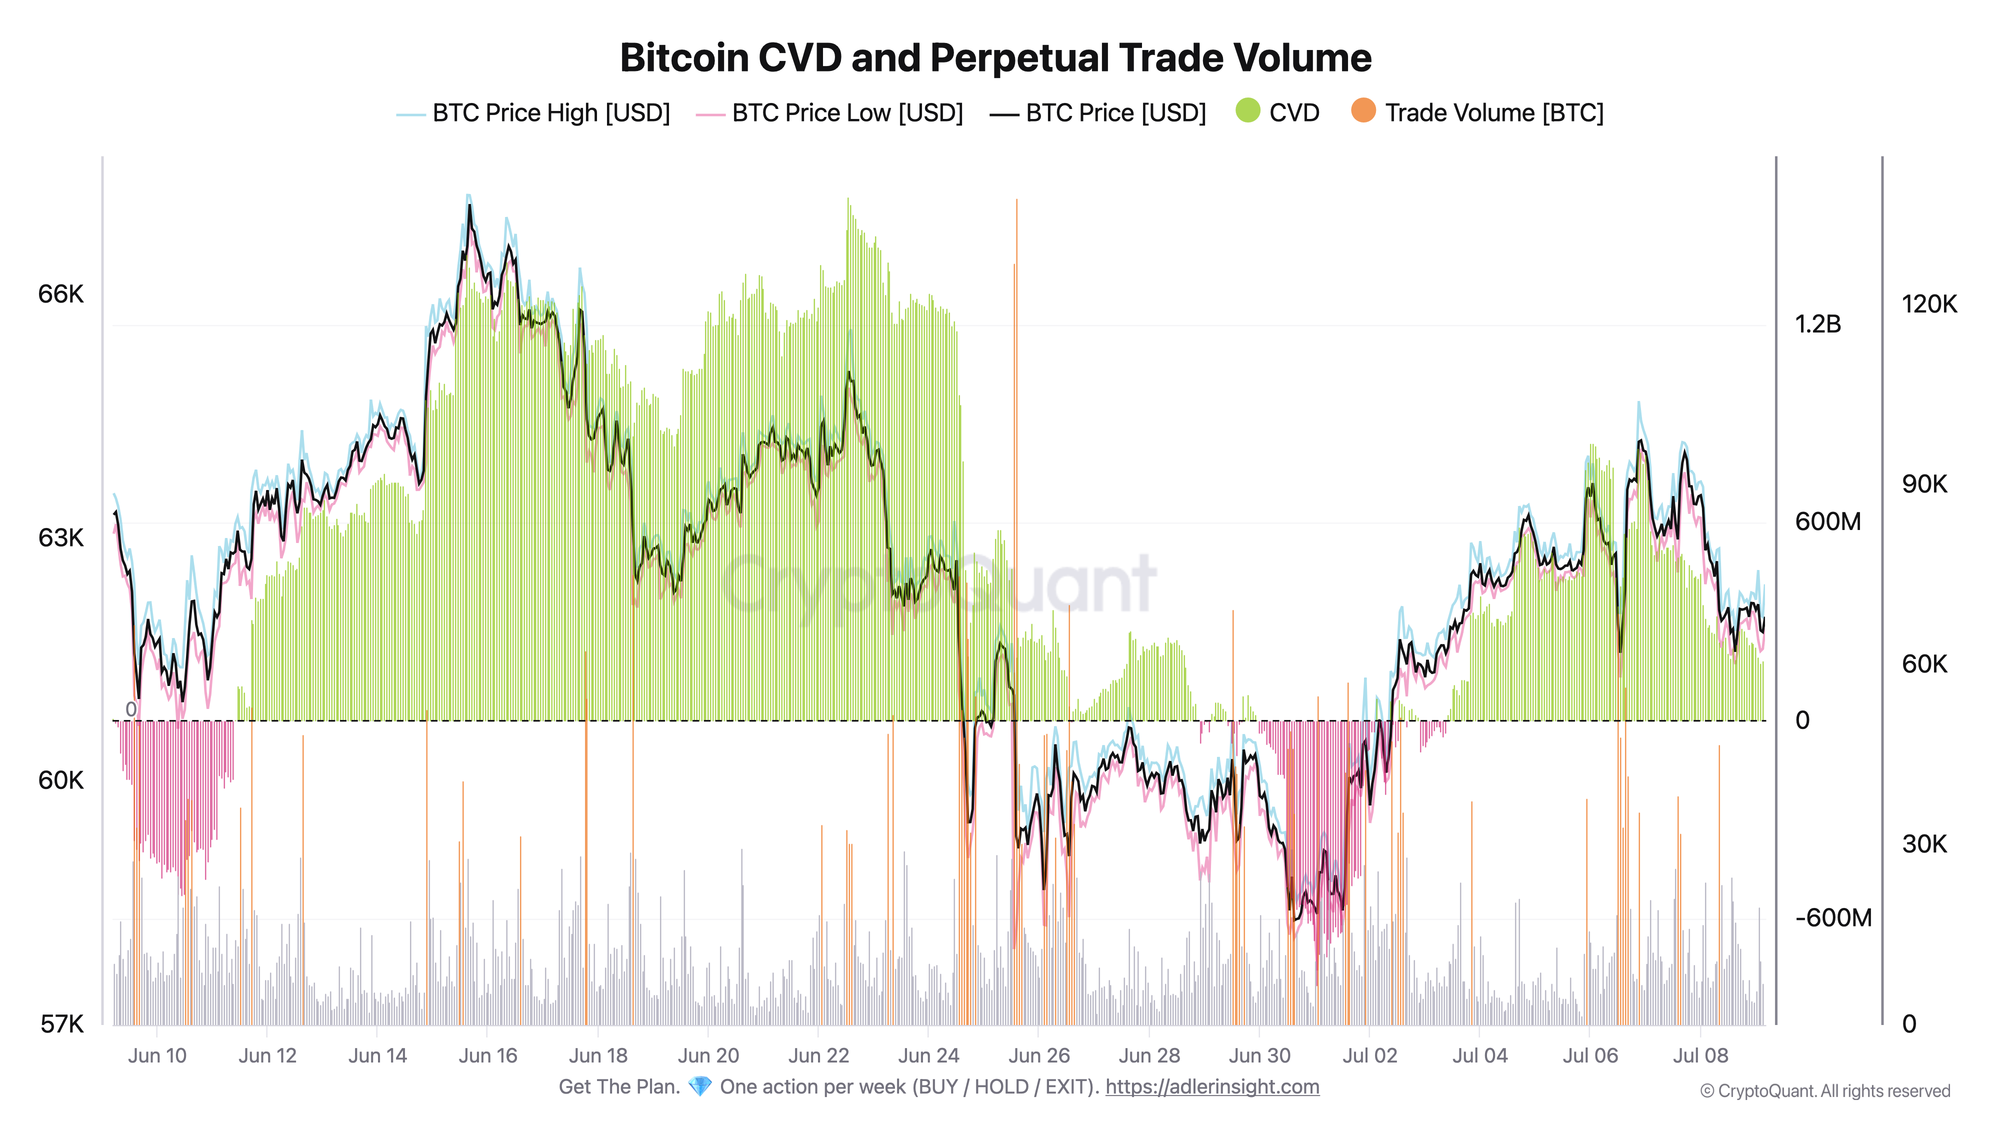
CVD is the cumulative delta of aggressive orders, meaning market buys minus market sells in perpetuals. The green zone above zero means buyers have held the advantage since the start of the window.
Throughout the second half of June and early July, CVD held firmly in positive territory. By July 7, cumulative buyer dominance had reached +$800M. From that peak, the indicator compressed to about +$230M - nearly 70%, or roughly -$580M, in just two days. Over the same period, price slipped from around $64K to around $62K. The green area on the right edge of the chart is visibly shrinking, while trading volume remains around average levels. That matters: the move lower is not happening on a panic flush, but on a steady shift in flow.
CVD is still positive, which means buyers remain cumulatively ahead since the start of the month. But the speed of that contraction and the synchronized drop in price show that momentum has already shifted to sellers. The main deterioration trigger is a move in CVD below zero. That would mean sellers have not only taken over the current flow, but have also fully erased buyers' accumulated edge.
Bitcoin Futures Pressure: Taker Flow
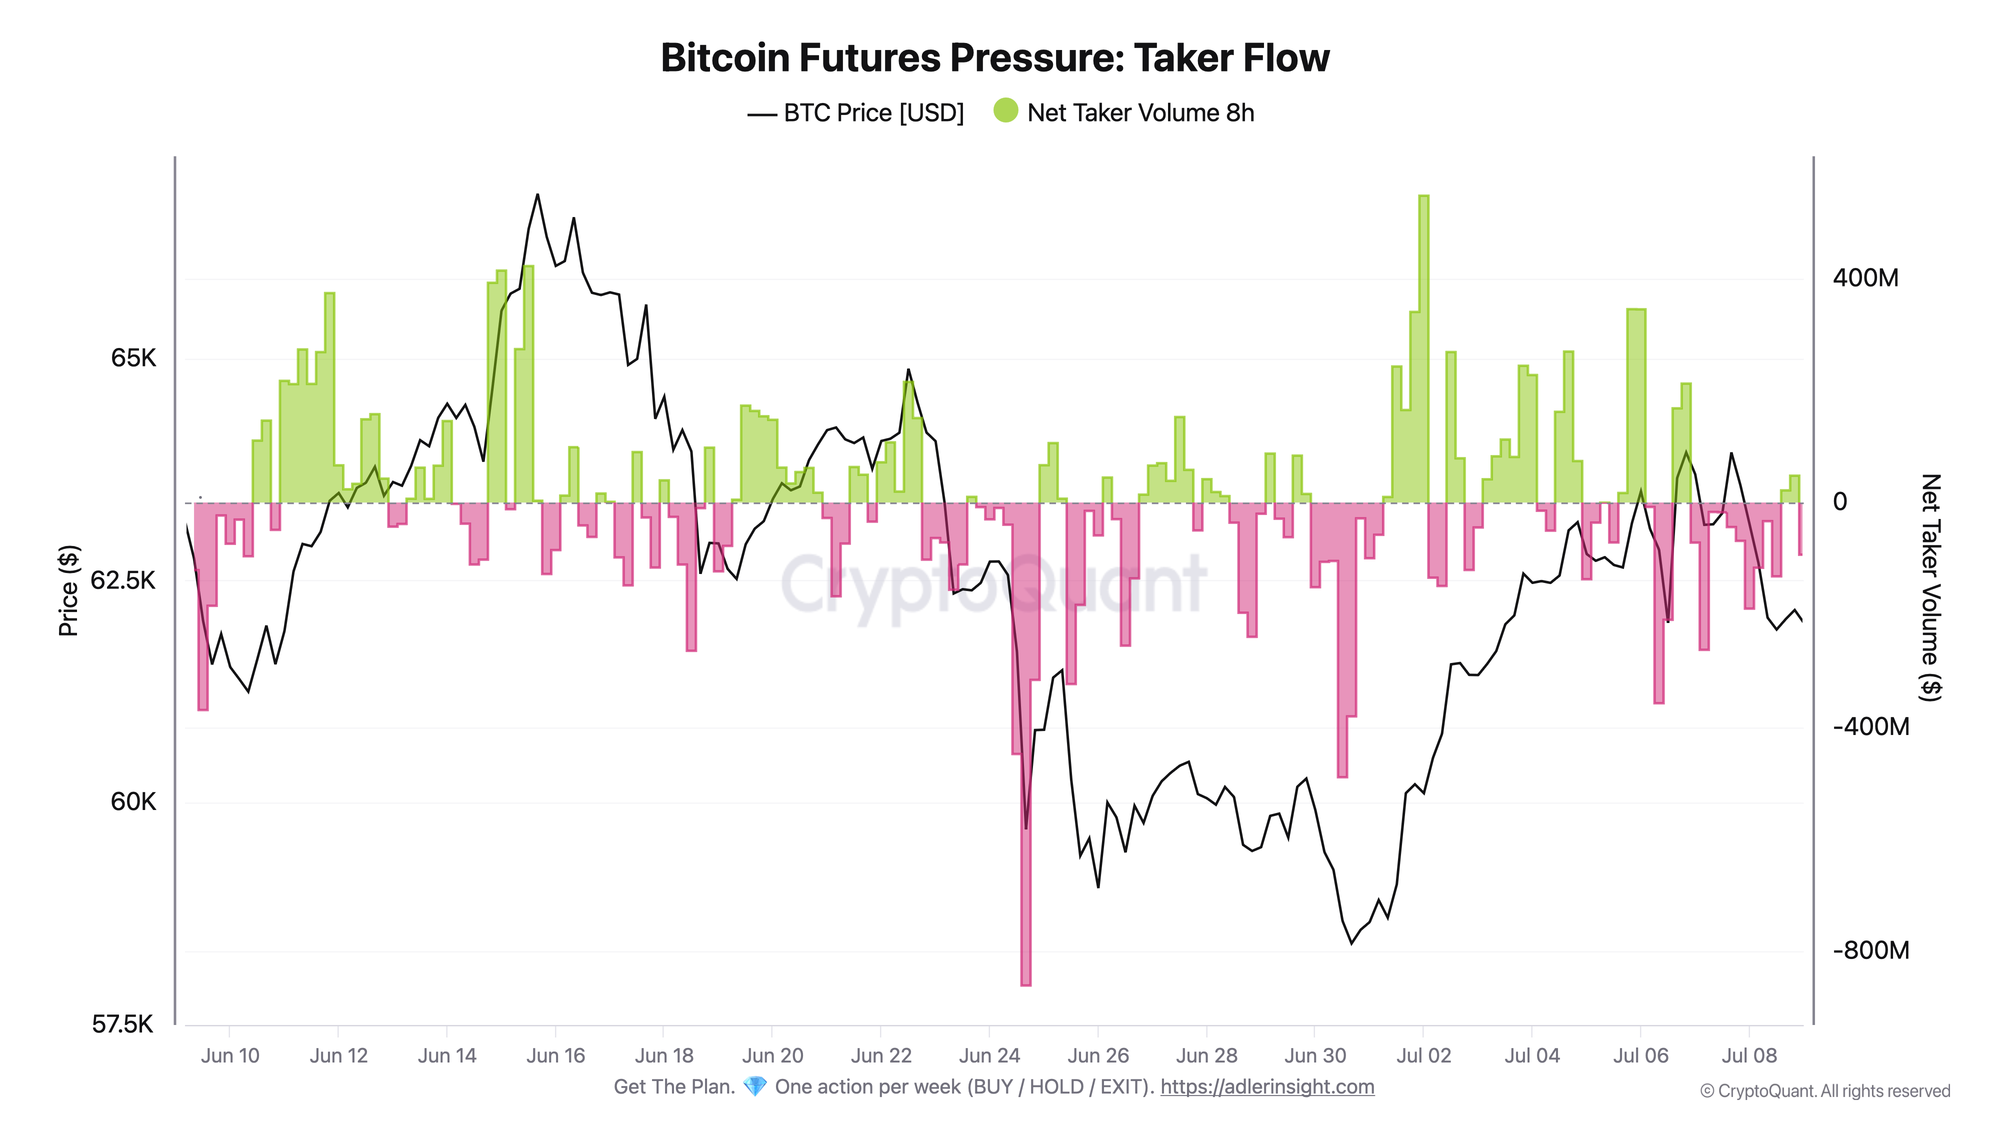
Net Taker Volume 8h is the net volume of aggressive trades over eight hours. Red bars below zero mean market sells are dominating over market buys.
Since July 7, 11 out of 13 four-hour intervals have been negative. The deepest sell waves reached -$262M on July 7 and -$188M on July 8, while price drifted from around $63.7K to around $62K. At one point on July 8, two green bars appeared in a row, at +$22M and +$48M. Buyers tried to regain control, but price barely moved and remained pinned around $62.1K. The very next interval on July 9 came in at -$92.7M - more than both green bars combined - and the rebound attempt was erased in just one hour.
That is the main signal here. Not the selling streak itself, but the failure of the buyer spike. Demand entered the market, but it could neither sustain the flow nor push price meaningfully higher. Sellers immediately took back control. This is classic risk-off positioning, where every attempt to buy the dip is quickly shut down by aggressive market sells.
The second chart explains why CVD on the first chart is compressing so quickly. The accumulated buy delta is not fading on its own - it is being systematically drained by persistent taker pressure. The failed rebound only confirms that buyers are still unable to reverse the flow. Both indicators point in the same direction: demand fuel in futures has weakened noticeably, and that is the main market signal right now.
Protect capital first. Capture upside second - start 7 days free. Built for long-term investors who want performance, not stress.
FAQ
Why is CVD still positive if sellers are dominating?
CVD sums delta from the start of the window, so the strong buyer imbalance built up in June and early July has not yet been fully unwound. What matters here is not only the absolute level, but also the direction. And that direction has already turned lower.
What would confirm a shift into a sustained bearish regime?
The key confirmation would be a move in CVD below zero while red taker flow remains in place and price holds below ~$62K. The fact that the double green spike failed to push the market higher already shows that the $62K area is now acting more like a ceiling than a zone of demand support.
CONCLUSIONS
Both charts point to the same conclusion: since July 7, takers have been pushing the market lower, draining accumulated buy delta. Over two days, CVD contracted by nearly 70%, price fell by 3%, and every attempt to buy the dip was quickly absorbed. The brief double green spike on July 8 was fully erased by a -$92.7M sell wave in just one hour. The current regime is risk-off: initiative remains with sellers, and there is still no sign of stable demand strong enough to support a move higher. The main trigger for further deterioration is a move in CVD below zero alongside price holding below ~$62K.
Live Charts
Explore the metrics behind this brief with live, auto-updating charts:
Funding Rates - Perpetual futures funding to track long-side or short-side leverage pressure.
Open Interest (BTC) - Total futures positioning and 7-day BTC-denominated change.
Coinbase Premium Index - Coinbase vs global market premium as a proxy for US spot demand pressure.
Fear & Greed Index - Composite market sentiment for risk appetite and sentiment extremes.
Derivatives - All funding, open-interest, and leverage charts in one view.