
🎧 Morning Brief #103 - audio debate on today’s market setup
The Bitcoin network is experiencing a wave of loss-taking comparable in scale to the Luna/UST crash in June 2022. Net Realized Profit/Loss has dropped to -$1.73B (7DMA), while Realized Loss has reached $2.3B - levels that in the previous cycle accompanied capitulation and the beginning of bottom formation. But there is a fundamental difference: back then the price was $19K, now it is $67K.
TL;DR
Realized losses on the Bitcoin network have reached Luna 2022 crash levels, however the price context is fundamentally different - the current sell-off is occurring at $67K, not $19K, which changes the interpretation of the signal.
Bitcoin Net Realized Profit/Loss
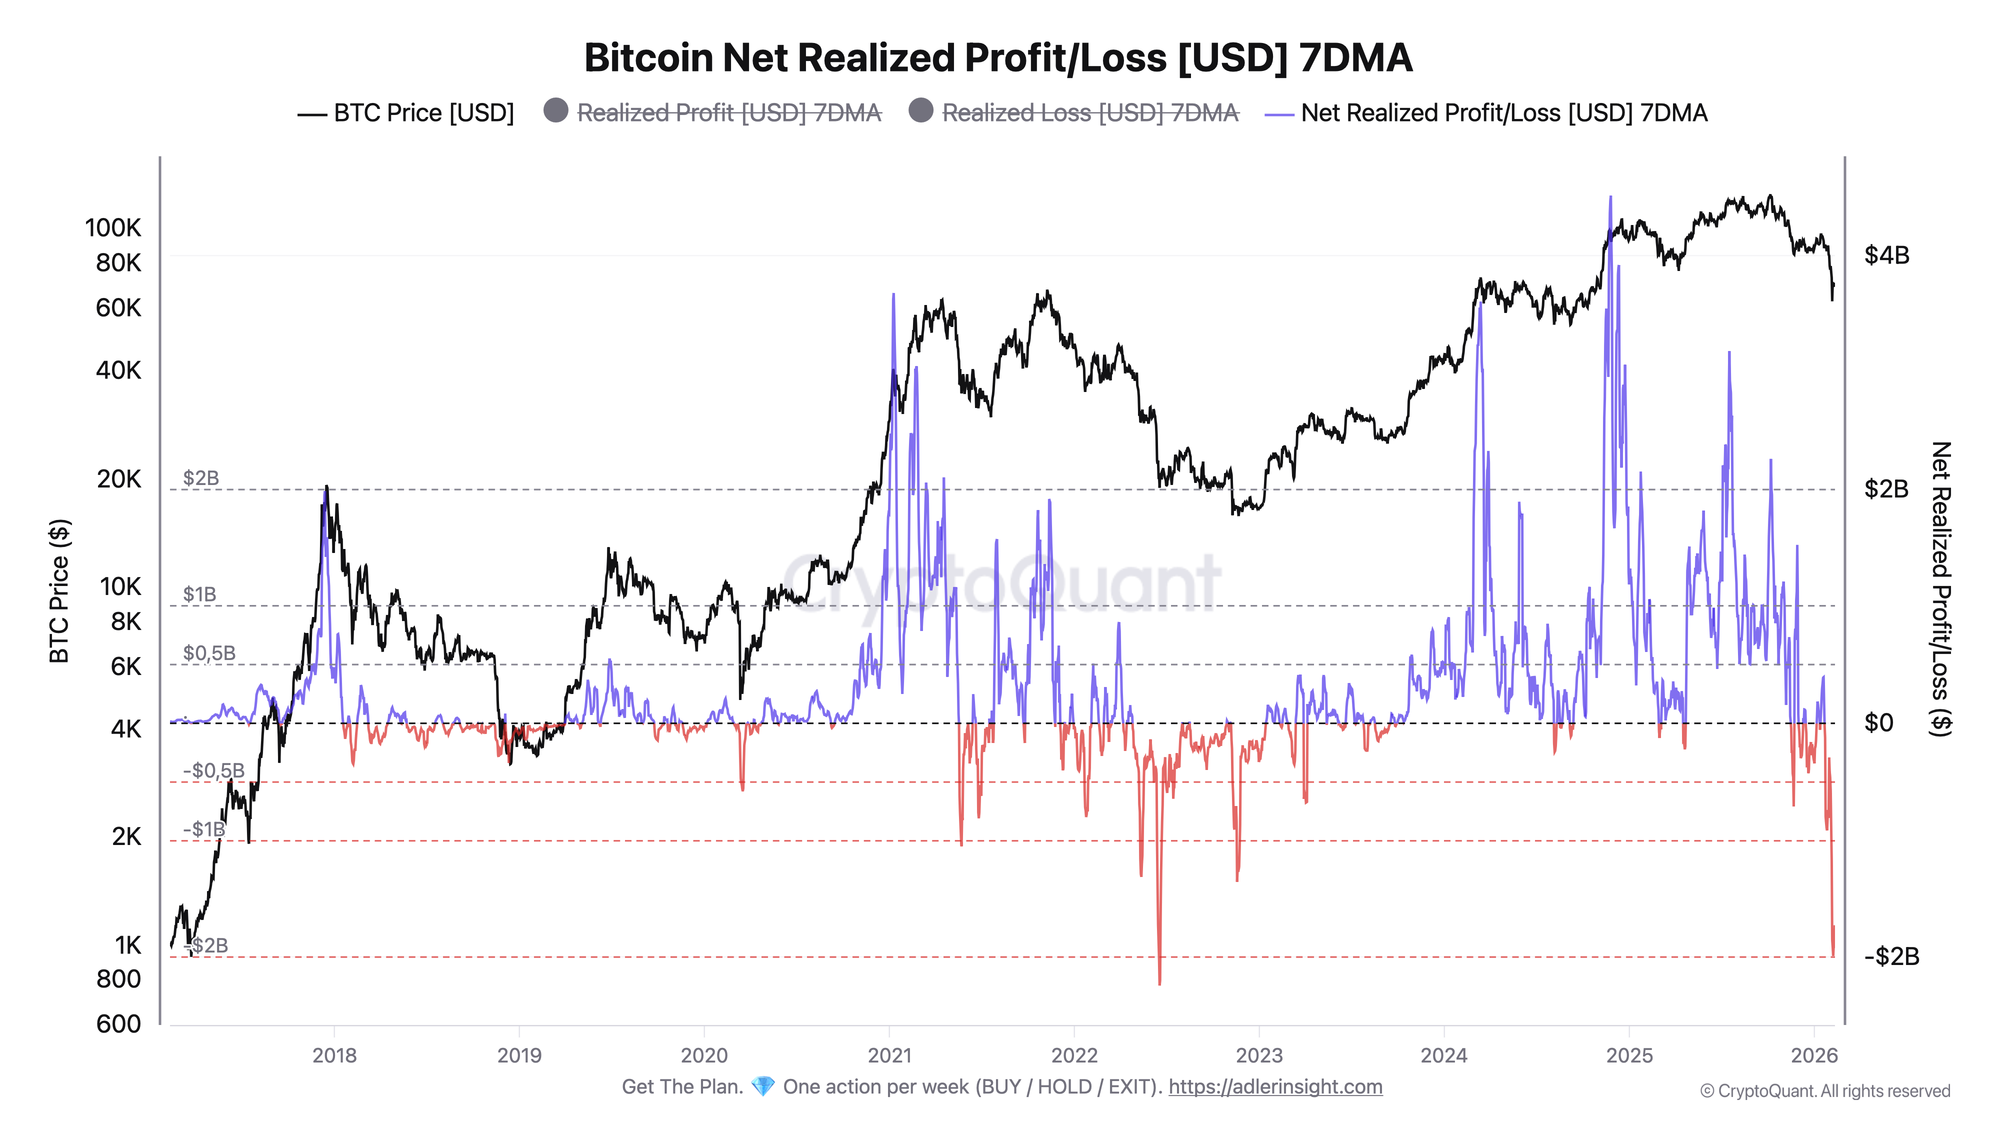
The metric reflects the difference between realized profit and realized losses of all moved coins, smoothed over 7 days.
Net Realized Profit/Loss (7DMA) dropped to -$1.99B on February 7, then slightly recovered to -$1.73B by February 10. This is the second deepest negative reading in the entire history of observations - worse was only June 18, 2022, when the metric reached -$2.24B amid the Luna/UST crash and cascading liquidations. It is important to note that the net loss has remained below -$1.7B for the fifth consecutive day, forming a sustained cluster of seller pressure.
The depth and duration of the current negative regime point to massive capitulation of participants who bought coins at higher levels. The key reversal trigger is the return of Net Realized Profit/Loss above zero, which would signal the market's transition from loss dominance to profit dominance. As long as the metric remains in deeply negative territory, seller pressure persists.
Bitcoin Realized Loss
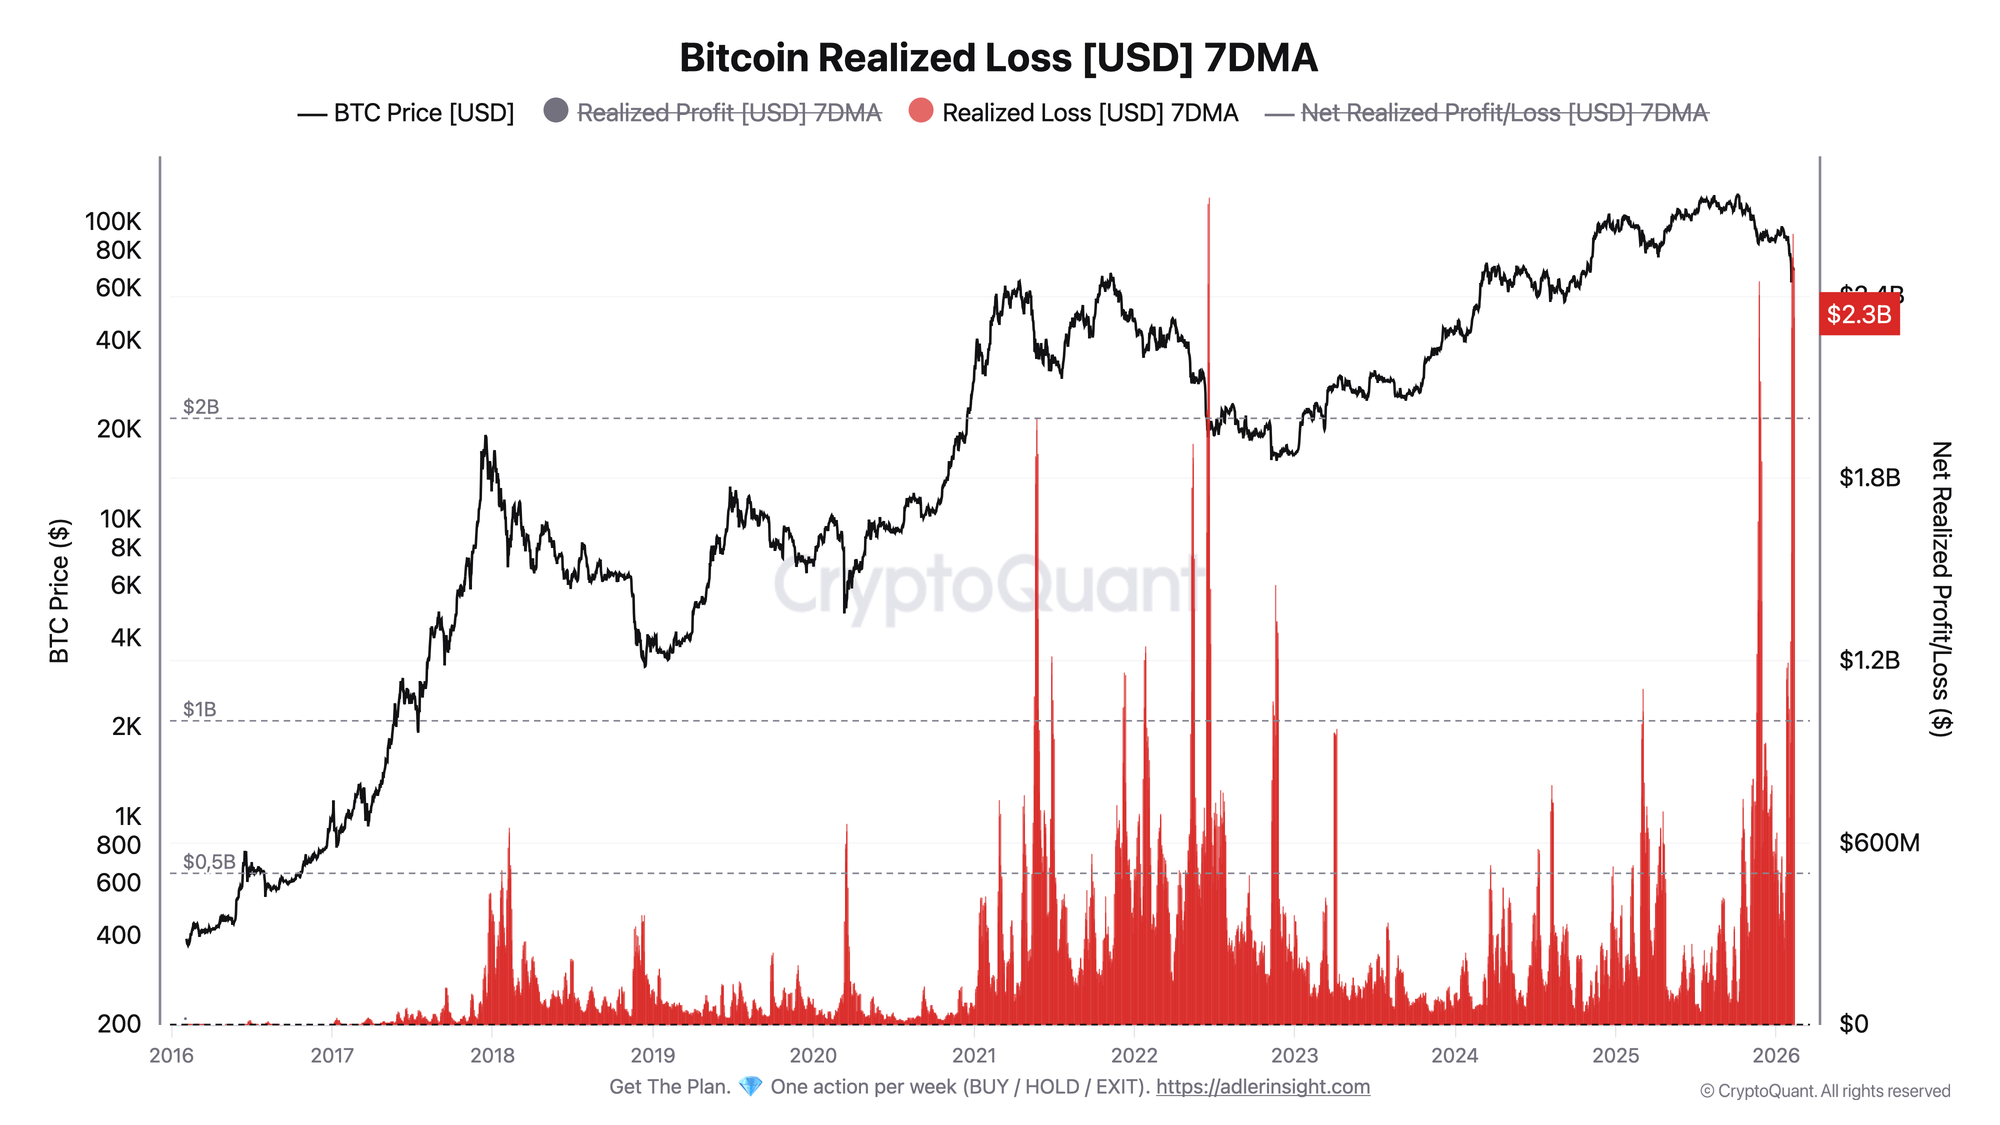
The metric shows the total volume of losses locked in on-chain when coins purchased at higher prices are moved.
Realized Loss (7DMA) rose to $2.3B on February 7 and remained near this level through February 10. This is one of the highest smoothed levels in the entire history of observations, comparable to June 2022 amid the Luna/UST crash and cascading liquidations. It is important to understand that these are smoothed weekly figures that spread out peak stress - at the height of the crash, single-day losses were roughly 3 times higher. The absolute scale of loss-taking is extreme.
However, the context is fundamentally different from 2022. Back then, Realized Loss at $2.7B was occurring at a price of $19K. Now, comparable loss volumes are being locked in at a price of $67K, which suggests not a systemic crash but rather a flushing out of late bull-cycle entries. This is capitulation of local top buyers, not a fundamental loss of network value.
Together, the two charts paint a picture of extreme but potentially cleansing stress. The scale of losses is comparable to the Luna crash, but the nature is entirely different - the market is working through a 35% correction from the all-time high, not a structural ecosystem collapse.
Narratives change faster than portfolios.
The 7-layer Bitcoin analytics system replaces opinions with a rules-based playbook you can actually execute → Unlock the full Bitcoin playbook and weekly signals - free for 7 days.
FAQ
Why is the comparison with the Luna crash valid only in scale, but not in substance?
In June 2022, the Luna/UST crash triggered a cascade of forced liquidations, fund bankruptcies (3AC, Celsius), and a systemic crisis of confidence. Bitcoin's price was at $19K - near the previous 2017 cycle high. Current losses are occurring at $67K after a pullback from $125K, reflecting a routine correction within a bear cycle, not a paradigm shift.
What Net Realized Profit/Loss level signals the end of the capitulation phase?
Historically, a sustained return of Net Realized Profit/Loss (7DMA) above the zero line with subsequent holding in positive territory for several consecutive weeks marks the transition from capitulation to recovery. It is also important to monitor the dynamics of Realized Loss itself - its decline below $1B (7DMA) would indicate fading seller pressure.
CONCLUSIONS
The Bitcoin network is generating losses at levels observed only during the most acute crisis episodes - the Luna crash and the FTX collapse. Net Realized Profit/Loss (7DMA) at -$1.73B and Realized Loss at $2.3B are comparable in absolute scale to June 2022, while the single-day loss on February 5 ($6.05B) became the second largest in Bitcoin's entire history. Nevertheless, the current phase is a correction within a bear market at $67K, not a structural collapse at $19K. This changes the interpretation: we are observing the flushing out of late buyers, not a systemic market crisis. The improvement trigger is the return of Net Realized Profit/Loss above zero and a decline in Realized Loss below $1B. The main risk is that if losses continue to grow amid further price decline below $60K, this could turn the correction into full-blown capitulation.