
🎧 Morning Brief #105 - audio debate on today’s market setup
Bitcoin is in a sustained downtrend: from $125,000 in October last year to $66,400 today - a 47% decline over four months. Two on-chain levels form a key support zone that the market is approaching from opposite directions: Realized Price moving down from above, LTH Cost Basis rising from below. If current rates hold, within a quarter they will converge into a critical corridor - potentially the last structural support zone before a deeper bear phase.
TL;DR
The market is falling, but long-term support remains intact: LTH Cost Basis is rising (~$38.2K), Realized Price is declining (~$55.0K), and at current rates they will form a critical corridor of $43K-$51K within a quarter. As long as price holds above Realized Price ($54.9K), the structure holds.
Bitcoin On-chain Cost Basis vs Price Models
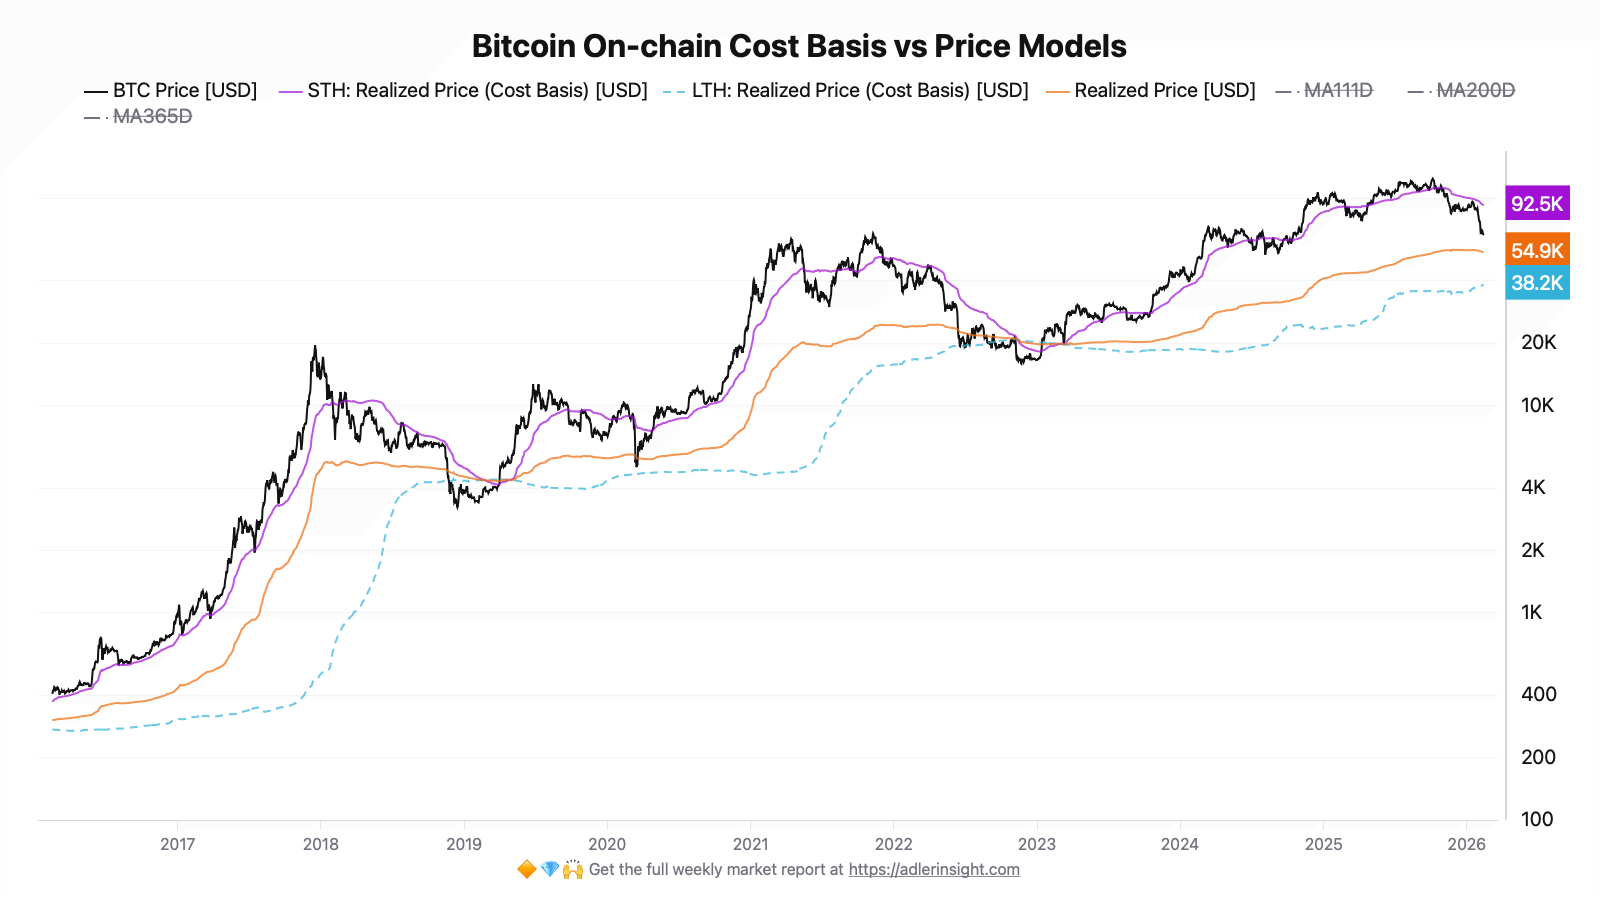
The metric displays three cost basis levels: Realized Price (aggregate on-chain cost basis of the entire market), STH Cost Basis (short-term holders), and LTH Cost Basis (long-term holders).
Today BTC trades at $66,399 - 17.2% above Realized Price ($54,951) and 28.2% below STH Cost Basis ($92,520). LTH Cost Basis sits well below the market at $38,216. Short-term holders are deeply underwater: their cost basis is $26,100 above the current price. This is a classic bear market configuration in which Realized Price serves as the nearest significant support, and LTH Cost Basis as a deeper but structurally important level.
As long as price holds above Realized Price ($54,951), the model does not enter capitulation territory. Sustained closes below this level have historically coincided with a phase of realized losses across the entire network - the point at which a bear market receives on-chain confirmation of capitulation.
Bitcoin On-chain Cost Basis - 7-day Rate of Change
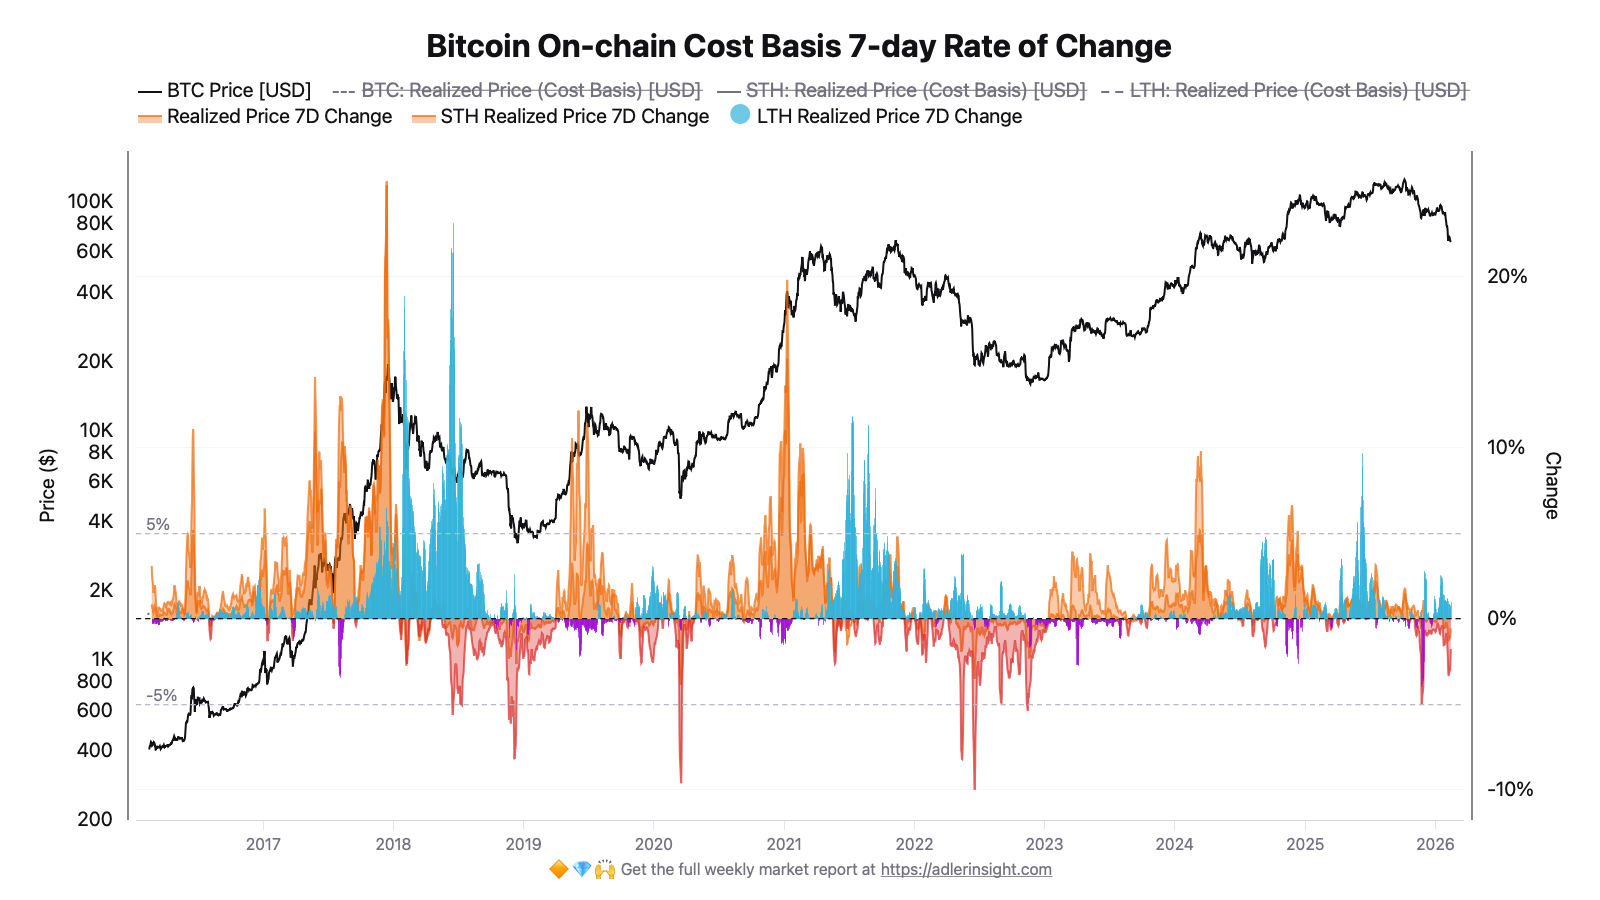
The metric displays the weekly rate of change (in %) for three cost basis levels: Realized Price, STH and LTH Cost Basis. This allows assessment of not only current levels but the speed at which each is moving.
The LTH Cost Basis rate of change currently stands at +0.96% per week - LTH Cost Basis is moving upward and at its current trajectory reaches approximately $43,223 over a quarterly horizon. Realized Price, by contrast, is declining at -0.55% per week and at the same pace reaches approximately $51,157 over a quarterly horizon. As a result, over the quarter the corridor between the two levels will narrow from the current $16,736 to approximately $7,934 - the long-term support zone is compressing.
This is not a signal for immediate action - it is a roadmap: within a quarter the $43K-$51K corridor will become a critical zone, below which the probability of a deeper bear phase increases. If STH Cost Basis continues declining at -1.77% per week, short-term pressure will persist - but it is LTH and Realized Price that define the long-term boundaries.
Taken together, both charts paint the following picture: the market is declining and approaching Realized Price as the first structural level, while LTH Cost Basis remains the next, deeper line of defense. The key question is whether $54,951 will hold as support, or whether the market will continue moving toward the $43K-$51K zone.
💡
Know what to do next week - start free.
If signals conflict, risk steps down by rule.
Weekly Engine (BUY/HOLD/EXIT) + Sunday drop: Trader’s Evidence (1-page for active traders).
FAQ
Why is the $38K-$55K corridor considered critical?
$55K is the Realized Price today - the average cost basis of all coins in the network. When price drops below it, the majority of market participants are at a loss - historically a marker of a serious bear market, not merely a correction. $38K is the LTH Cost Basis today - the cost basis of long-term holders who have not sold for years. A test of this level means that even the "strong hands" are approaching a pressure point. The corridor between them is the zone where the key question gets answered: does the correction end here, or does the market enter a deep bear phase.
What level is the nearest trigger for scenario deterioration?
The nearest trigger is $54,951 (Realized Price today). A single breakdown is not critical: what matters is whether price stays below this level for several consecutive weeks. If it does - this signals that the average network participant is realizing losses rather than waiting for recovery. Precisely this dynamic has historically confirmed the transition from a correction into a prolonged bear market.
CONCLUSIONS
Both indicators point to the same conclusion: the market is moving lower, but the long-term structure has not yet broken. Realized Price (-0.55% per week) and LTH Cost Basis (+0.96% per week) are converging, and at current rates will form a corridor of approximately $43,223-$51,157 within a quarter - a historically significant zone where the question of transition to a deeper bear market phase is often decided. The current regime is bearish with a downside bias: price is above Realized Price, structure is holding, but pressure is building. The primary risk is a move below $54,951, which would open the path to testing the $43K-$51K zone ahead of the projected timeline.