
The Net Pressure Tilt indicator, measuring the ratio of buying and selling pressure among short-term holders, has dropped into the bottom 5% of its three-year distribution. The current level indicates a phase of equilibrium between buyers and sellers.
TL;DR
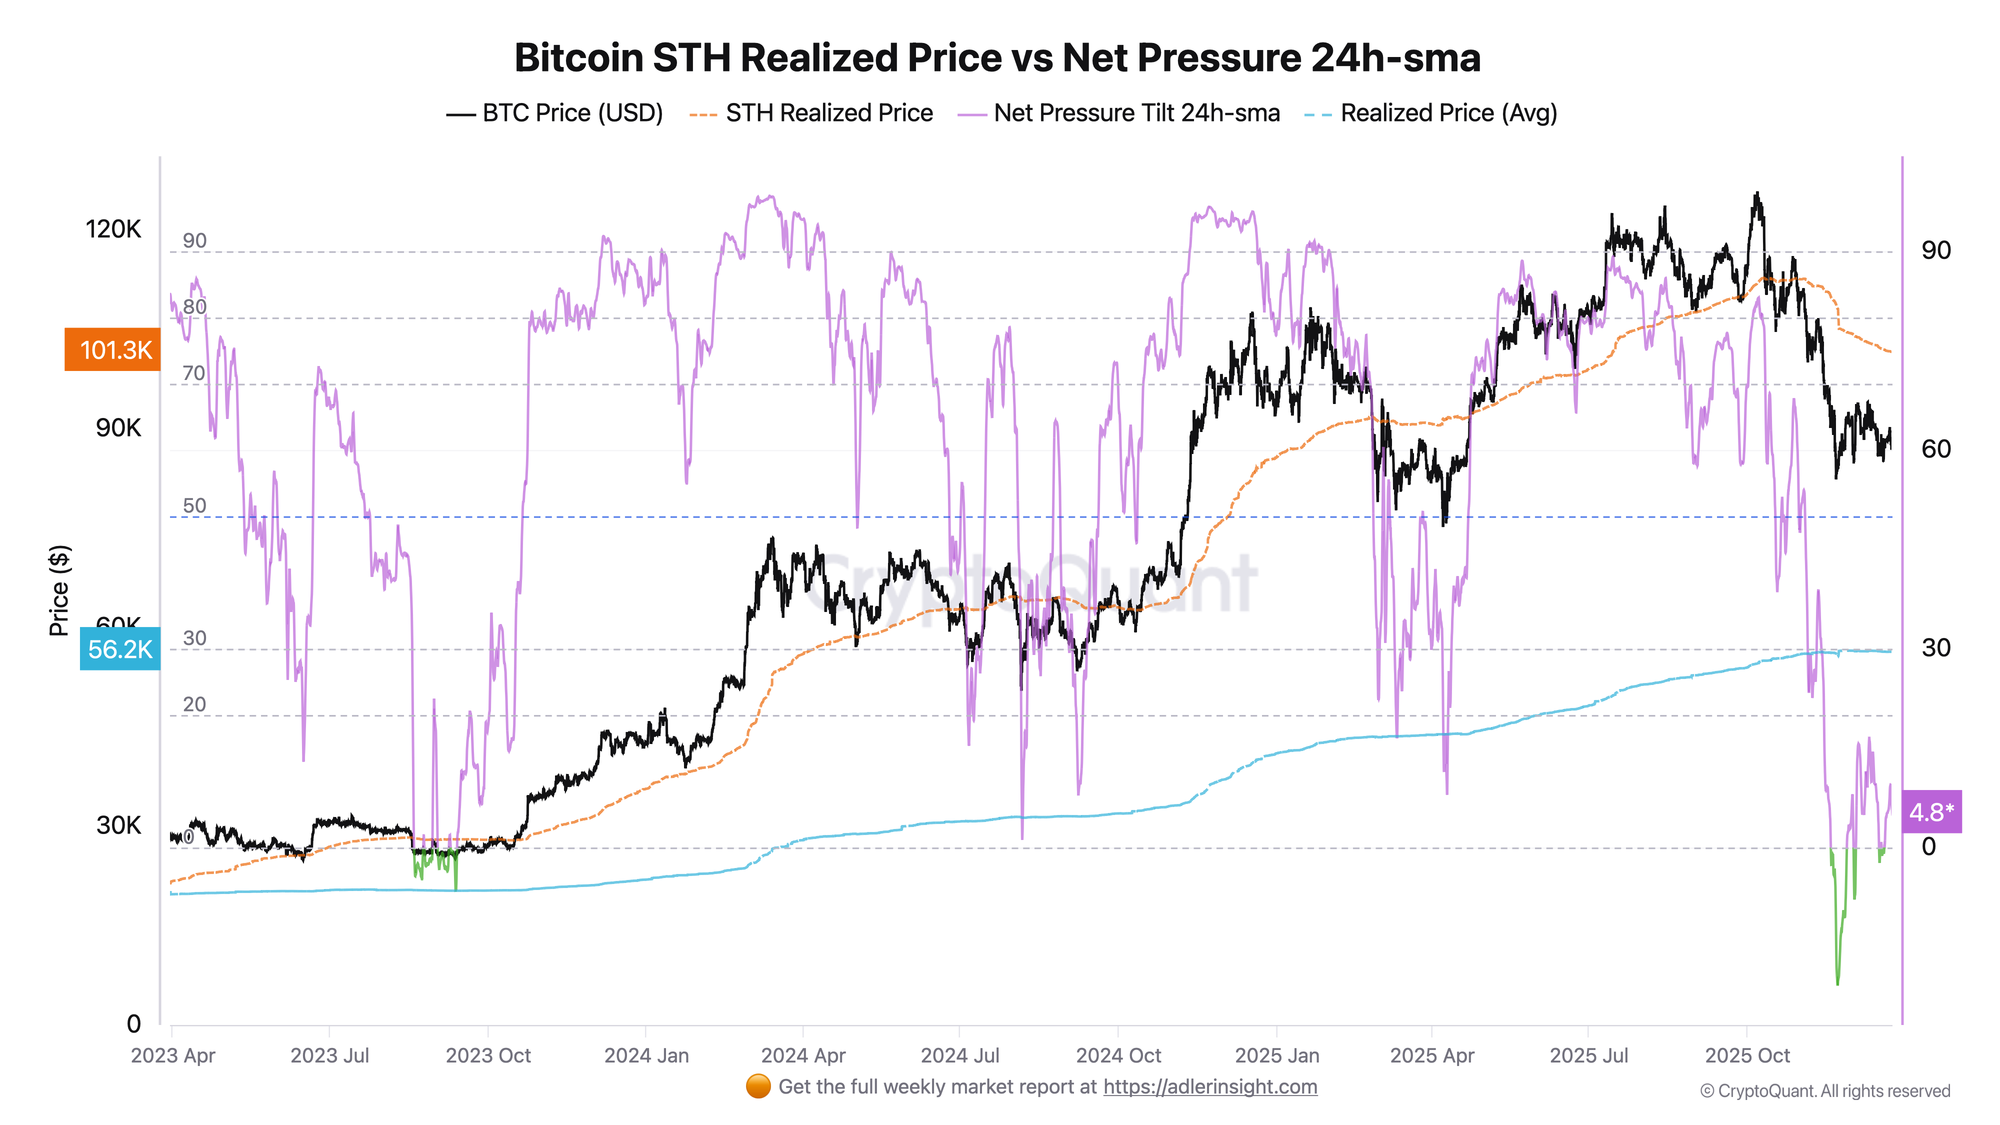
Short-term holder Net Pressure has dropped into the bottom 5% of its distribution. Price is trading below STH Realized Price, leading to equalization of buying and selling pressure.
Bitcoin STH Net Pressure (Buy vs Sell)
The Net Pressure Tilt indicator is calculated as the difference between weighted selling pressure and buying pressure of short-term holders. Positive values indicate prevailing selling pressure, negative values indicate buying pressure.
The current Net Pressure 24h MA value is 4.79 at a price of $87,324. The median indicator value over three years is 73.17, indicating typical selling pressure dominance during growth periods. Values below 10 occur in only 5.8% of observations. Over the past month, the indicator ranged from −13.30 to +16.66, spending 75.5% of the time above zero (sell pressure), but with minimal intensity.
The neutral zone (Net Pressure from -10 to +10) is a rare market state, occurring in only 5.8% of all three-year observations, and indicates a phase of equilibrium between buyers and sellers.

FAQ
Why is Net Pressure near zero a rarity? In a typical bull market, price trades above the realized prices of short-term cohorts, creating sustained selling pressure (profit-taking). In corrections, price drops below these levels, generating buying pressure (accumulation). Balance occurs at transitional points when the market is determining direction — this state is unstable and typically resolves with a directional move.
What trigger will determine the exit from the neutral zone? Price returning above STH Realized Price ($101,382) will switch the indicator to sell pressure mode and confirm restoration of bullish structure. A drop below November lows ($84,000) with Net Pressure deepening into negative territory (below -15) will indicate continued correction. Current discount to STH RP is 13.9%.
CONCLUSIONS
The market indicates a balance between buying and selling pressure among short-term holders. Historically, such equilibrium periods are unstable and in bull markets more often resolved toward growth, transitioning back to sell pressure mode. However, the current context is complicated by price trading 13.9% below STH Realized Price for almost two months, with short-term holders in loss and the market having transitioned into a bearish phase. Pressure below $85,000 with Net Pressure below -15 will indicate deepening correction.