


The 30-day net flow of stablecoins moved above zero for the first time since May, but the positive momentum is already weakening. At the same time, SSR is declining from its August peak and all three oscillators remain positive, so a full liquidity reversal has not yet occurred.
TL;DR
The prolonged period of stablecoin outflows from exchanges has ended, but a sustained inflow has yet to form. SSR is also improving, although the combined signal remains neutral rather than bullish.
Bitcoin: Stablecoin Supply Ratio (SSR)
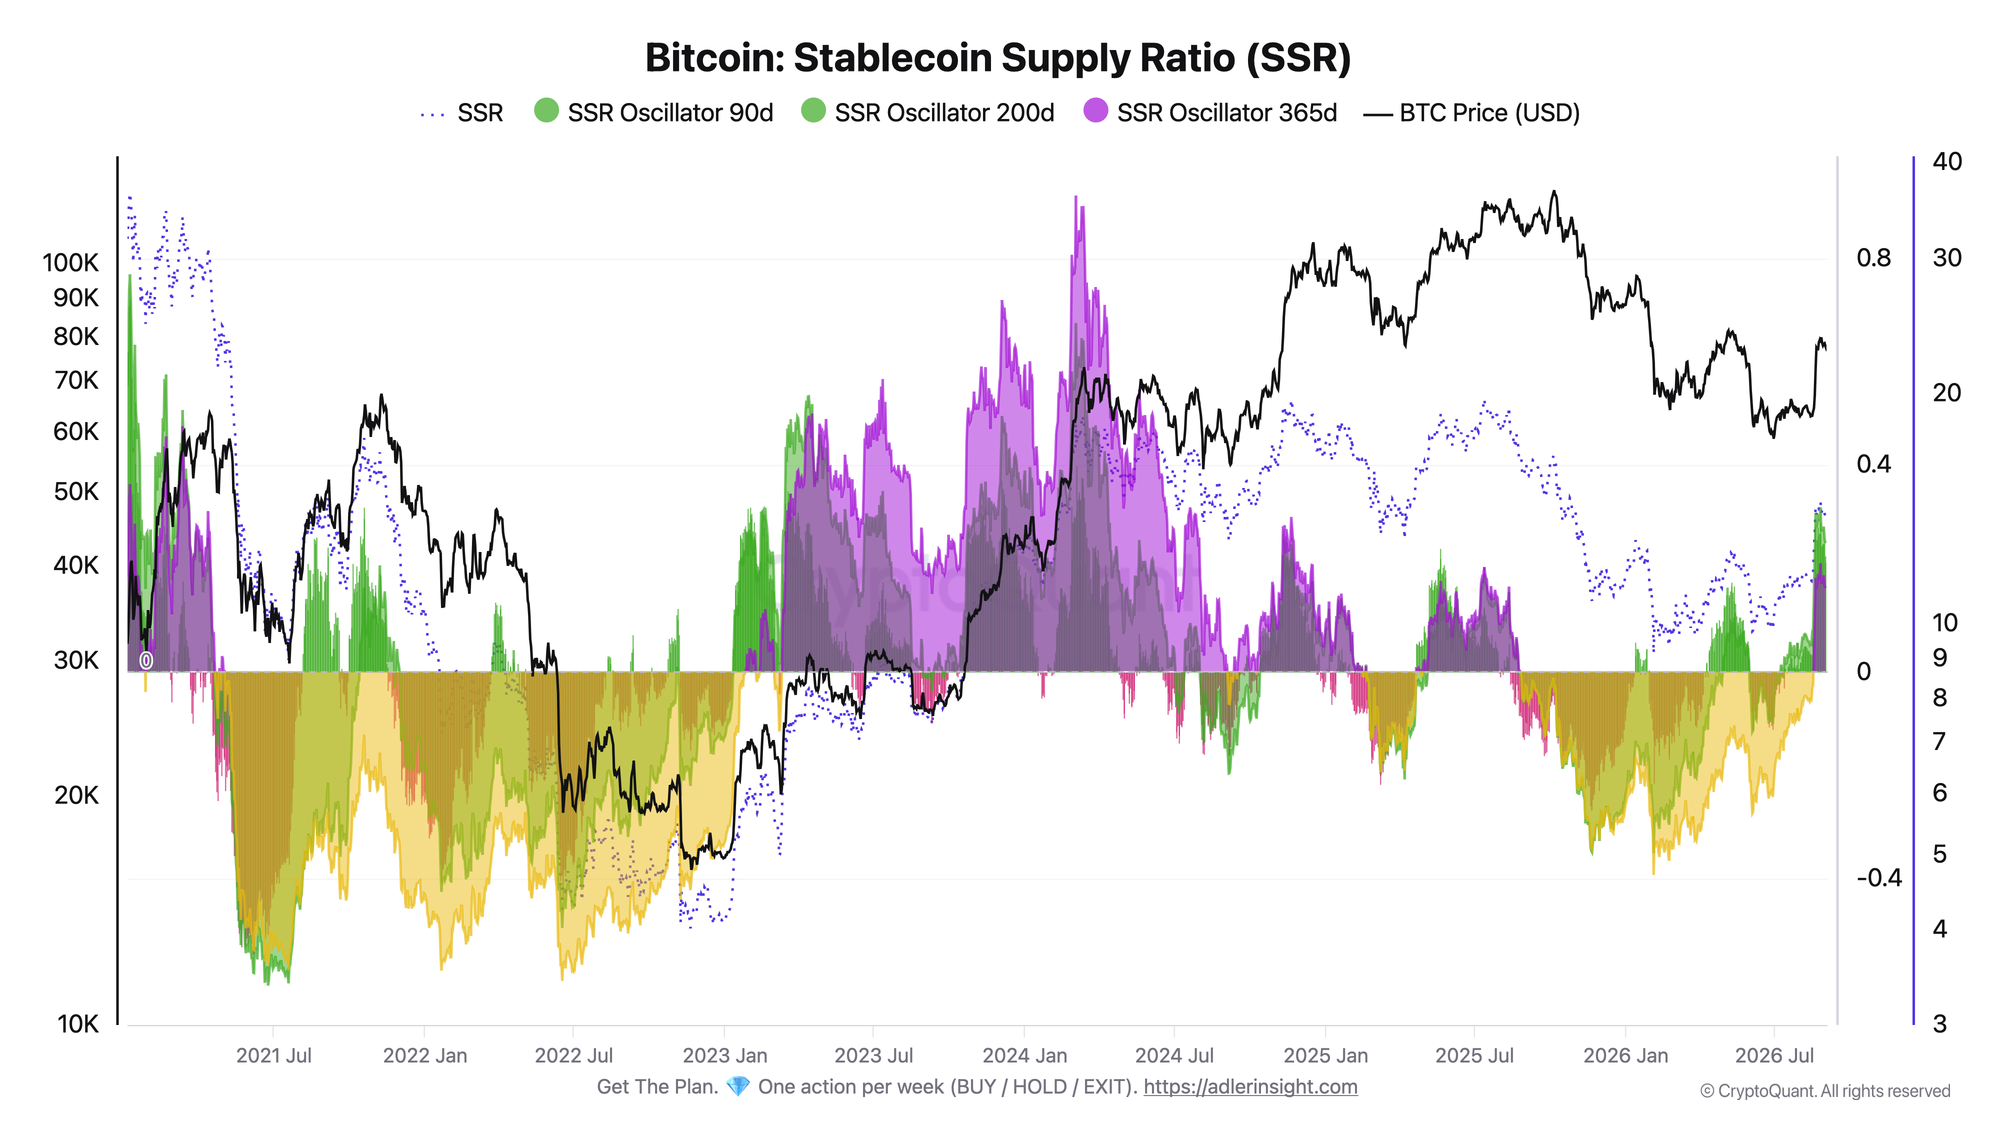
SSR stood at 13.84 on September 1. The 90-day, 200-day, and 365-day oscillators are at +0.215, +0.249, and +0.162, respectively. All three readings have declined from their local highs on August 26, when they peaked at +0.291, +0.318, and +0.210.
The decline in the oscillators points to a recovery in the relative purchasing power of stablecoins after the deterioration in August. However, all three readings remain above zero, meaning SSR is still above its 90-day, 200-day, and 365-day averages. Potential purchasing power is improving but remains below its recent norm.
All Stablecoins (ERC20): Exchange Netflow SMA 30
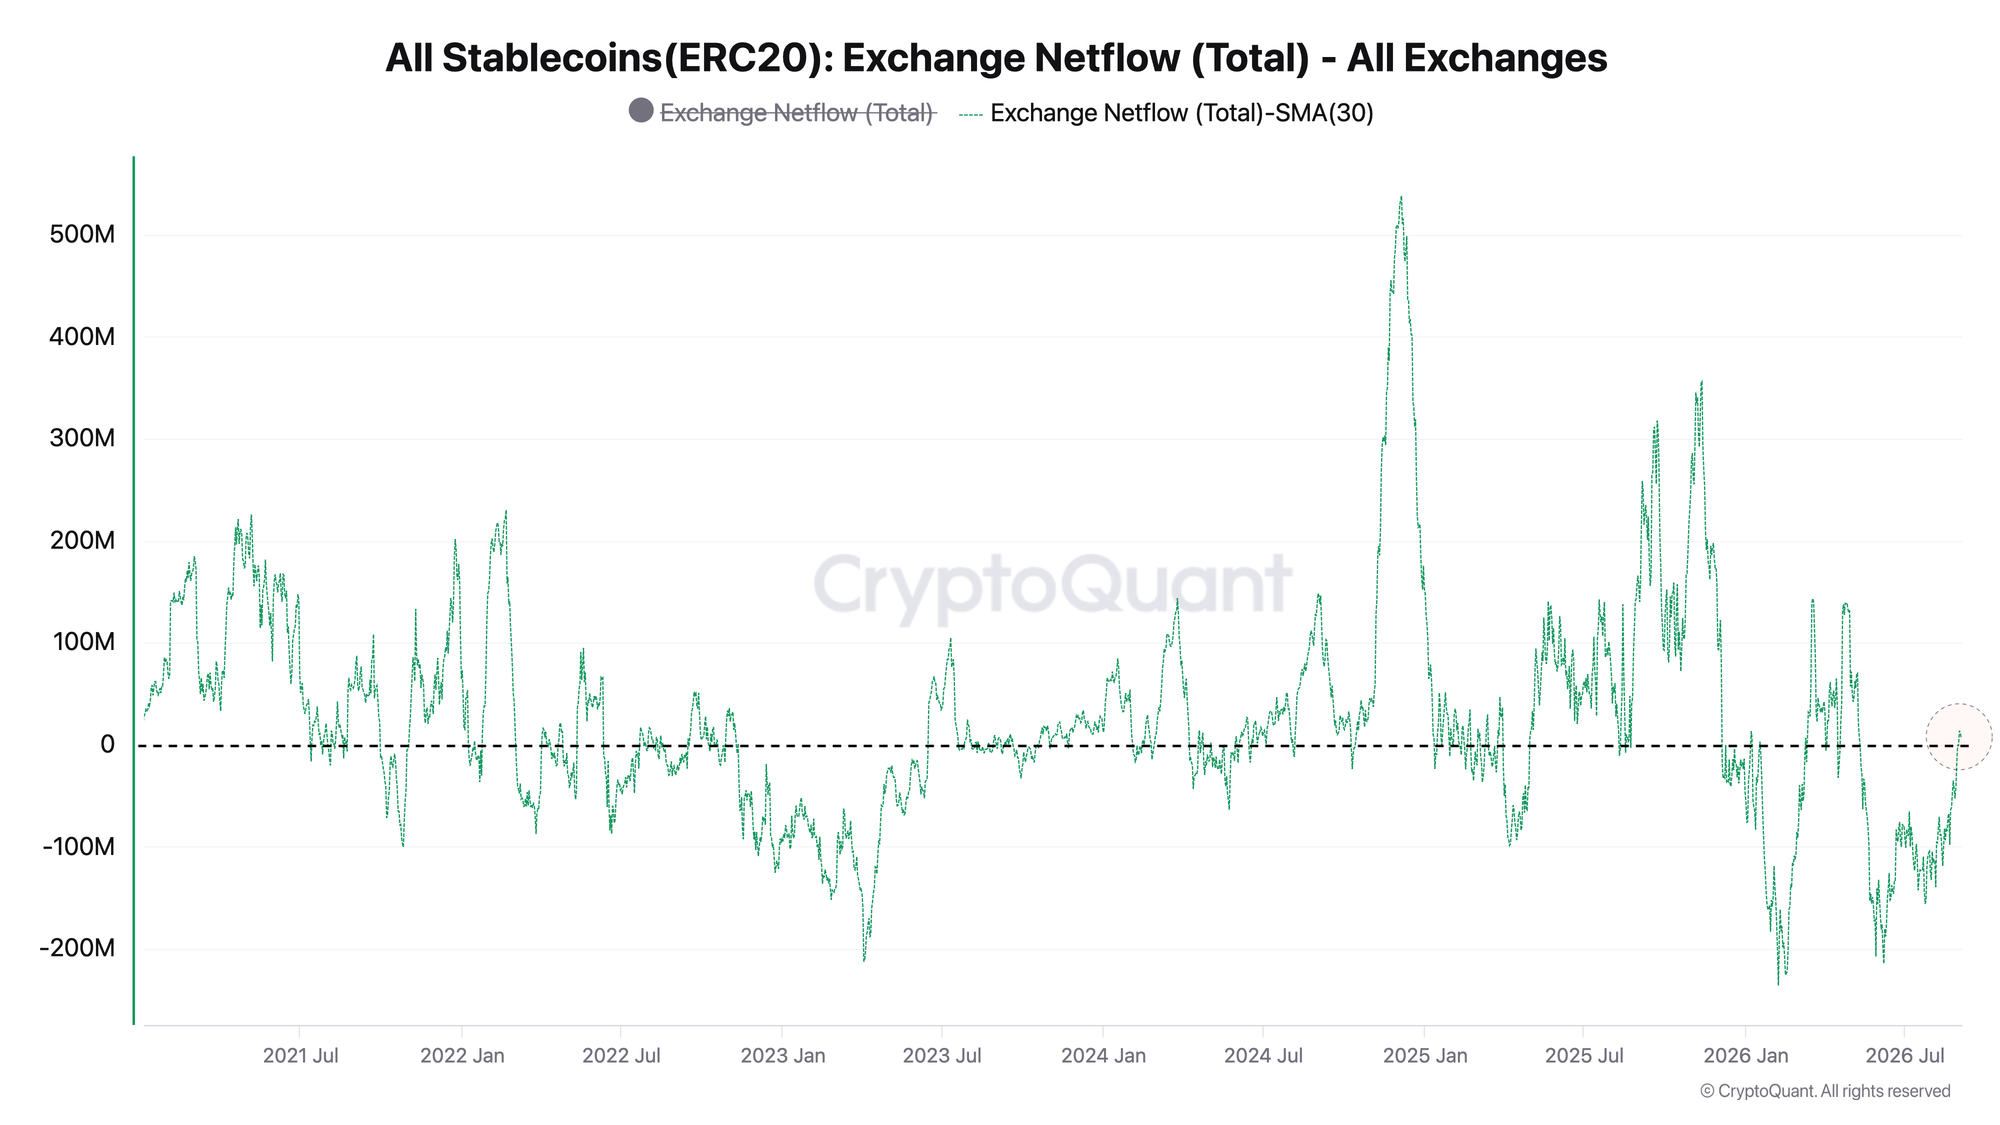
The 30-day average netflow remained below zero from May 11 through August 31, a period of 113 consecutive days. The metric turned positive at $13.85 million on September 1 before falling to $11.66 million on September 2 and $6.85 million on September 3. The positive reading declined by roughly 51% over two days.
The current signal is better interpreted as a neutralization of the previous outflow regime. The metric crossed above zero but does not yet show accelerating stablecoin inflows to exchanges.
The two charts provide a similar signal. Exchange flows are no longer clearly negative, while SSR is retreating from its recent local high, but neither metric confirms a sustained expansion in liquidity yet.
Reading the signal is not enough - you need to act on it. Weekly Engine turns on-chain data into one clear decision per week, with risk caps and invalidation built in. Subscribe.
FAQ
Does Exchange Netflow moving above zero mean demand has returned? No. A positive reading means the 30-day flow balance has moved out of a net outflow regime, but the current inflow is already weakening.
What would confirm a full liquidity reversal? Exchange netflow must hold above zero and begin expanding while the SSR oscillators continue declining toward the neutral zone. So far, only the first stage of the transition from outflows to a more balanced regime is visible.
CONCLUSIONS
After 113 consecutive days of outflows, the stablecoin liquidity regime has changed, but there is still no sustained inflow. The 30-day Exchange Netflow moved above zero, but its positive reading fell by half over the next two days, while the SSR oscillators are declining but remain positive. The current regime is neutral. The main trigger would be a sustained expansion in positive netflow alongside a further decline in SSR. The main risk is a return of exchange flows below zero, which would show that the transition was short-lived.
Live Charts
Explore the metrics behind this brief with live, auto-updating charts:
Exchange Netflow - Net BTC moving to and from exchanges across positive and negative flow regimes.
Coinbase Premium Index - Coinbase vs global market premium as a proxy for US spot demand pressure.
BTC US ETF Flow Monitor - US spot Bitcoin ETF daily flow, BTC-denominated accumulation, and fund leadership.
Fear & Greed Index - Composite market sentiment for risk appetite and sentiment extremes.
Liquidity Flows — All exchange-flow, ETF, and spot-demand charts in one view.