


🎧 Morning Brief #207 - audio debate
For the first time since December 2022, Strategy has recorded a major net sale of Bitcoin. Today, we break down the scale of that sale and how the market digested the news through futures flow. The two charts compare the event itself - a sale from the corporate treasury - with the derivatives reaction and the price holding above fair value.
TL;DR
The first major net BTC sale by Strategy in several years and the futures market's reaction to the announcement. The sale was driven by obligations, not by a change in strategy. Price held up, but derivatives positioning cooled noticeably.
Strategy - Buys & Sells
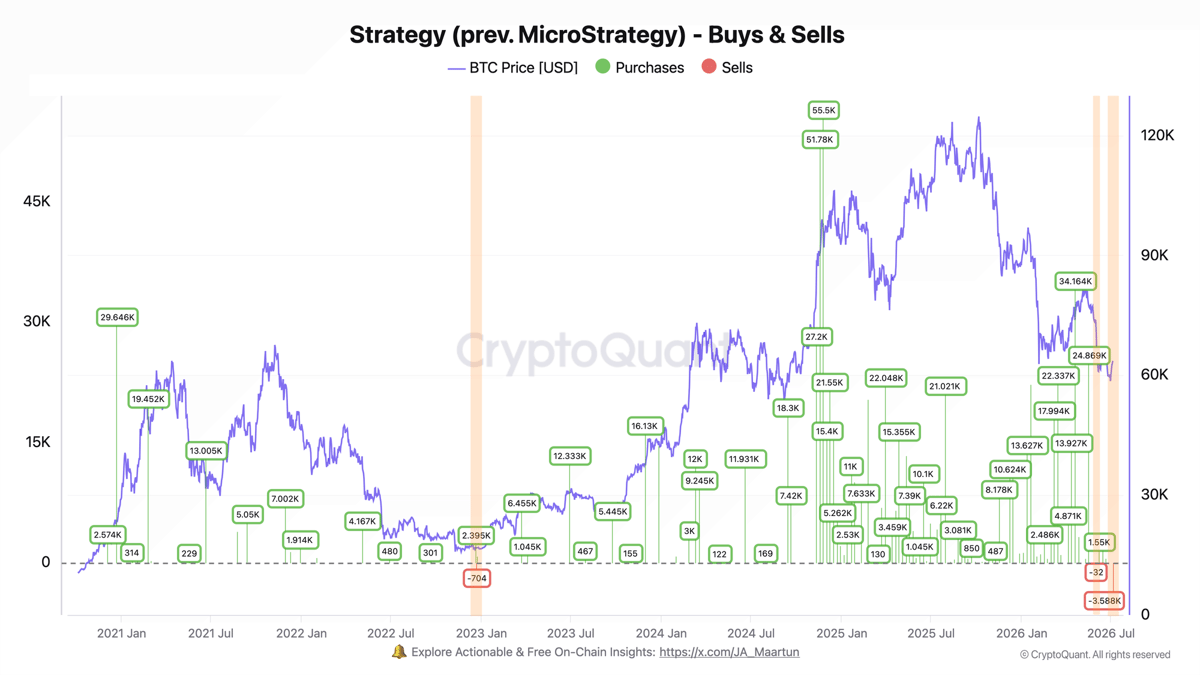
The chart's full history is an almost uninterrupted stream of purchases, while sales appear only three times over five years. The latest red bar shows -3,588 BTC and is the largest sale on record. Before that, there were only two episodes: -704 BTC in December 2022 near the very bottom of the previous cycle, and -32 BTC in May of this year. According to the official Form 8-K, the sale was executed in two tranches: from June 29 to June 30, 1,363 BTC were sold at an average price of $59,256 for $80.8 million, and from July 1 to July 5, another 2,225 BTC were sold at an average price of $60,773 for $135.2 million. Total proceeds came to $216 million. The proceeds were used for preferred stock payments and to replenish the USD reserve. As of July 5, the company still held 843,775 BTC and a reserve of $2.55 billion.
The nature of this sale is fundamentally different from the 2022 episode. Back then, it was about tax optimization. Now, it is a forced sale to cover obligations. At the same time, 3,588 BTC is only 0.4% of a treasury holding 843,775 BTC, so this is about liquidity management, not a revision of the long-term thesis. A negative signal would be repeated or larger sales to cover the company's debt burden.
Bitcoin Futures Flow
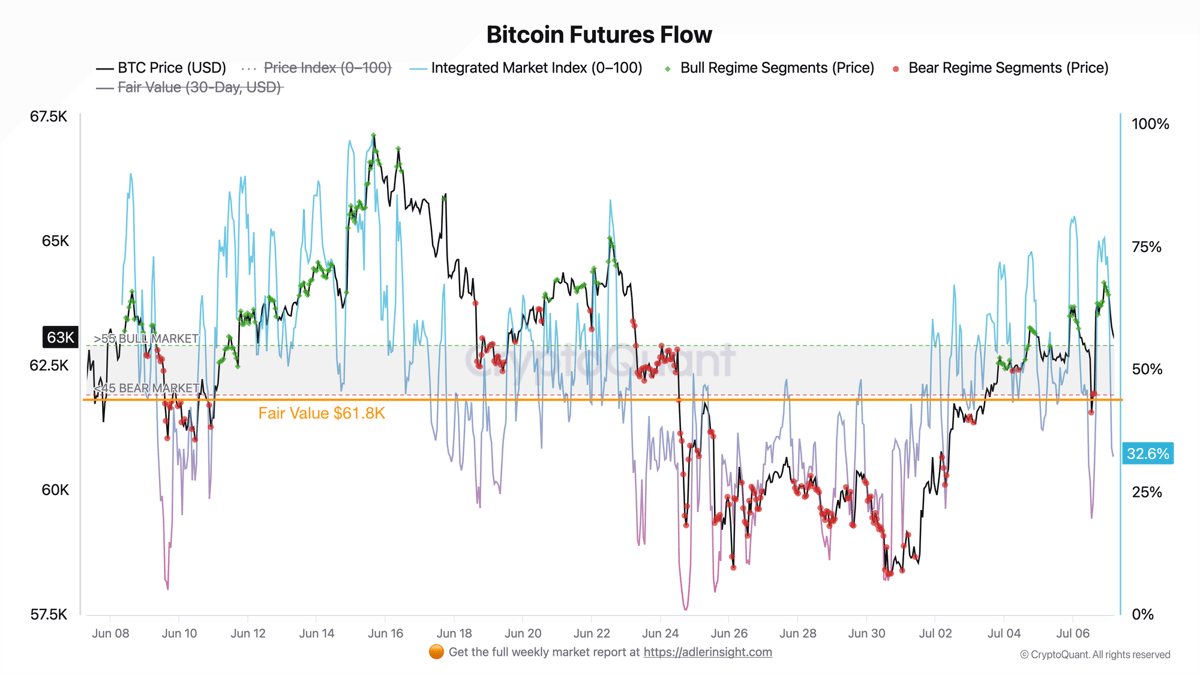
The Bitcoin Futures Flow chart with the Integrated Market Index shows how derivatives positioning and price reacted to the sale news. The signal here is simple: the index cooled sharply and moved into bearish territory, while price held firm.
The black line is BTC price, and the colored line is the Integrated Market Index on a 0 to 100 scale. A reading above 55 corresponds to a bullish regime, while below 45 signals a bearish one.
Since July 6, the Integrated Market Index has dropped from bullish levels around 80 to 32.6, and at one point during the move it nearly fell to 20. That means derivatives positioning shifted back into bearish territory. At the same time, price barely reacted: BTC held within a narrow $61.6K-$64.2K range and is now trading around $63K, still above its 30-day fair value of $61.8K. The index was extremely volatile during this window and spent a significant share of the time below the 45 threshold, but price ignored that noise.
Despite the largest BTC sale in Strategy's history, the futures reaction did not trigger capitulation. Price stayed in a tight range above fair value, which suggests the market views this as a forced liquidity sale rather than the start of a systematic treasury unwind. The main takeaway today is this: the news was absorbed by price, but derivatives positioning has shifted into a cautious regime.
Invest in Bitcoin without emotional decisions - Start free. Deterministic signals built to remove fear, FOMO, and panic selling.
FAQ
Why didn't the announcement of a 3,588 BTC sale crash the price?
The amount was only a small share of the overall treasury. According to the Form 8-K, the sales were tied to obligations, not to abandoning the accumulation strategy. The futures market absorbed the news, and price held above fair value.
What would shift the regime back to bullish?
A move back above 55 in the Integrated Market Index while price holds above fair value. The opposite scenario - if the index gets stuck below 45 and price drops below fair value - would confirm a transition into risk-off.
CONCLUSIONS
Taken together, the two charts point to a neutral-cautious regime. Strategy's sale is structurally different from the 2022 sale, price held above fair value and bounced from a local low, but the Integrated Market Index at 32.6 remains in bearish territory and keeps market positioning defensive. The main trigger for an upside reversal is a move back above 55 in the index. The main risk is the index staying below 45, which over time could drag price below fair value.
Live Charts
Explore the metrics behind this brief with live, auto-updating charts:
Open Interest (BTC) - Total futures positioning and 7-day BTC-denominated change.
Funding Rates - Perpetual futures funding to track long-side or short-side leverage pressure.
Exchange Netflow - Net BTC moving to and from exchanges across positive and negative flow regimes.
Fear & Greed Index - Composite market sentiment for risk appetite and sentiment extremes.
Derivatives - All funding, open-interest, and leverage charts in one view.