
🎧 Morning Brief #108 - audio debate on today’s market setup
Over the last 48 hours Bitcoin declined from $69,000 to $67,170, remaining in the lower quarter of the long-term price channel. Two indicators are sending different signals: market structure remains firmly bearish, while the derivatives indicator is starting to turn up slightly.
TL;DR
Price structure holds in the lower zone of the Donchian channel, confirming the bearish regime. The Bull-Bear Structure Index is slightly recovering on the back of exchange outflows - the divergence of signals requires price confirmation before changing position.
Bitcoin Price Structure: Donchian Channel + Structure Shift
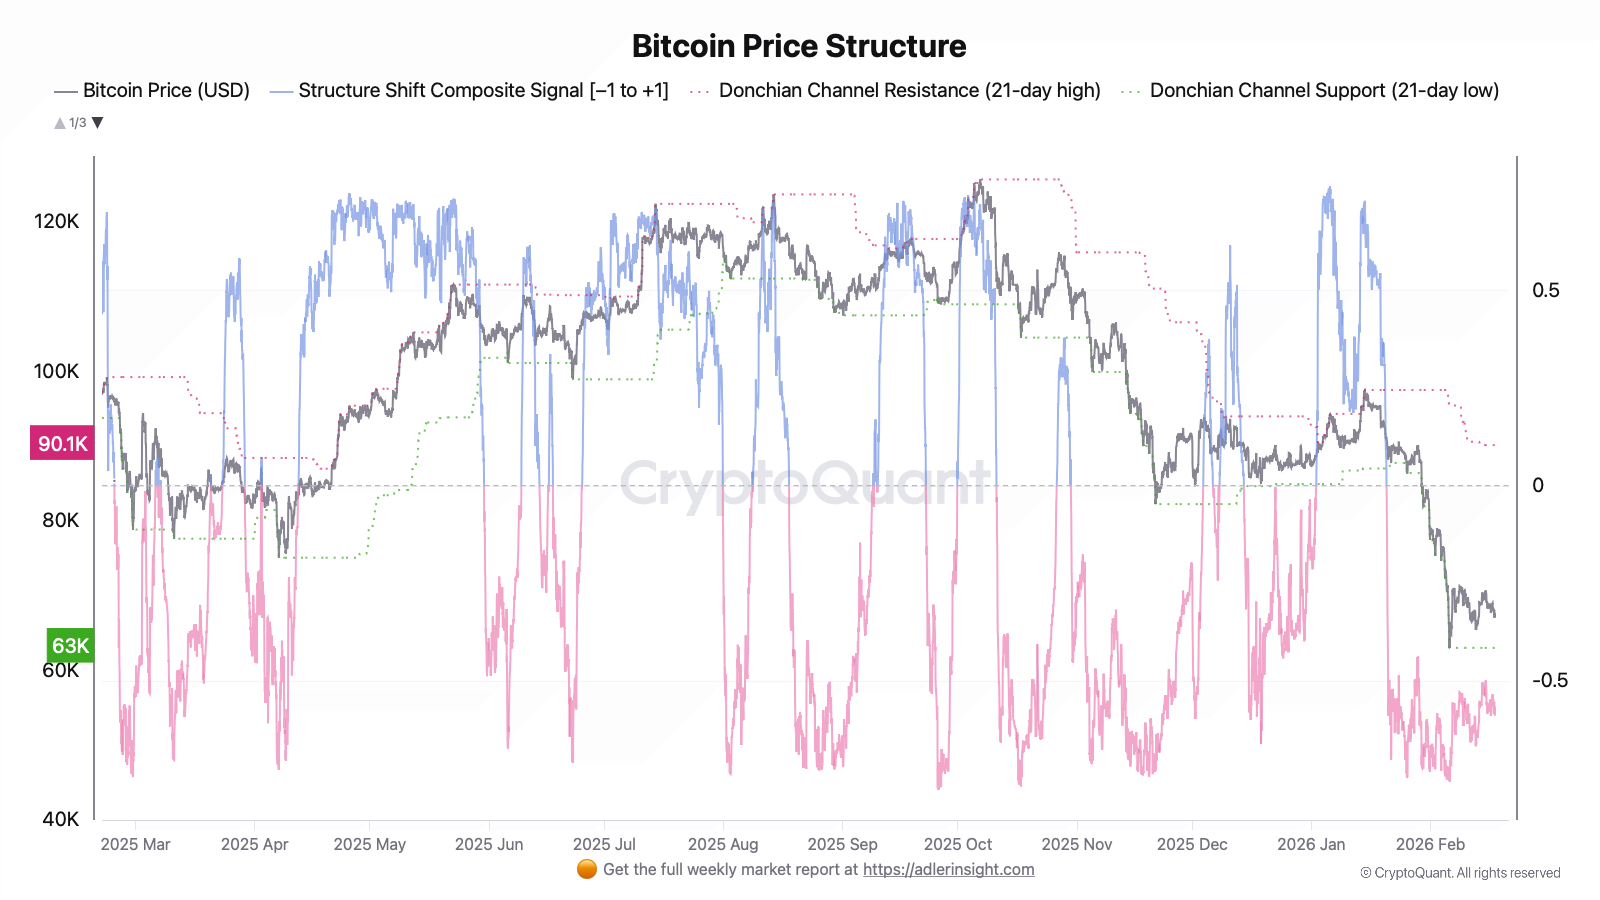
The metric reflects the position of price within the 21-day Donchian channel ($63,025-$90,147) and the composite Structure Shift - a weighted combination of channel position, EMA trend, and candle sequence.
Over the last 48 hours price traded in the $67,050-$69,022 range, holding in the lower fifth of the channel. The Momentum Signal reached an extreme reading: EMA-fast is fully below EMA-slow, the trend is maximally bearish. Structure Shift dropped to its lowest point on February 17 at 11:00 UTC and remained deep in negative territory by 18:00 UTC. The local dip to $67,050 (February 17, 15:00 UTC) was bought back within a few hours, but without any meaningful recovery.
Structure Shift unambiguously points to a bearish regime. To transition to neutral, a return above $69,000-$69,500 with sustained holding is required - only then will the channel begin to turn. Key risk: a move below $63,025 expands the channel downward and shifts all thresholds.
Bitcoin Bull-Bear Structure Index: Slow + Fast
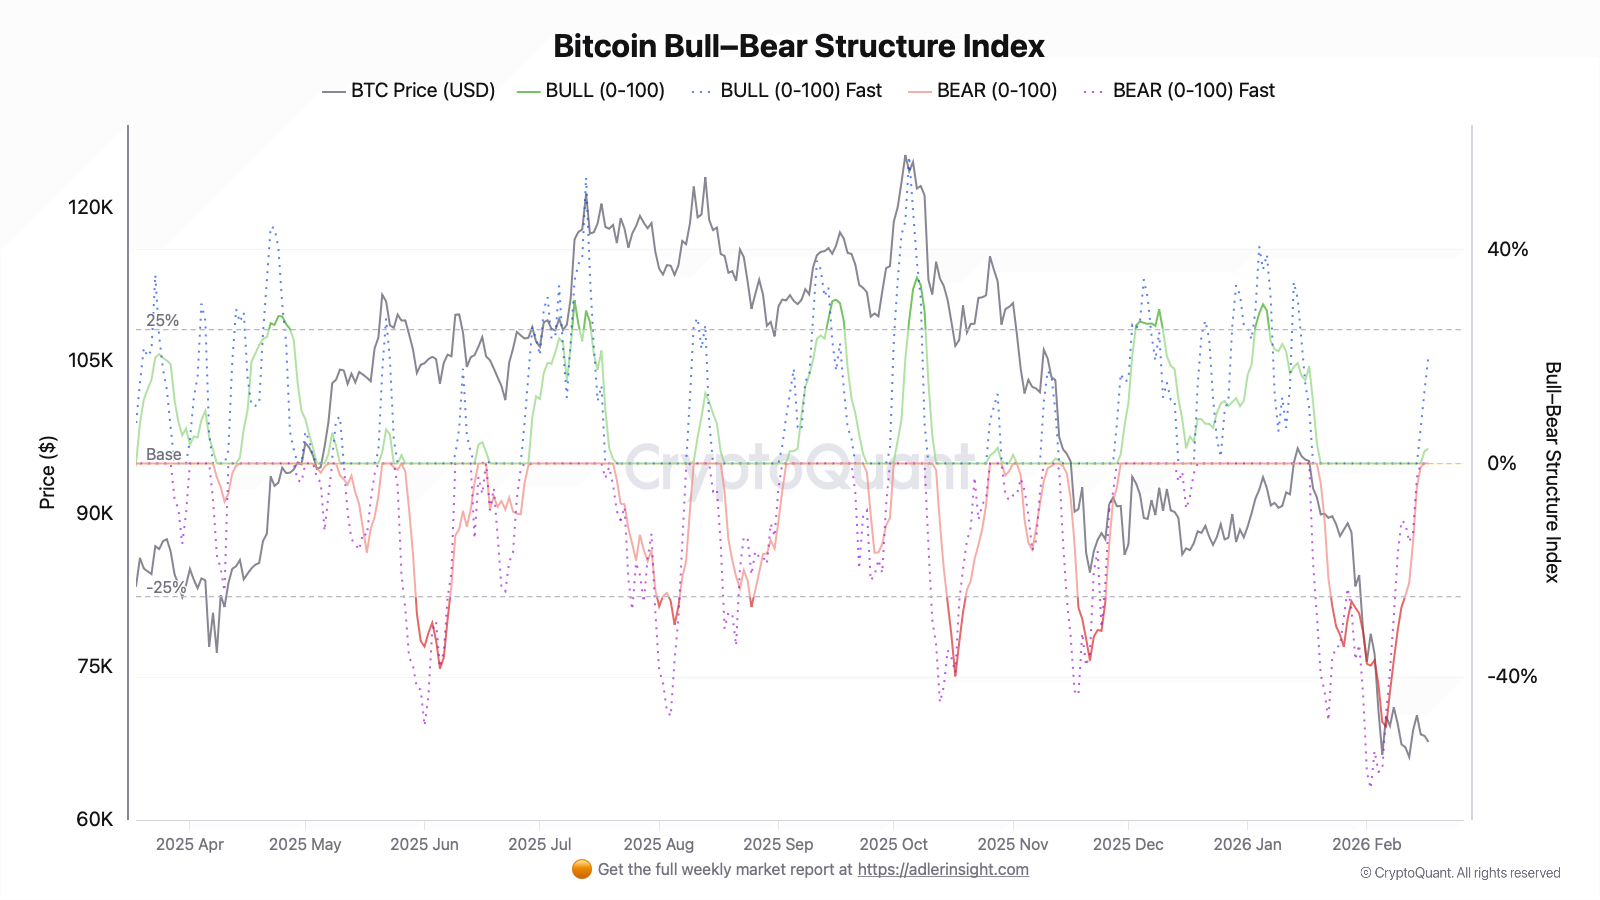
The index aggregates six components (Taker Imbalance, OI Pressure, Funding Rate, ETF Flows, exchange flows, price trend) into two oscillators: Slow (MA9) and Fast (MA5). Range: from -100 (maximum bearish) to +100 (maximum bullish).
The Slow index remains close to zero, while the Fast version is notably higher - short-term derivatives dynamics look slightly more optimistic than the overall picture. The main positive signal: coins are leaving exchanges, which historically indicates that holders are in no rush to sell, though the price trend only weakly supports bulls. The futures market remains under pressure - open interest is growing without a price increase, which more often signals short accumulation rather than new demand. ETF flows are neutral: institutional buyers have not shown up yet. The Funding Rate is close to zero - no overheating, no panic in the market.
The divergence between the Fast and Slow versions of the index may be an early reversal signal, but historically such divergences without price confirmation tend to fade.
👀 Reading the signal is not enough - you need to act on it. Weekly Engine turns on-chain data into one clear decision per week, with risk caps and invalidation built in. Start free.
FAQ
What does the divergence between the Fast and Slow versions of the Bull-Bear Index mean?
The Fast version reacts to the last 5 days of data, while Slow averages 9 days. When the short-term version is notably ahead of the slow one, it means derivatives signals have turned faster than the overall picture has had time to reflect. This is normal in transitional phases, but the signal on its own is not actionable - price confirmation is needed.
Under what condition will Structure Shift shift to a neutral regime?
Structure Shift is calculated as a weighted sum of three components: channel position, EMA trend, and candle sequence. To exit the negative zone, sustained price holding above $69,500 for at least 24-36 hours is required - only then will all three components begin to turn simultaneously.
CONCLUSIONS
The market is in a bearish regime with the first signs of stabilization from the derivatives side. Structure Shift remains deeply negative with price in the lower quarter of the Donchian channel - this is the dominant signal. At the same time, exchange outflows and the advancing Fast index create potential for a short-term recovery, but without price confirmation above $69,500 this remains a counter-signal, not a regime change. Key reversal trigger: sustained hold above $69,500 with positive OI dynamics and rising ETF flows. Key risk: a break of $67,050 opens the path toward the $63,000-$65,000 support zone.