
Following the correction from October highs, Bitcoin has stabilized in the $87–90K range. Supply in Profit dropped from peak values to 13.5M BTC, but the short-term moving average has reached a local minimum and is beginning to turn around. Two charts illustrate the current structure of supply in profit and the forecast for a bullish trend recovery in this metric.
TL;DR
This brief examines the convergence dynamics between short-term and medium-term Supply in Profit moving averages. Key logic: SMA90 continues to decline due to window inertia, so the cross may form even without a sharp rise in the metric. Confirmation requires an SMA30 reversal and price holding above key levels.
Related metric: Supply in Profit closely aligns with valuation models like MVRV, which help contextualize profitability across market cycles. Bitcoin MVRV Ratio: Definition, Formula & Cycle Signals.
Bitcoin Supply in Profit Trend
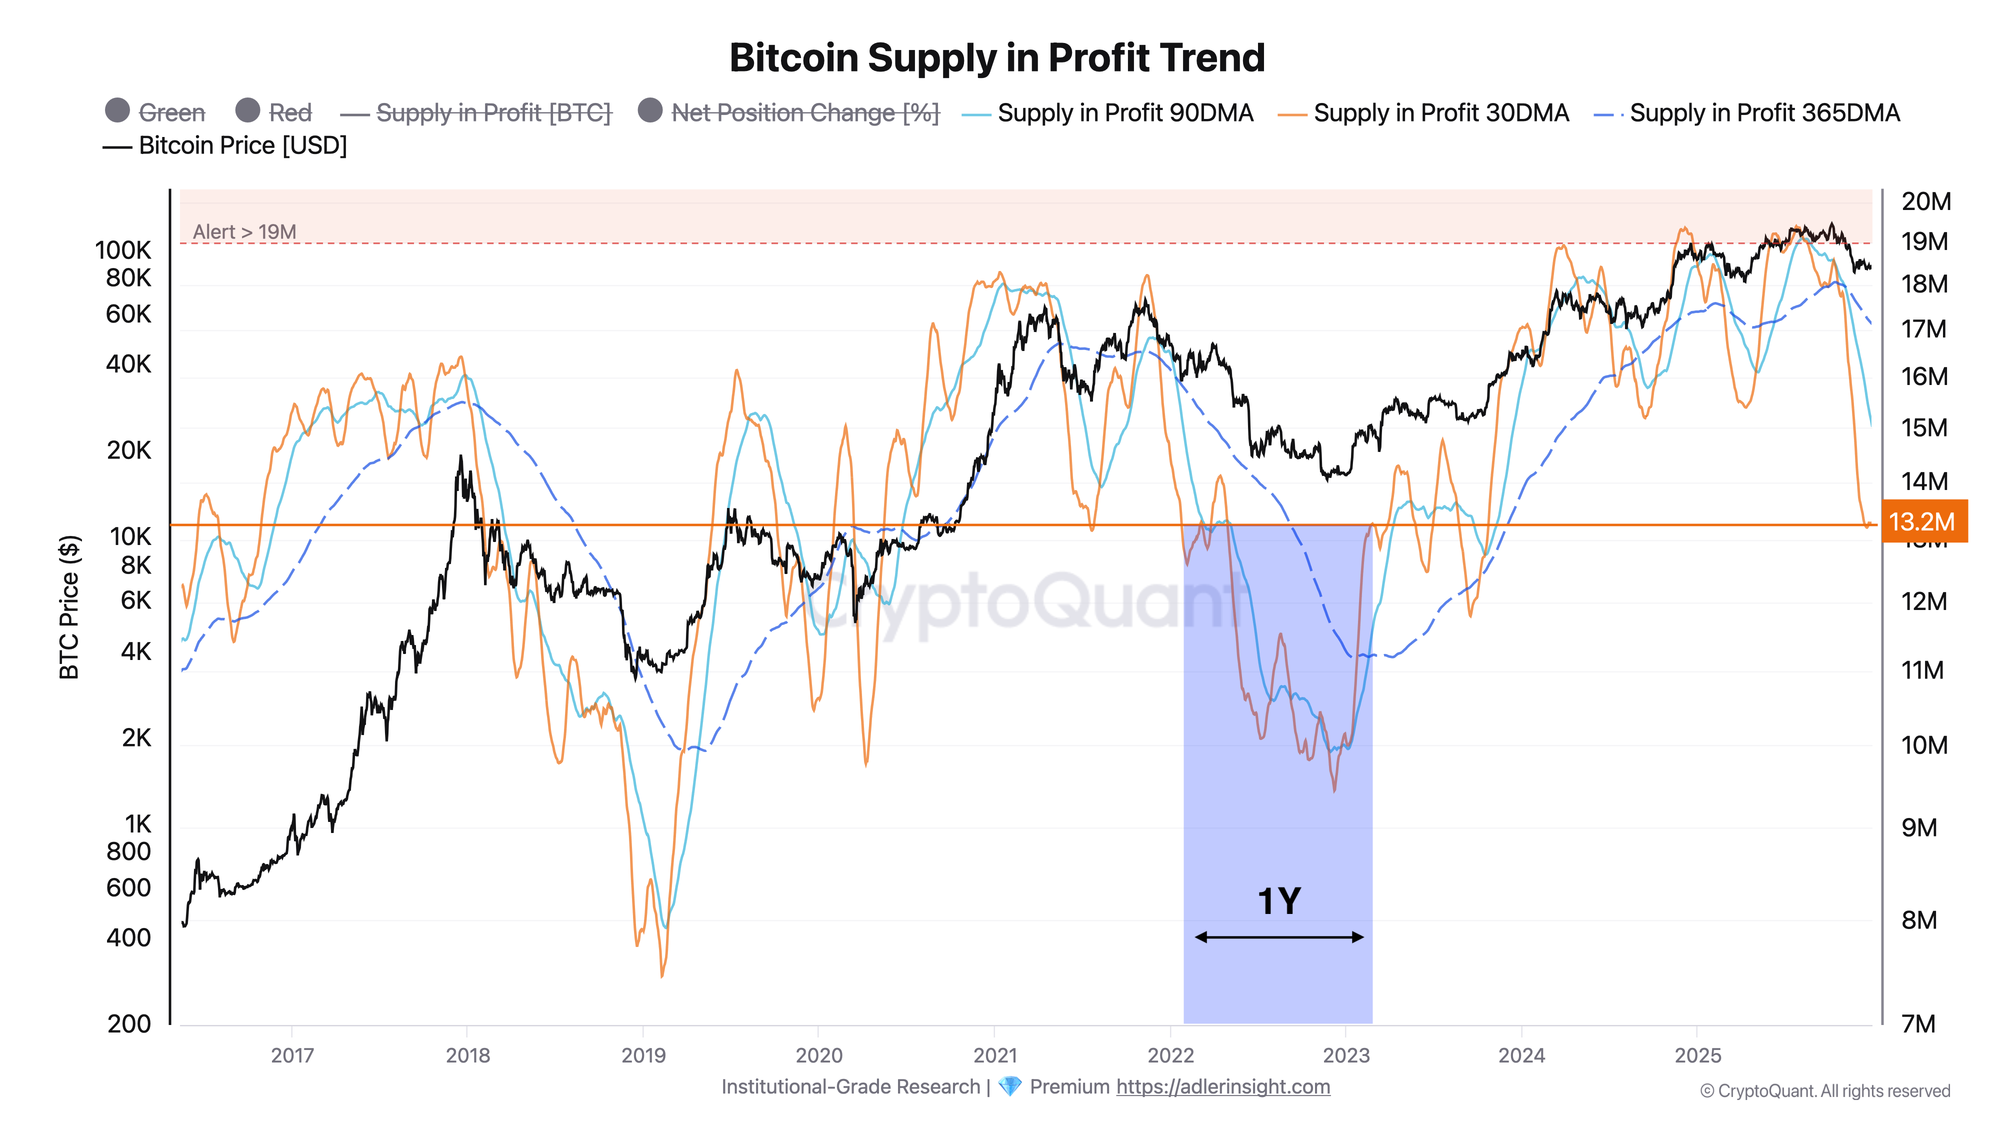
The metric shows the volume of BTC held in profit relative to acquisition price, overlaid with SMA 30 and SMA 365 to identify accumulation and distribution trends.
Supply in Profit declined from October peaks of >19M BTC to current 13.5M amid the price correction from ATH. SMA 30 dropped significantly below SMA 90, forming a GAP of approximately 1.75M BTC. Notably, a similar configuration was observed in 2022 before an extended bearish period; however, the current structure differs: SMA 365 remains at historically elevated levels for now. SMA 30 reached a local minimum on December 18 and shows signs of stabilization. The key trigger for reversal confirmation is a sustained hold of Supply in Profit above the SMA 30 level, which requires price to maintain the current range or higher.
SMA 30 / SMA 90 Crossover Forecast
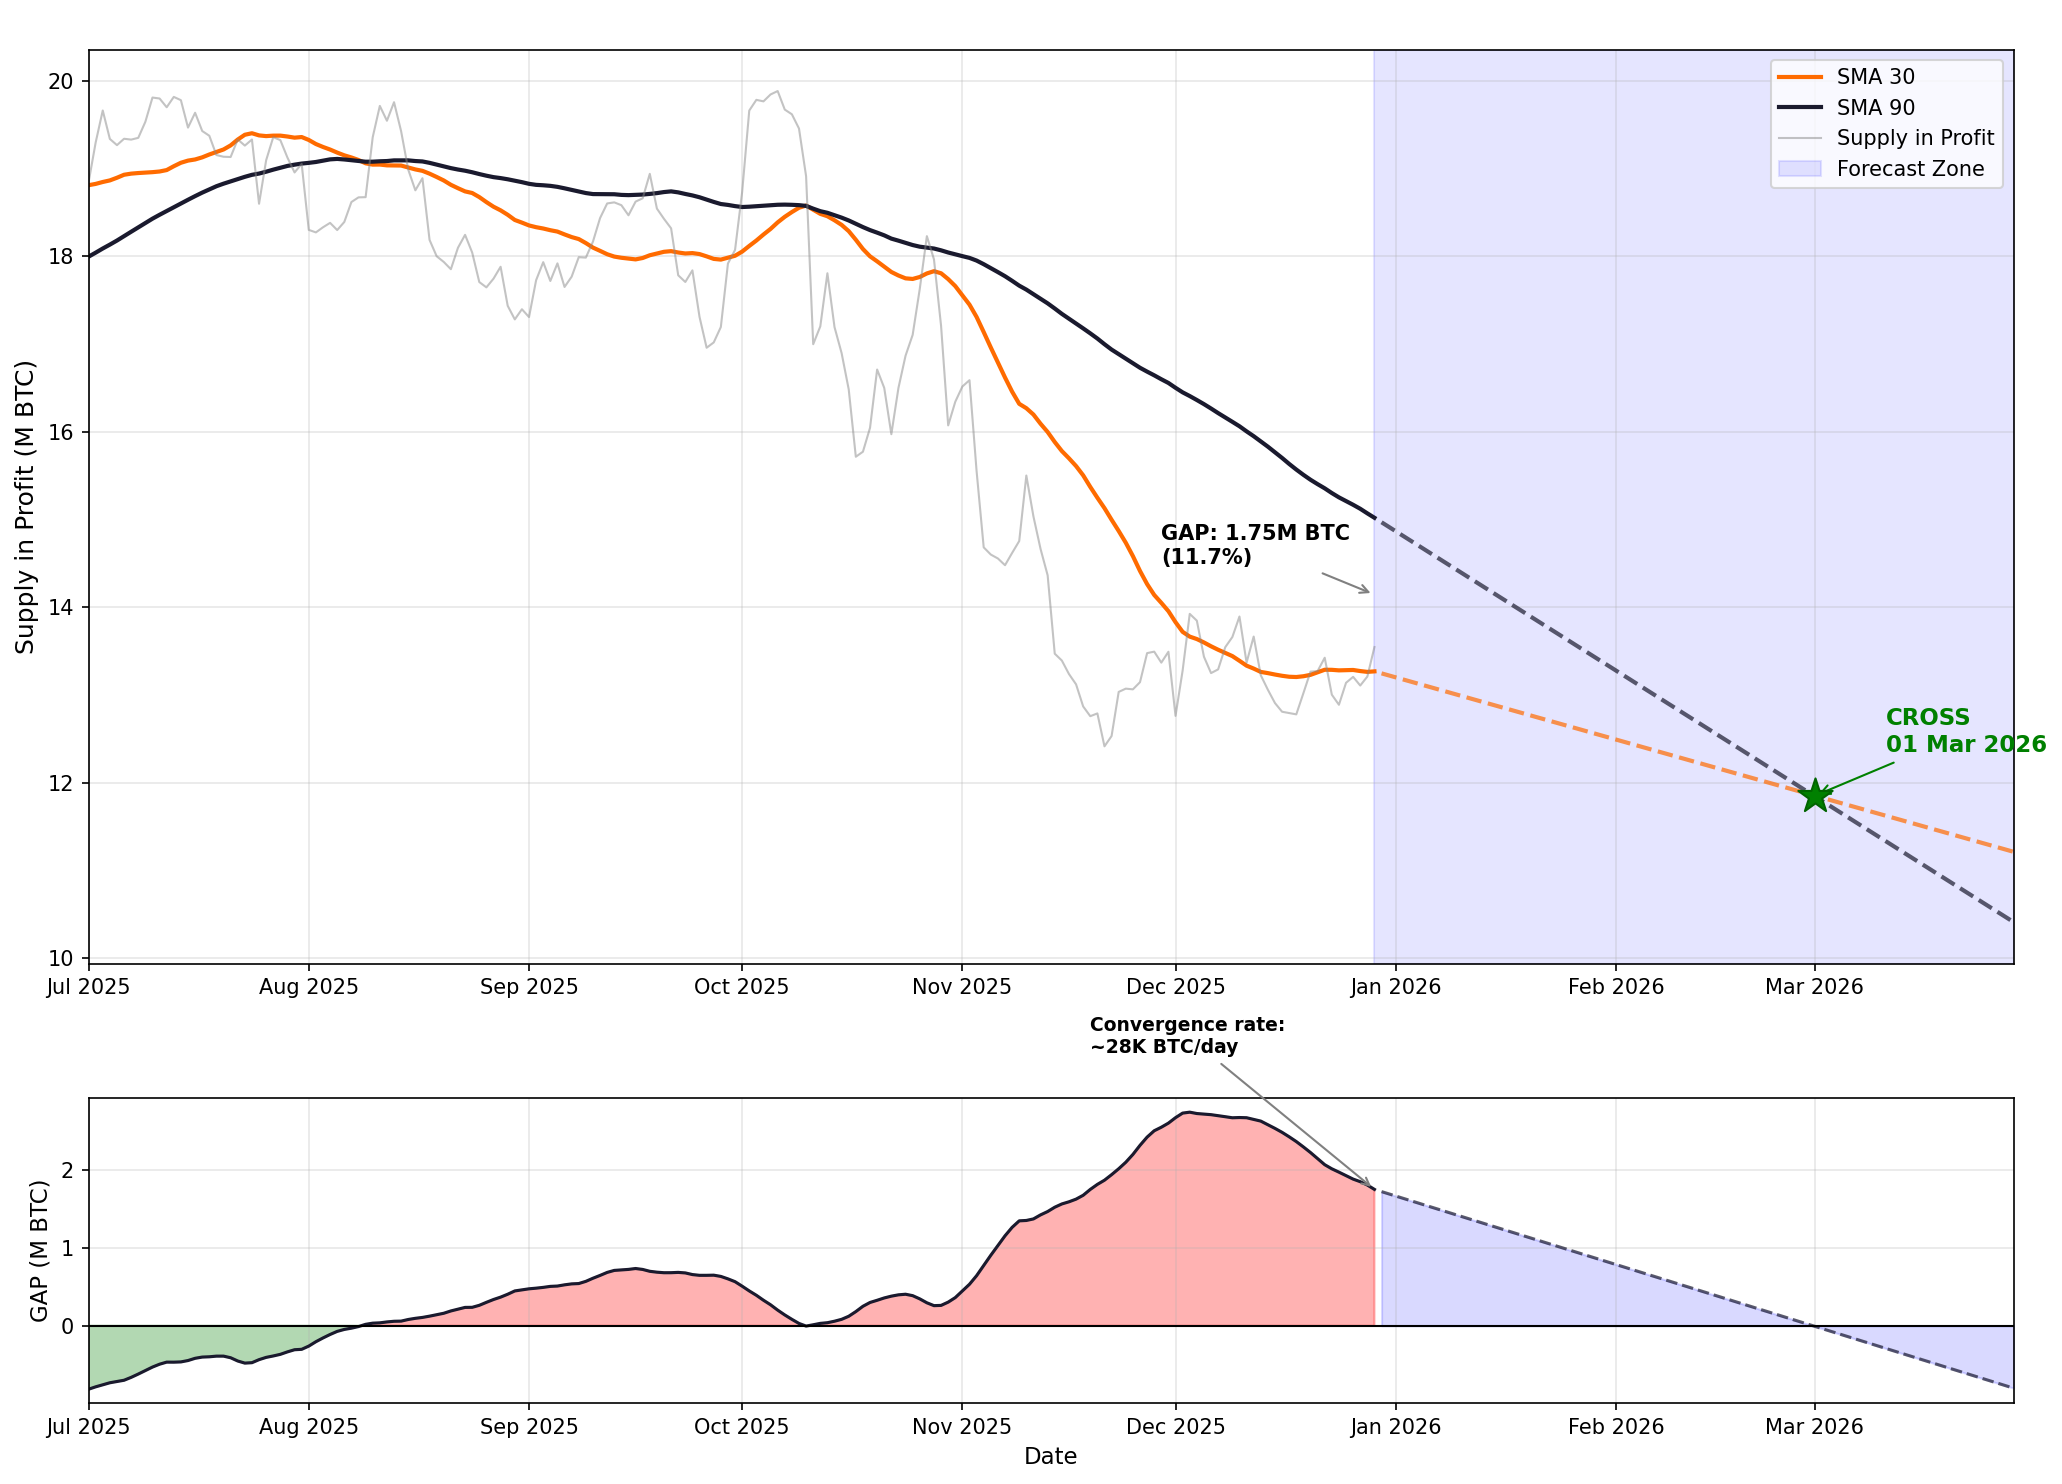
The model extrapolates current rates of change in the moving averages to estimate the timeline for bullish configuration recovery (SMA 30 > SMA 90).
The GAP between moving averages is narrowing at approximately 28K BTC per day. The primary driver is the structural decline in SMA 90 due to peak October values dropping out of the calculation window, when Supply reached 19–20M BTC. This mechanical effect will continue through late January, creating a "tailwind" for convergence.
If current dynamics persist, a bullish cross is projected for late February to early March. However, the model is price-sensitive: Supply elasticity to price is 1.3x, meaning a 10% price drop leads to approximately 13% Supply decline. The critical level is the $70K zone: below it, SMA 30 will begin falling faster than SMA 90, and the GAP will shift to expansion following the 2022 scenario. Thus, the cross forecast remains valid if price holds above $75–80K in January. Otherwise, the market faces a 2022-style scenario with recovery taking up to one year.

FAQ
Why is SMA 90 falling while price remains stable?
This is a mechanical effect of the moving average: values from early October are now dropping out of the 90-day window, when Supply in Profit was at peaks of 18–20M BTC with price at $115–125K. Even with stable current Supply, this pulls the average down.
At what price does the cross scenario get invalidated?
The critical zone is below $70K. At that level, Supply would fall to ~10M BTC, and SMA 30 would begin declining faster than SMA 90. The GAP would stop narrowing and shift to expansion, postponing the bullish signal indefinitely.
CONCLUSIONS
The Supply in Profit structure indicates a local bottom forming in the short-term moving average, with prospects for a bullish SMA 30/SMA 90 cross within a two-month horizon. The key condition for realization is price holding above $75–80K, which would allow Supply to remain above SMA 30 and maintain the convergence pace. The regime remains neutral: the structural decline in SMA 90 creates a window, but high metric elasticity to price makes the forecast vulnerable to further correction. Main trigger GAP breaking below 1M BTC followed by the cross. Main risk: price dropping below $70K with a shift to spread expansion.