
🎧 Morning Brief #169 - audio debate on today’s market setup
Since March, the market had been going through a strong impulse from buyers - Net Taker Volume SMA-30d flipped out of negative territory and kept rising steadily for two straight months. But in recent days, a slowdown has become visible: bullish pressure through taker orders is easing, while funding still has not recovered above zero, and the price has pulled back to $79K.
TL;DR
A brief on two signals working together: taker volumes point to a weakening bullish impulse, while funding confirms that traders are not rushing to open longs. The market is losing bullish inertia while bearish positioning in derivatives remains in place.
Bitcoin Net Taker Volume Oscillator SMA-30D
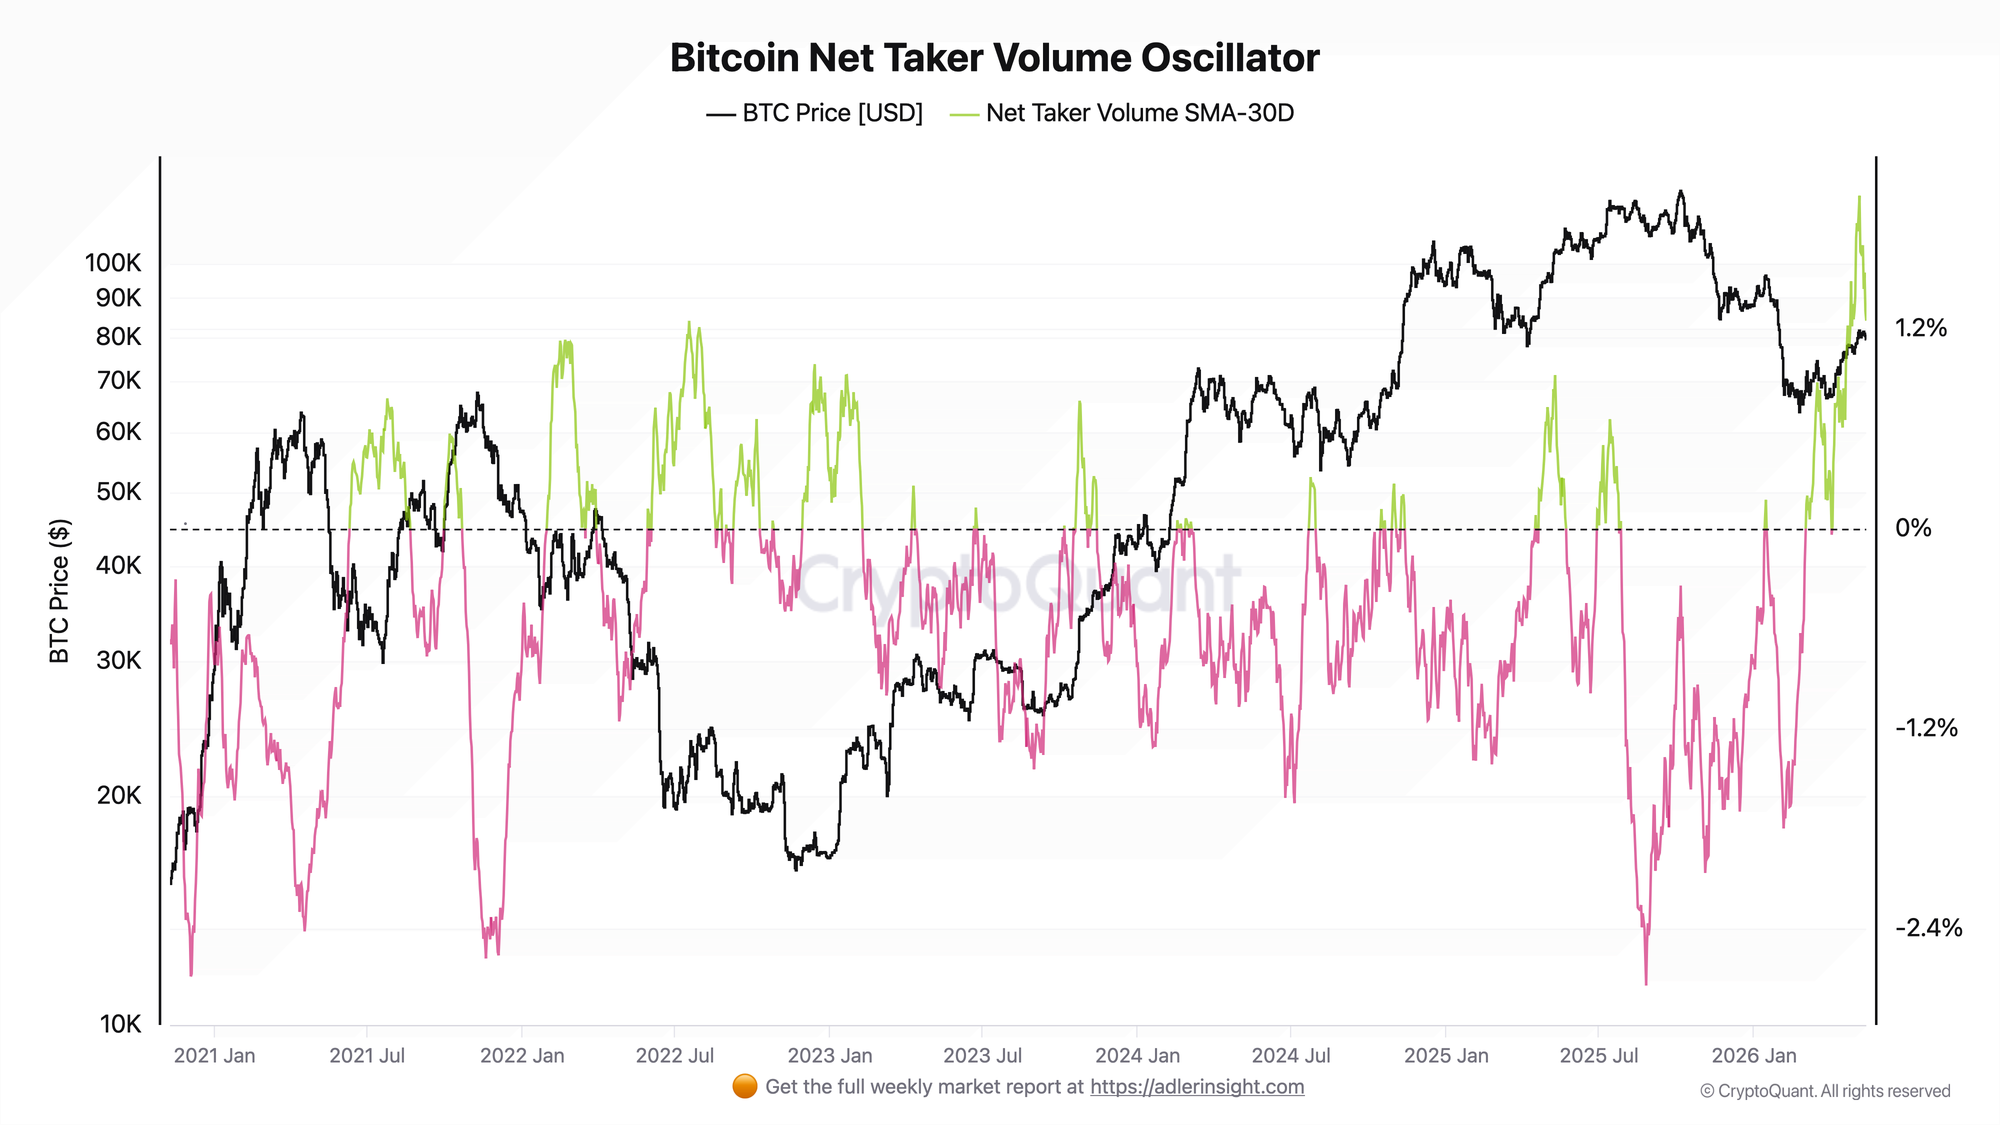
The metric reflects the 30-day moving average of the difference between aggressive buying and selling - taker orders. Positive values indicate buyer dominance across spot and derivatives markets.
Since the beginning of March, Net Taker Volume SMA-30d had been rising steadily, moving out of negative territory to levels above +1.9 in early May - this was the longest stretch of bullish taker pressure since at least the beginning of 2021. The peak came on May 6 (+2.0 with price at $81,577), after which the decline began: today the indicator has dropped to +1.25. Over the past week, buyer pressure through taker orders has fallen by roughly 35-40% from the peak.
The decline does not yet mean a reversal into negative territory, but the inertia is clearly fading. The key level to watch is a return of the oscillator to values below +0.3, which historically corresponded to a shift into sideways or bearish pressure. If the decline accelerates while the price falls below $78K, that will strengthen the weakening signal.
Bitcoin Funding Rate SMA-30D
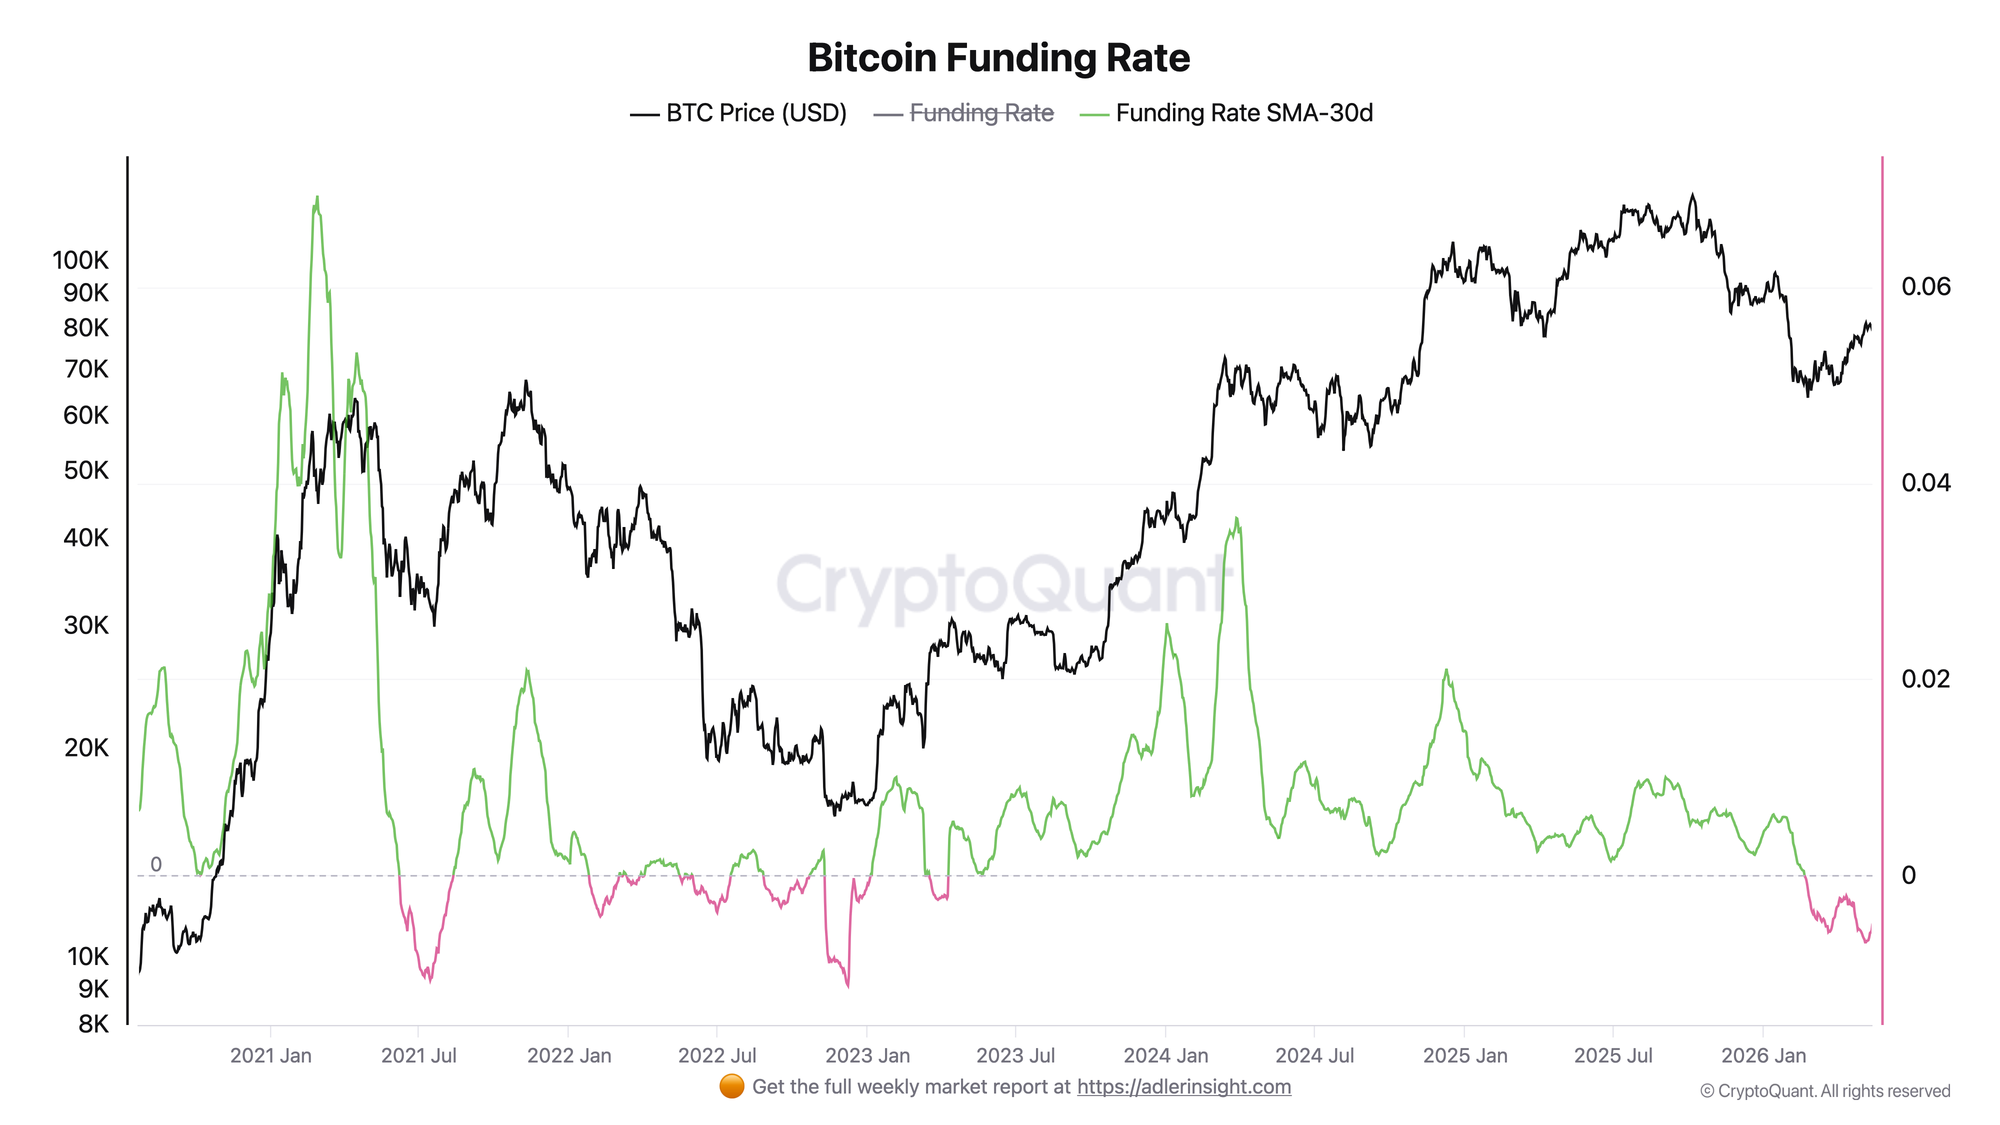
Funding Rate SMA-30d reflects the average imbalance between longs and shorts in the perpetual futures market. Negative values mean shorts are paying longs, which means bearish positioning is dominant.
Since the beginning of March, Funding Rate SMA-30d moved into negative territory and has remained there ever since - today the value stands at -0.0049, close to the local lows of the period (-0.0068 was recorded around May 9). Even though the price rose above $81K in May, the funding rate still failed to turn positive: this means the rally happened without a clear formation of bullish consensus in the derivatives market. Market participants were more likely hedging the rise than opening aggressive longs.
Persistently negative funding alongside a rising price is an unusual but technically healthy configuration: it reduces the risk of a cascading short liquidation. However, if taker volumes continue to fall and the price settles below $79K, negative funding may add pressure to position exits. A reversal of SMA-30d above zero would be the first confirmation of a regime change in derivatives.
The two indicators describe the same market situation from different sides: aggressive buying is weakening, Net Taker Volume is turning lower, while the futures market still refuses to pay for longs, and Funding Rate remains steadily negative. This divergence confirms that the March bullish impulse is beginning to fade without support from the derivatives market.
Protect capital first. Capture upside second - start 7 days free. Built for long-term investors who want performance, not stress.
FAQ
Does positive taker volume mean the bulls still control the market? Technically yes - a value of +1.25 means that buyers through taker orders still dominate. But the key is the trend: a drop from +2.0 to +1.25 over a week against the backdrop of a pullback to $79K is a sign of weakening impulse, not confirmation of strength.
Under what condition would the signal turn bullish? It would require seeing both stabilization of Net Taker Volume at higher levels and the beginning of a reversal in Funding Rate SMA-30d toward zero or above. For now, both indicators are moving against the bulls, so the regime remains neutral-cautious.
CONCLUSIONS
Both charts come together into a single picture of fading bullish inertia: taker volumes, which reached peak values in early May, are turning lower, while the derivatives market did not support the rally even once over the past two months - funding stayed negative even at prices above $81K. The current stance is neutral, with a cautious tilt: the price is holding around $79K, but without a fresh inflow of aggressive buyers and without a reversal in derivatives positioning. The main trigger for a return to a bullish regime is a recovery in Net Taker Volume above +1.7 together with Funding Rate SMA-30d moving toward zero. The main risk is a further drop in taker pressure below +0.8 while the price remains under $78K, which would open the door to a retest of lower support levels.
Further Reading
Dive deeper into the metrics covered in today's brief:
- Bitcoin Funding Rates: Definition, Formula & Cycle Signals
- Bitcoin Open Interest and Funding Rate: The Combined Framework for Reading Derivatives Markets
- Bitcoin Liquidation Cascade: How It Works, Why It Happens & How to Predict It
- Bitcoin Open Interest vs Price: 4 Divergence Patterns Every Trader Must Know
Live Chart
Bitcoin Funding Rates