
🎧 Morning Brief #192 - audio debate on today’s market setup
Adjusted Sell-side Risk Ratio moved into the red zone for the first time since the previous cycle during the drop to $60K: the value of supply in loss matched the value of supply in profit and started to exceed it. At the same time, the CVDD valuation model holds the structural bottom level at $48K.
Two indicators with different logic - one behavioral, one valuation-based - point to the same area: the market has entered an accumulation zone, but the final risk boundary may sit lower, near CVDD.
TL;DR
This brief is about how holder conditions and fundamental valuation have converged in the same zone. Supply moved deeply underwater around $60K, while CVDD shows where the market's structural bottom level sits.
The logic is simple: deep unrealized stress among holders has historically coincided with periods of bottom formation, while CVDD marks a level below which Bitcoin has almost never closed.
Bitcoin adjusted Sell-side Risk Ratio
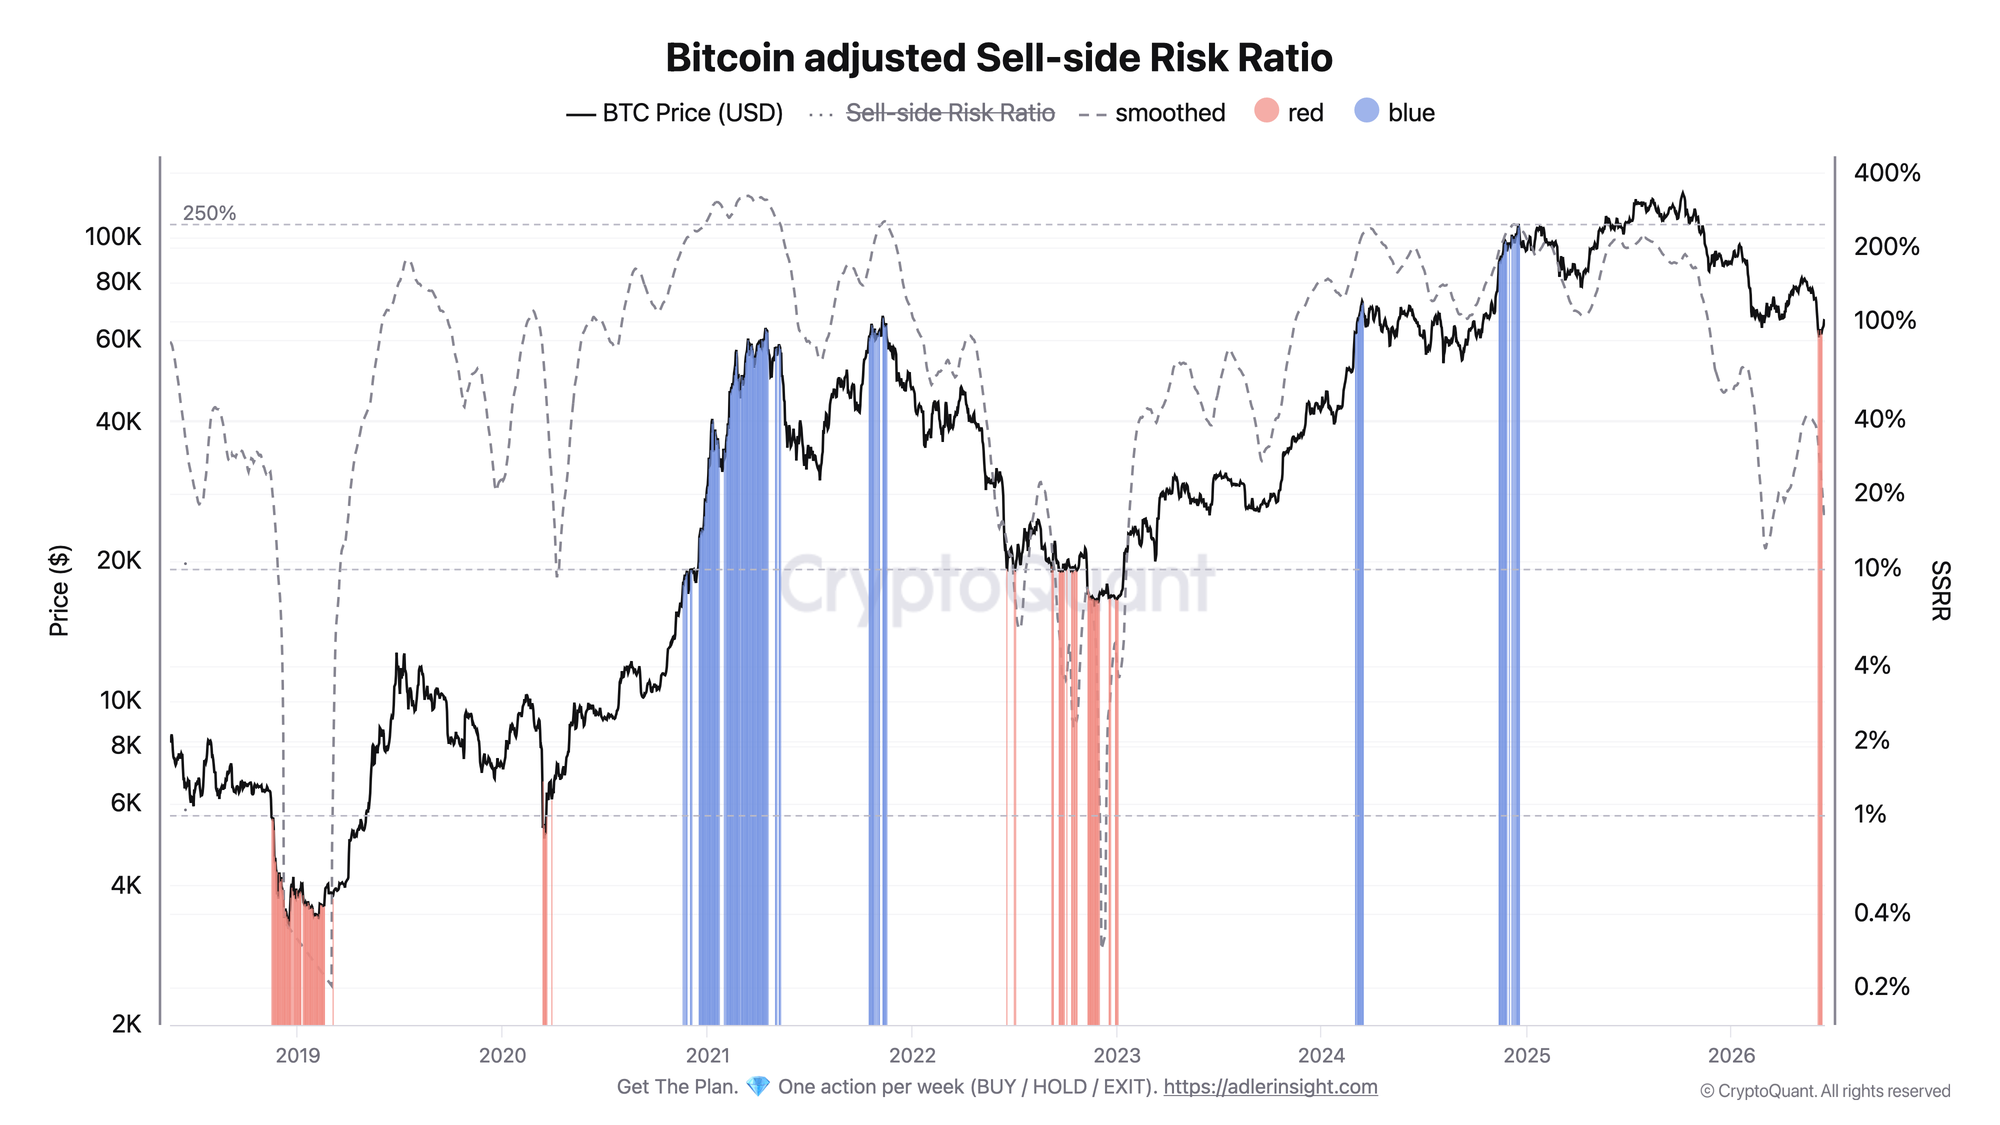
The metric compares the value of supply in profit and in loss against realized capitalization. High ratio values, the blue zone, show profit dominance and overheated market areas. Low or negative values, the red zone, point to deep unrealized stress, when a significant share of supply is underwater.
The smoothed line declined from the blue zone, which marked an overheated area in late 2024 and 2025. In early June, the indicator printed a series of red values around $60-61K and moved into negative territory.
Historically, these zones have coincided with local capitulation phases and bottom formation, as seen in 2019 and 2023. The price has now recovered to $66K, and the smoothed line has started to turn upward.
The red signal here does not mean an automatic reversal. It means the market has entered a phase of deep stress. Confirmation would come from the price holding above the red zone while the smoothed line continues to rise. The negative scenario is new red prints at lower price levels.
Bitcoin Cumulative Value Days Destroyed
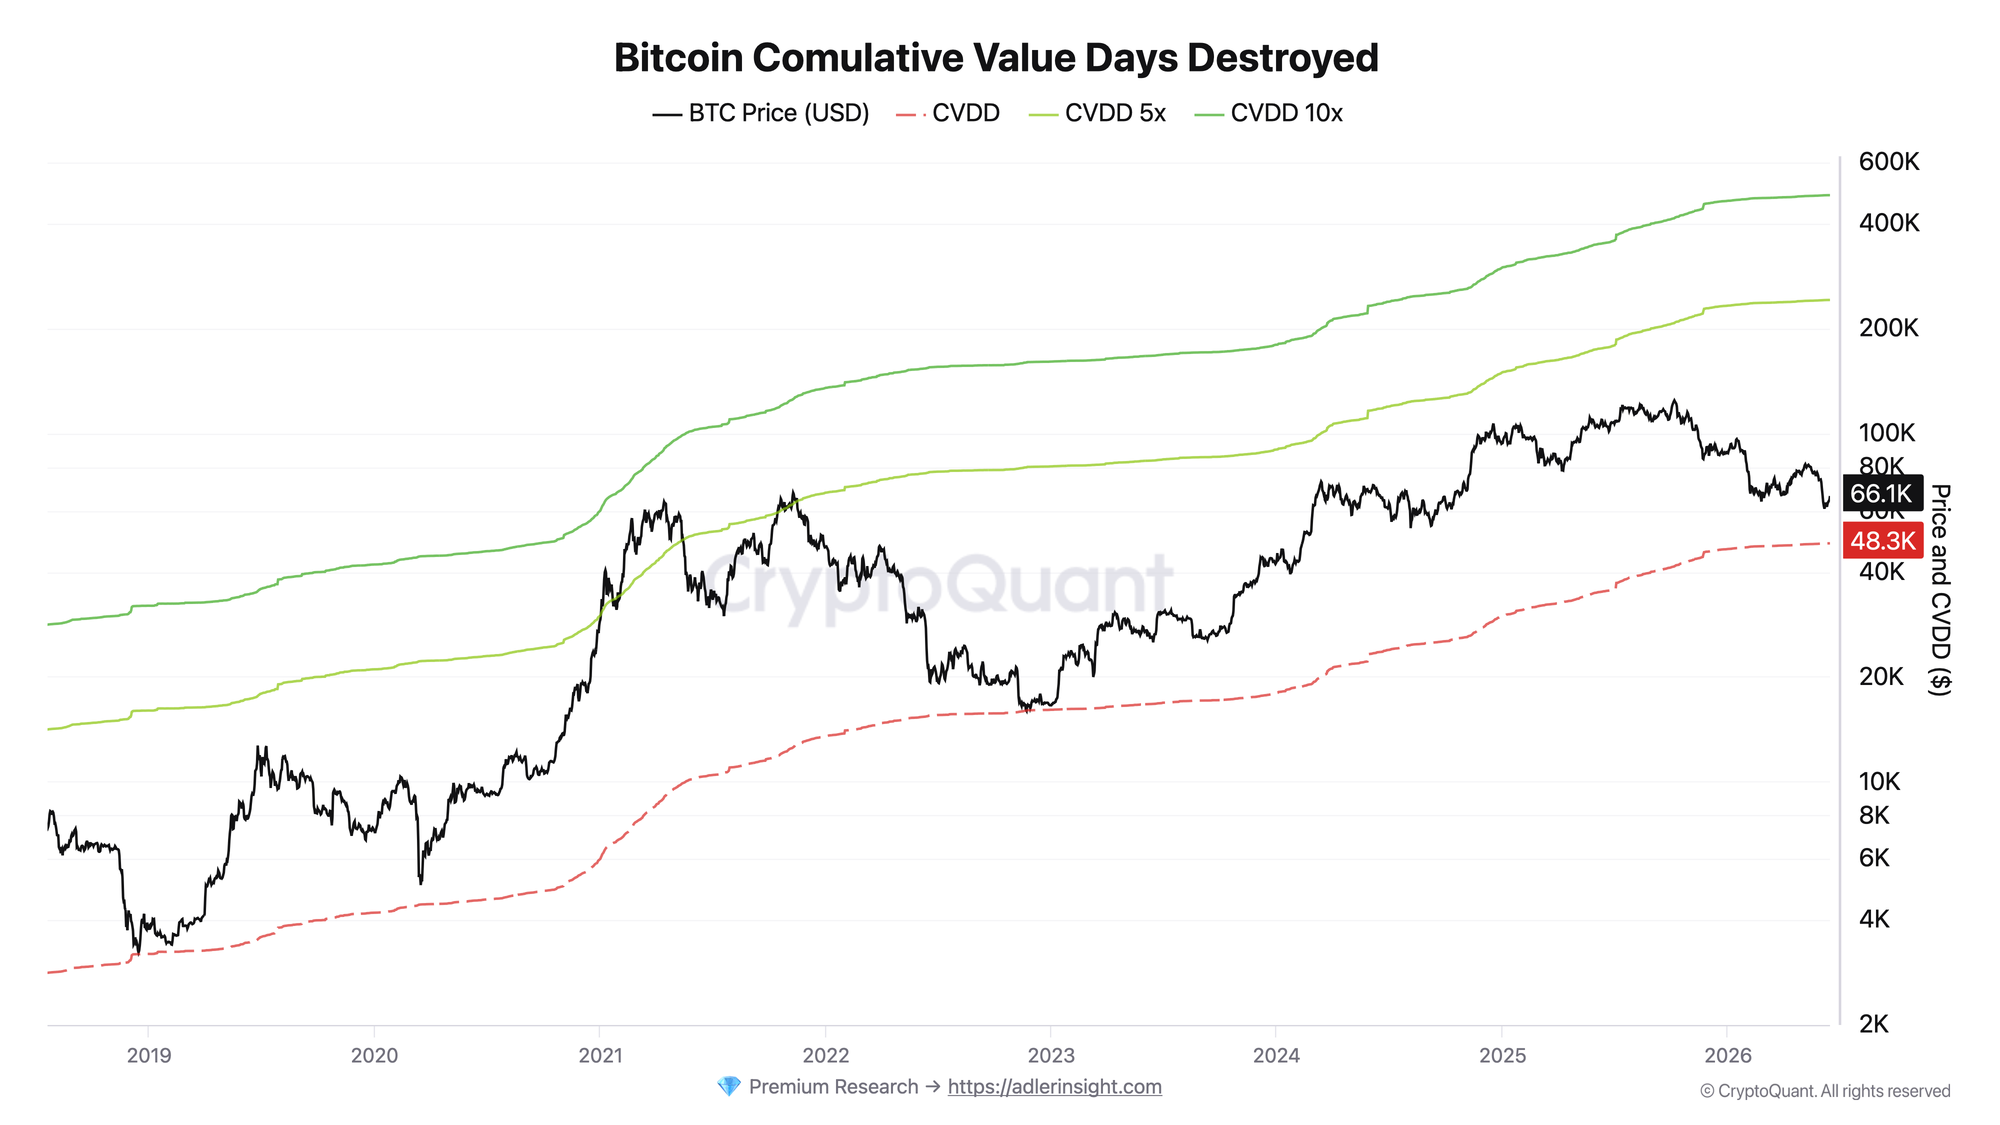
CVDD is a valuation model that estimates Bitcoin's lower boundary through the accumulated value of coins that moved, taking into account how long those coins had remained inactive. The model's base line has historically acted as the lower boundary of major market cycles.
CVDD currently sits at $48.3K, with Bitcoin trading at $66.1K. Across the full history, the price has almost never closed below this line, which is why the $48K area remains the key fundamental risk boundary on the downside.
As long as the price holds above CVDD, Bitcoin remains in the lower part of its historical valuation corridor, while the line itself keeps rising slowly, gradually lifting the potential cyclical bottom.
The link between the two charts gives the main takeaway of the day: SSRR showed deep holder stress around $60K, while CVDD points to the cycle's fundamental bottom at $48K. Together, they outline the accumulation zone where the market is now, while still leaving the risk of a final test lower.
Do not guess whether the market is healthy. DECISION TERMINAL shows if conditions support upside, if execution is working, and where Bitcoin sits in the cycle - all in one screen. Unlock Terminal.
FAQ
What does the red signal in adjusted Sell-side Risk Ratio mean?
It shows that the value of supply in loss has matched or exceeded the value of supply in profit relative to Realized Cap. This reflects holder conditions: a significant share of supply is underwater. Historically, these periods have often coincided with capitulation and market bottom formation.
Where is the regime-shift boundary?
On the downside, the key reference point is the $48K CVDD line. A sustained close below it would be a rare event and a signal that fundamental support has broken. On the upside, confirmation of recovery would come from the smoothed SSRR moving out of the red zone while the price holds above $60K.
CONCLUSION
The picture is shifting toward accumulation. The red SSRR zone around $60K shows that supply moved deeply underwater, while CVDD holds the fundamental bottom level at $48K. Both metrics point to the same area, but with different functions: $60K is the zone of behavioral stress, while $48K is the structural risk boundary.
The base takeaway: the market is already in the lower part of its valuation range, so the balance is shifting toward cautious risk-on. The main confirmation trigger is an upward turn in the smoothed SSRR while the price holds above the red zone. The main risk is new red prints at lower levels and a test of CVDD around $48K.
Live Charts
Explore the metrics behind this brief with live, auto-updating charts:
NUPL - Net unrealized profit/loss across holders, mapped into cycle sentiment phases.
MVRV Ratio - Market value vs realized value to identify valuation regimes and cycle risk.
Realized Price Bands - Dynamic realized-price valuation zones from live BTC price and on-chain cost basis.
Realized Price - Aggregate on-chain cost basis compared with BTC price and long-term trend.
Bitcoin Rainbow Chart - Volatility-adjusted rainbow model for long-term valuation zones and cycle stretch.