
🎧 Morning Brief #191 - audio debate on today’s market setup
Price has bounced from the $60K zone to the current $65.6K, and the combination of these two derivatives indicators points to the following picture. Taker Buy Sell Ratio highlights the return of aggressive buyers, while Funding Rate remains positive.
TL;DR
The bounce off $60K is being driven by returning buyers, not a short squeeze. Taker Buy Sell Ratio closed above 1.0 in 8 of the last 10 days, while Funding Rate stayed positive for 10 straight days from June 6 to June 15. That means the rally is being supported by aggressive demand, but at the same time it shows that long leverage is starting to build up again.
Bitcoin: Taker Buy Sell Ratio
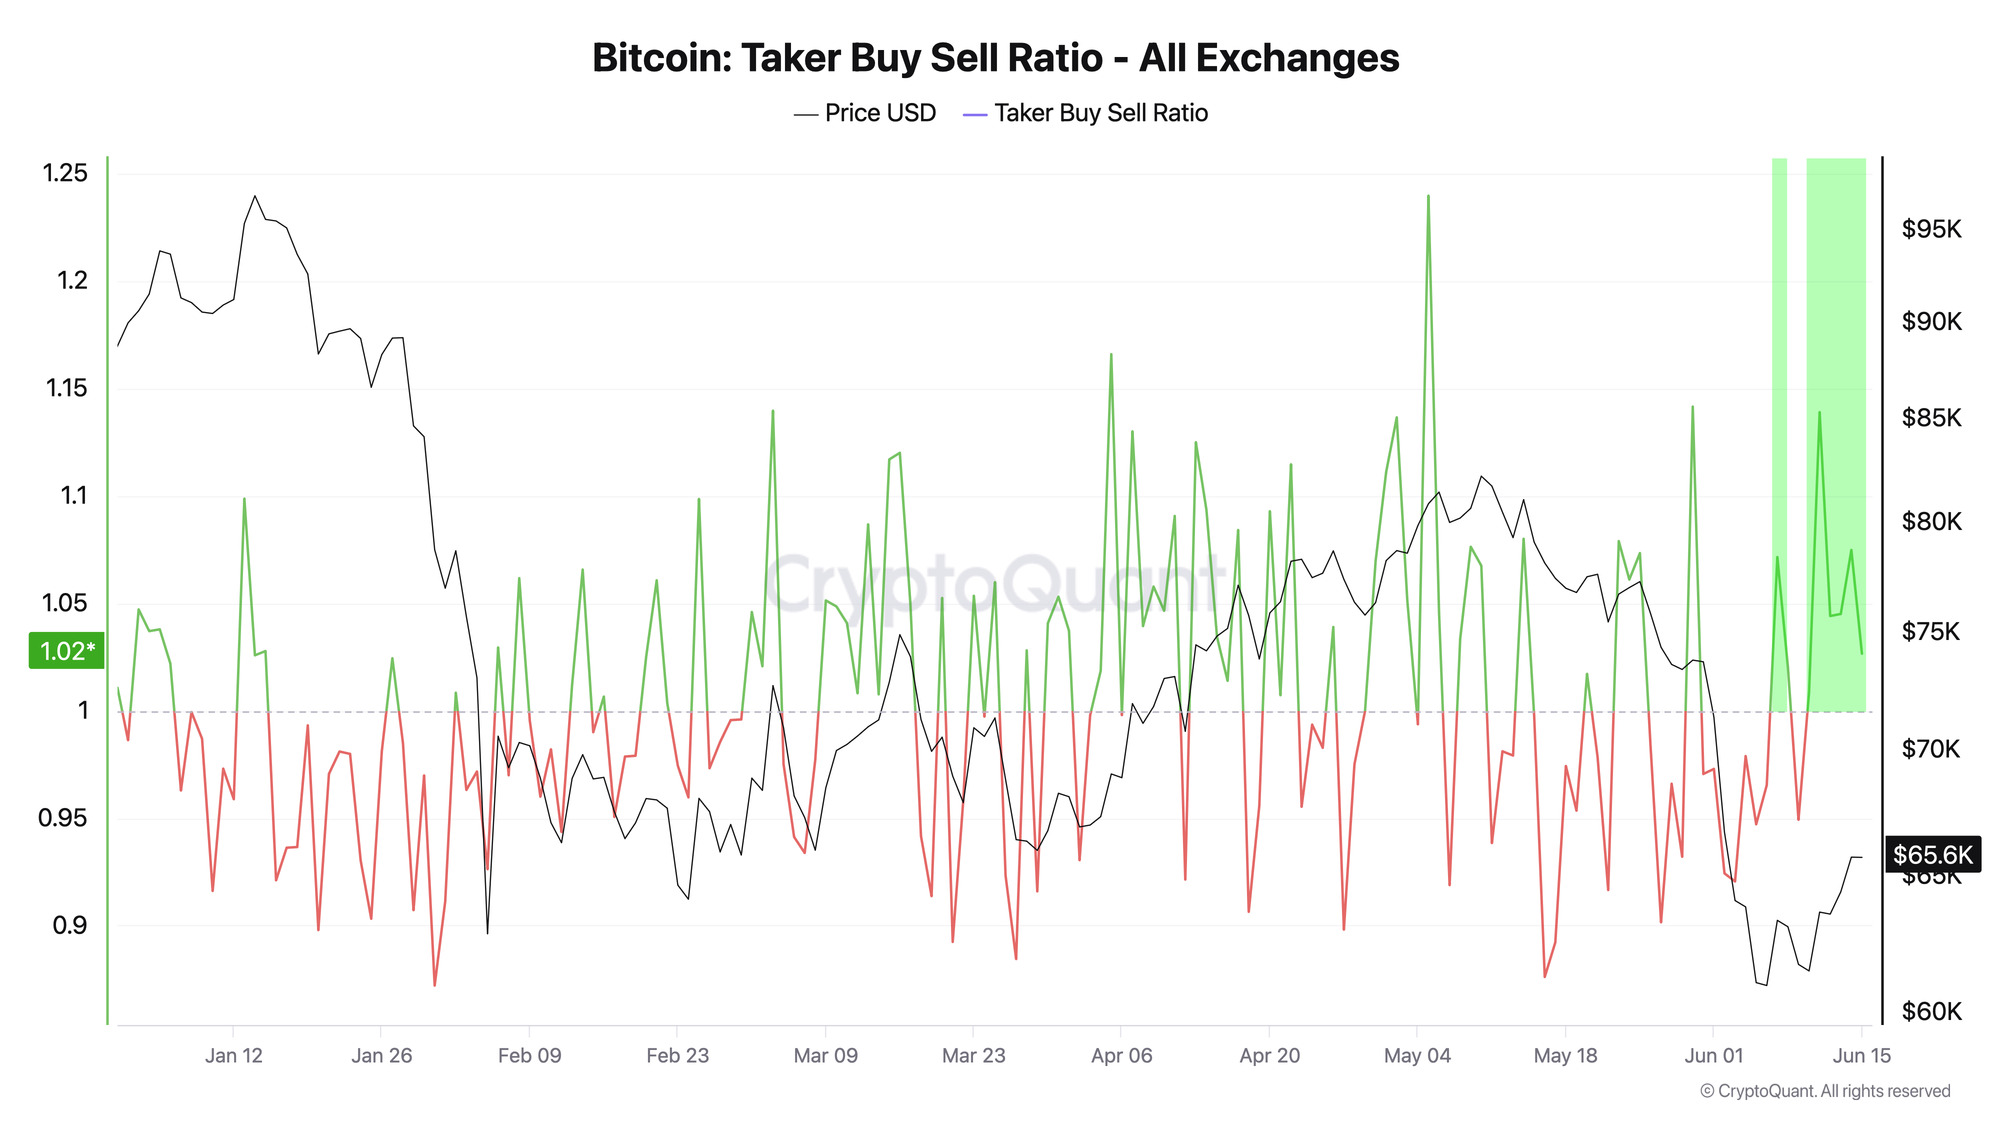
This metric reflects the balance of market orders. Readings above 1.0 mean aggressive buyers are in control, while readings below 1.0 mean aggressive sellers dominate.
During the decline toward $60K, from late May through June 5, the ratio mostly stayed below 1.0. Only 2 out of 12 days closed above 1.0, while the average reading was around 0.98. That meant sellers were in control.
From June 6, the picture changed. As many as 8 of the next 10 days closed above 1.0, the average rose to around 1.03, and the local peak reached 1.14 on June 11. The current reading near 1.02 confirms that buyers are still in control.
Conclusion: the market has gone through a reversal in order flow structure in favor of demand. The warning sign would be a move back below 1.0 for several days in a row, as briefly happened on June 9.
Bitcoin: Funding Rates
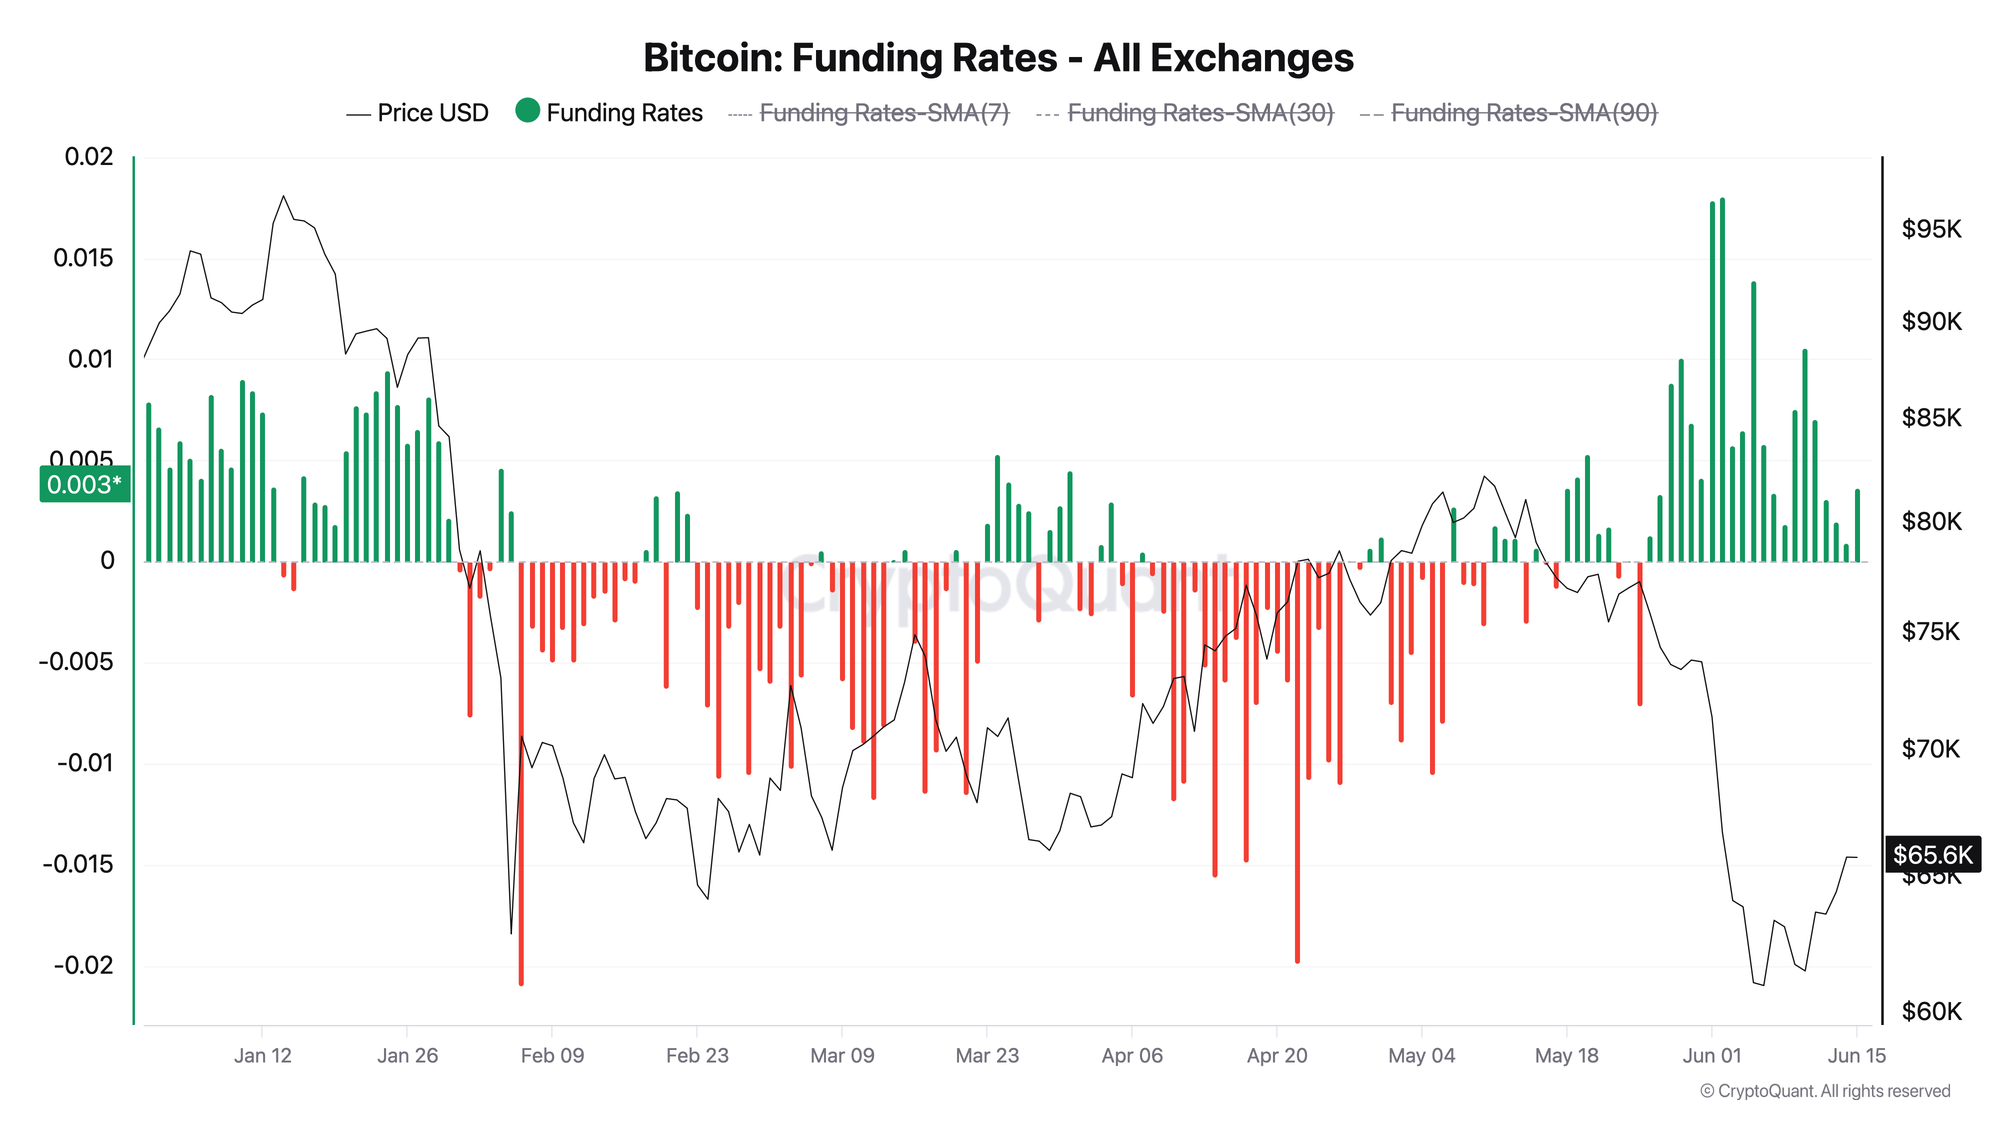
Funding Rate shows which side is paying to hold leverage. Positive readings mean longs are paying shorts, while negative readings mean shorts are paying longs. In other words, the sign of Funding Rate helps show which way leveraged positioning is tilted.
In a classic short squeeze ahead of a rally, funding usually turns negative: most of the market is leaning short, and then those positions start getting squeezed out. Here the picture is different. From June 6 through June 15, Funding Rate stayed positive for all 10 straight days. This is an important signal. The market was not structurally tilted toward shorts even after testing $60K.
At the same time, Funding Rate is not neutral, but positive. That means long leverage is already back in the system. Positive funding by itself does not make the rally strong, it simply shows that longs are once again willing to pay to hold their positions.
Conclusion: Funding Rate confirms that the rebound from $60K was not a short squeeze, while also warning that the market is once again starting to carry long leverage. As long as funding stays positive without a new spike, that is normal. But if it starts accelerating sharply again without further improvement in demand, the market will become more vulnerable.
Stop letting Bitcoin volatility make the decisions for you - start your 7-day free trial. Weekly Engine tells you when to hold, when to reduce risk, and when the market regime is breaking down. One clear action per week, built to protect capital before the next drawdown hits.
FAQ
Is this a bullish or bearish signal? On its own, it is neither. In the current context, it is more of a neutral-to-positive signal: the rally is being driven by demand, but if funding rate starts rising too quickly, that would point to overloaded longs.
What would invalidate the current bullish scenario? A sustained move back below 1.0 in Taker Buy Sell Ratio together with an acceleration higher in Funding Rate. That would mean leverage is still there, while the real demand underneath it is fading.
CONCLUSIONS
Taken together, these two metrics paint a consistent picture. After the drop to $60K, the flow of market orders turned back in favor of buyers - Taker Buy Sell Ratio closed above 1.0 in 8 of the last 10 days. At the same time, Funding Rate remained positive for 10 straight days from June 6 to June 15, with an average reading of around 0.0046 and a current level near 0.0037.
That means two things at once. First, the rally does not look like a classic short squeeze, because the market was not deeply tilted toward shorts. Second, long leverage is already starting to come back into the system. That is why the current regime can be described as cautious risk-on: the move is being driven by demand, but its durability now depends on whether that demand can hold up without a new funding-driven overheating.
Live Charts
Explore the metrics behind this brief with live, auto-updating charts:
Funding Rates - Perpetual futures funding to track long-side or short-side leverage pressure.
Open Interest (BTC) - Total futures positioning and 7-day BTC-denominated change.
Coinbase Premium Index - Coinbase vs global market premium as a proxy for US spot demand pressure.
Fear & Greed Index - Composite market sentiment for risk appetite and sentiment extremes.