
🎧 Morning Brief #190 - audio debate on today’s market setup
Bitcoin is moving onto exchanges in size, while stablecoin liquidity is leaving them. Two charts show why the drawdown from the May highs looks structural.
TL;DR
This brief is about the reversal in flows from May to the present. The logic is simple: BTC inflows to exchanges increase supply pressure, while stablecoin outflows deprive the market of fuel for a rebound.
Bitcoin 30D Net Flow (BTC)
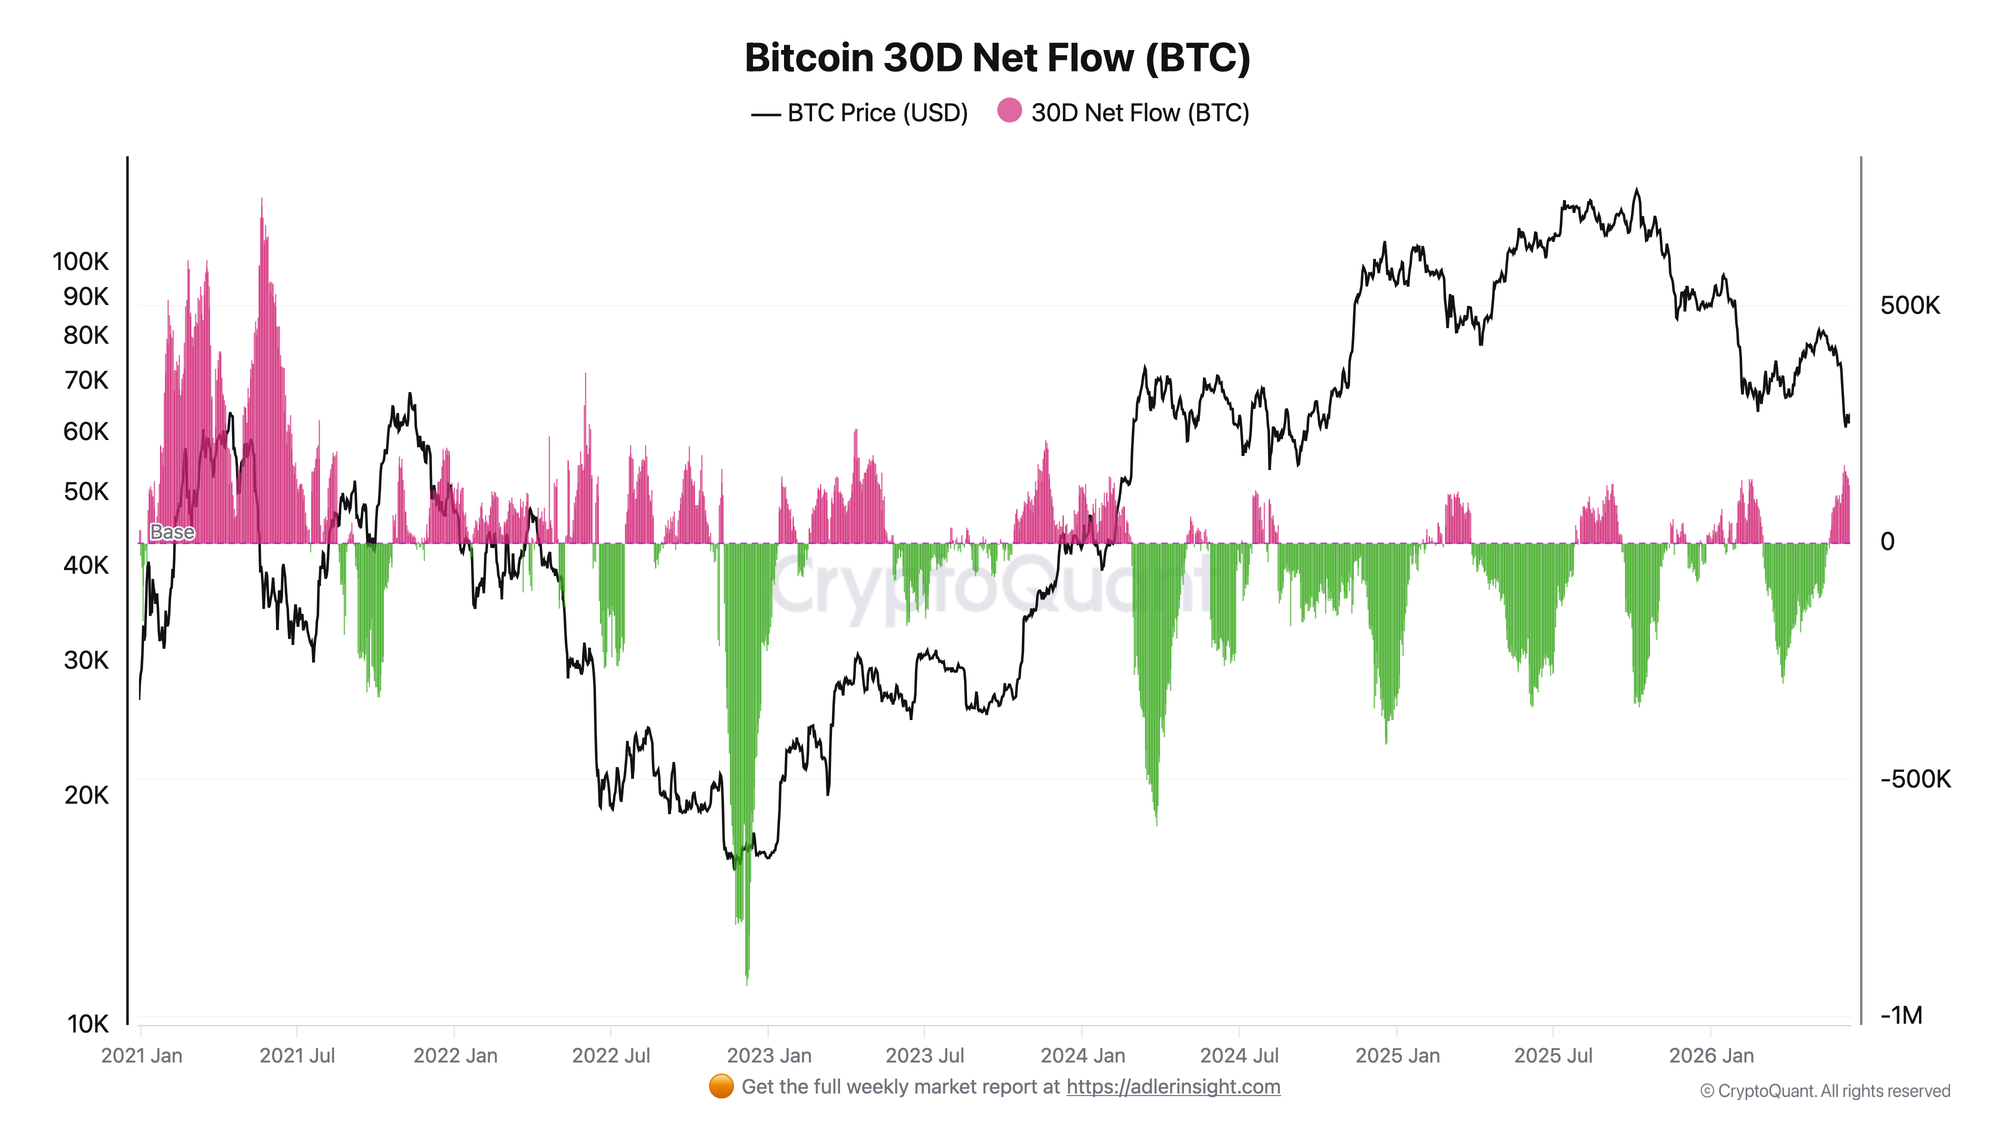
The metric shows the net 30-day flow of BTC to exchanges: positive values (pink) - inflows and sell pressure, negative values (green) - outflows and accumulation.
At the beginning of May, the flow was negative, roughly in the -85K to -115K BTC range. Coins were leaving exchanges, and the market was in an accumulation phase. Around May 18, the regime reversed: the flow turned positive and began rising rapidly, reaching a peak of about +167K BTC in early June. As of June 12, the value remains highly positive - around +114K BTC. This is already distribution: holders are moving coins to exchanges to sell.
The deterioration signal will remain in place until the flow returns below zero. The slight easing of recent days, from +167K to +114K, still only means a slowdown in inflows, not a regime change.
Stablecoin Net Flow - 30D SMA
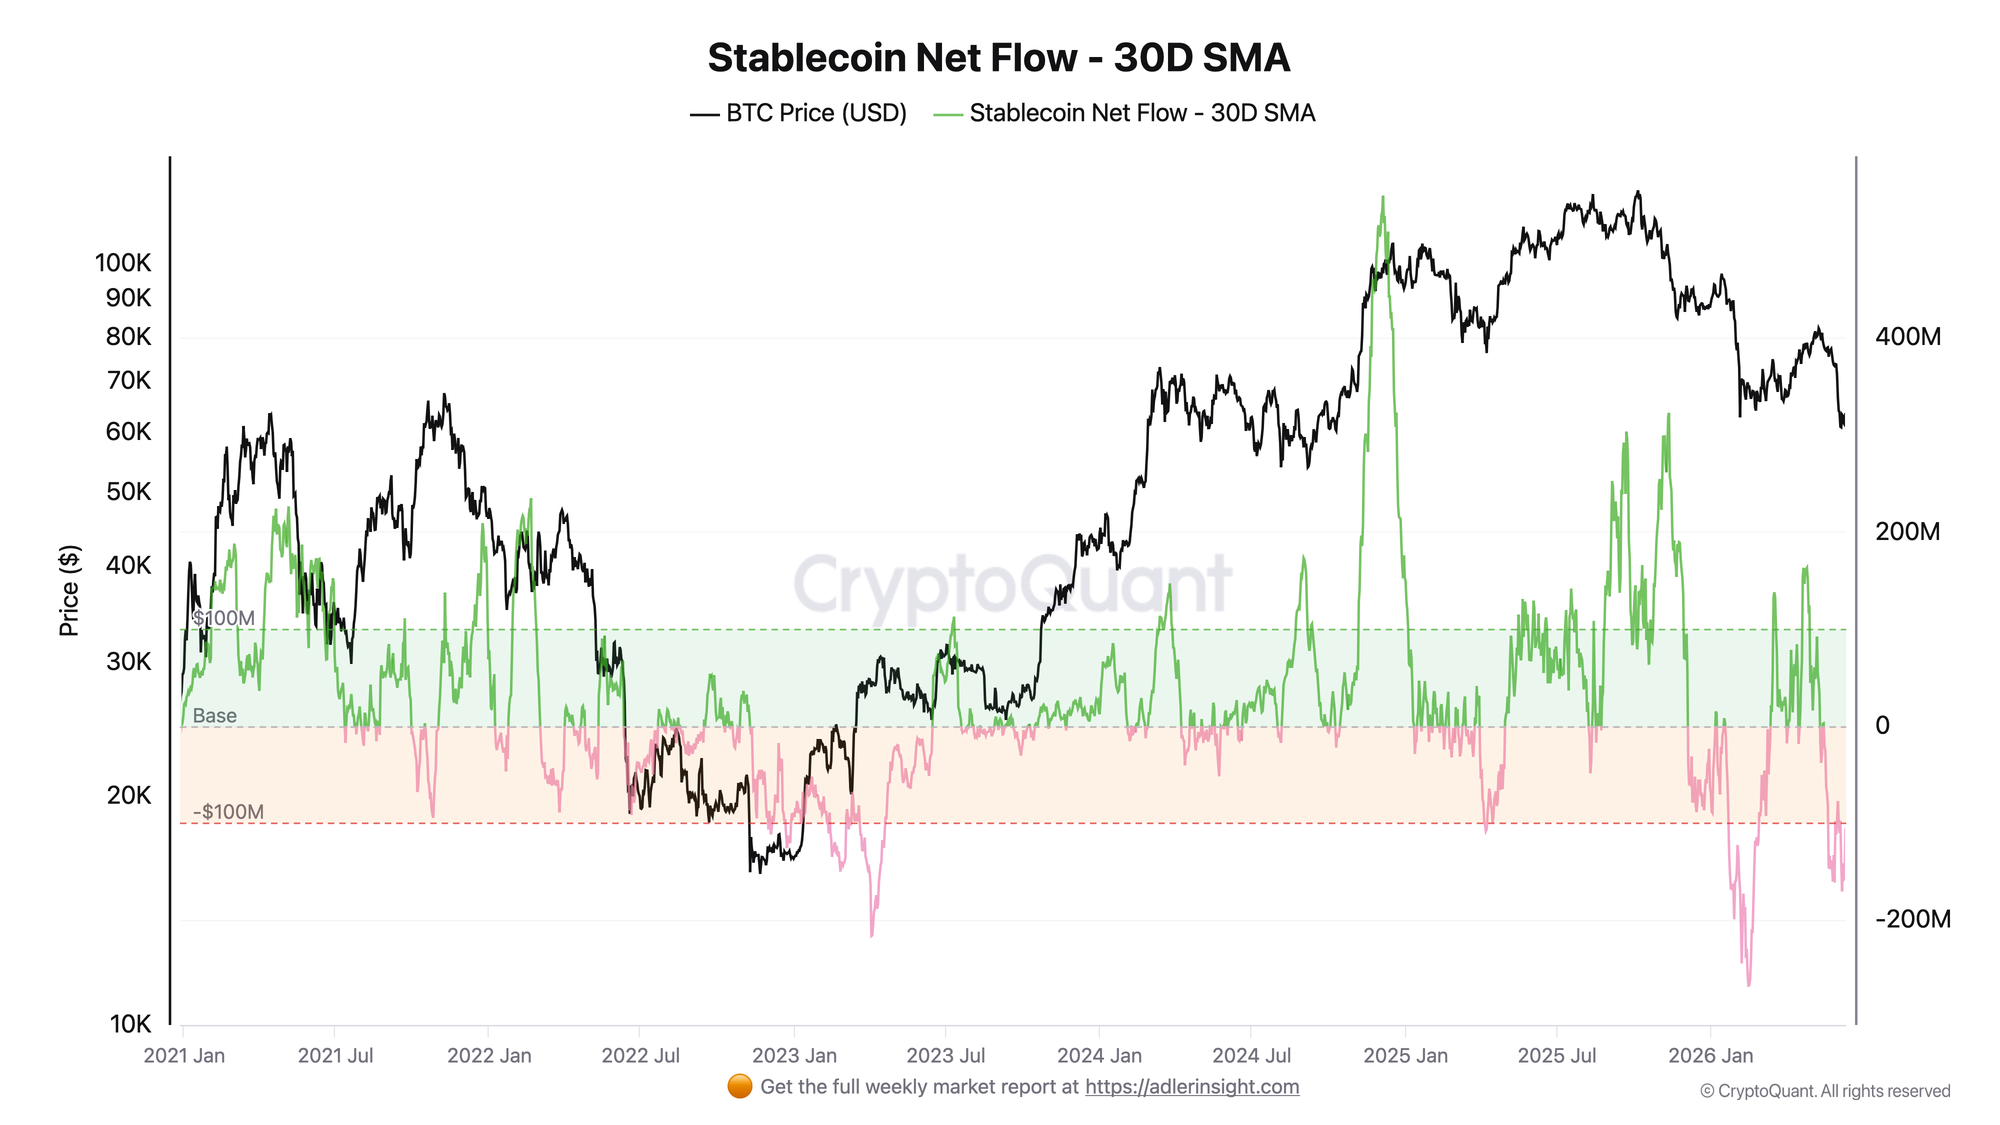
The metric, smoothed with a 30-day SMA, shows the net flow of stablecoins to exchanges: positive values - an inflow of buying liquidity, negative values - its outflow.
At the beginning of May, the flow was positive, roughly in the +40M to +90M range. "Dry powder" for purchases was coming onto exchanges. From mid-May, the metric moved into negative territory and deepened to -150M...-170M in early June. As of June 12, the flow stands at about -105M and remains deeply negative below -$100M. Buying liquidity is not coming in, it is leaving - demand is weakening.
The link to the first chart is direct and reinforcing: while BTC is moving onto exchanges and increasing supply pressure, stablecoins are leaving and reducing demand. There are sellers, but fewer and fewer buyers. It is precisely this combination that explains the 22% decline from the May highs. The key factor right now is the synchronous deterioration on both sides of market liquidity.
Buy and Hold works until the wrong 30% drawdown destroys your confidence. Weekly Engine helps you stay exposed when conditions are healthy and step aside when risk starts rising - so you can follow a process instead of guessing under pressure. Start 7 days free.
FAQ
Why does the drawdown since May look structural rather than like a normal correction?
Because both flows confirm the same move: BTC is moving onto exchanges, increasing supply, while stablecoins are leaving, weakening demand. When both sides of the market are working against price at the same time, the move is driven by structure rather than news noise.
What would signal a regime shift back to bullish?
A return of net BTC flow below zero, meaning a resumption of outflows from exchanges, together with a return of stablecoin flow above zero. As long as both indicators remain in bearish territory, any rebounds should be treated as technical.
CONCLUSIONS
Since May, the picture has remained clear: bitcoin is moving onto exchanges, +114K BTC against a recent peak of +167K, while stablecoin liquidity is leaving, -105M against a low of -170M. Supply pressure is rising against a backdrop of weakening demand. That is exactly what explains the 22% price decline from the May highs and keeps the market in a risk-off regime.
The main trigger for a reversal is a synchronous reversal in both flows - BTC outflows from exchanges and stablecoins returning to exchanges. The main risk is further deterioration in both metrics, under which the market would be left without enough liquidity to sustainably stop the decline. The slight easing of the last day is a reason to watch, but not yet confirmation of a reversal.
Live Charts
Explore the metrics behind this brief with live, auto-updating charts:
Exchange Netflow - Net BTC moving to and from exchanges across positive and negative flow regimes.
Coinbase Premium Index - Coinbase vs global market premium as a proxy for US spot demand pressure.
BTC US ETF Flow Monitor - US spot Bitcoin ETF daily flow, BTC-denominated accumulation, and fund leadership.
STH-SOPR - Short-term holder profit/loss behavior around the 1.0 breakeven threshold.