
🎧 Morning Brief #100 - audio debate on today’s market setup
The drop from $72K to $59K triggered the largest cascade of long liquidations since the start of the year. Short-term holders sent a record volume of losses to exchanges this year.
TL;DR
On-chain and derivatives are signaling capitulation in sync: STH are realizing extreme losses, while long liquidation dominance has reached the 2026 high. Historically, such extremes have formed local bottoms.
Bitcoin Short-Term Holder P&L to Exchanges Sum 24H
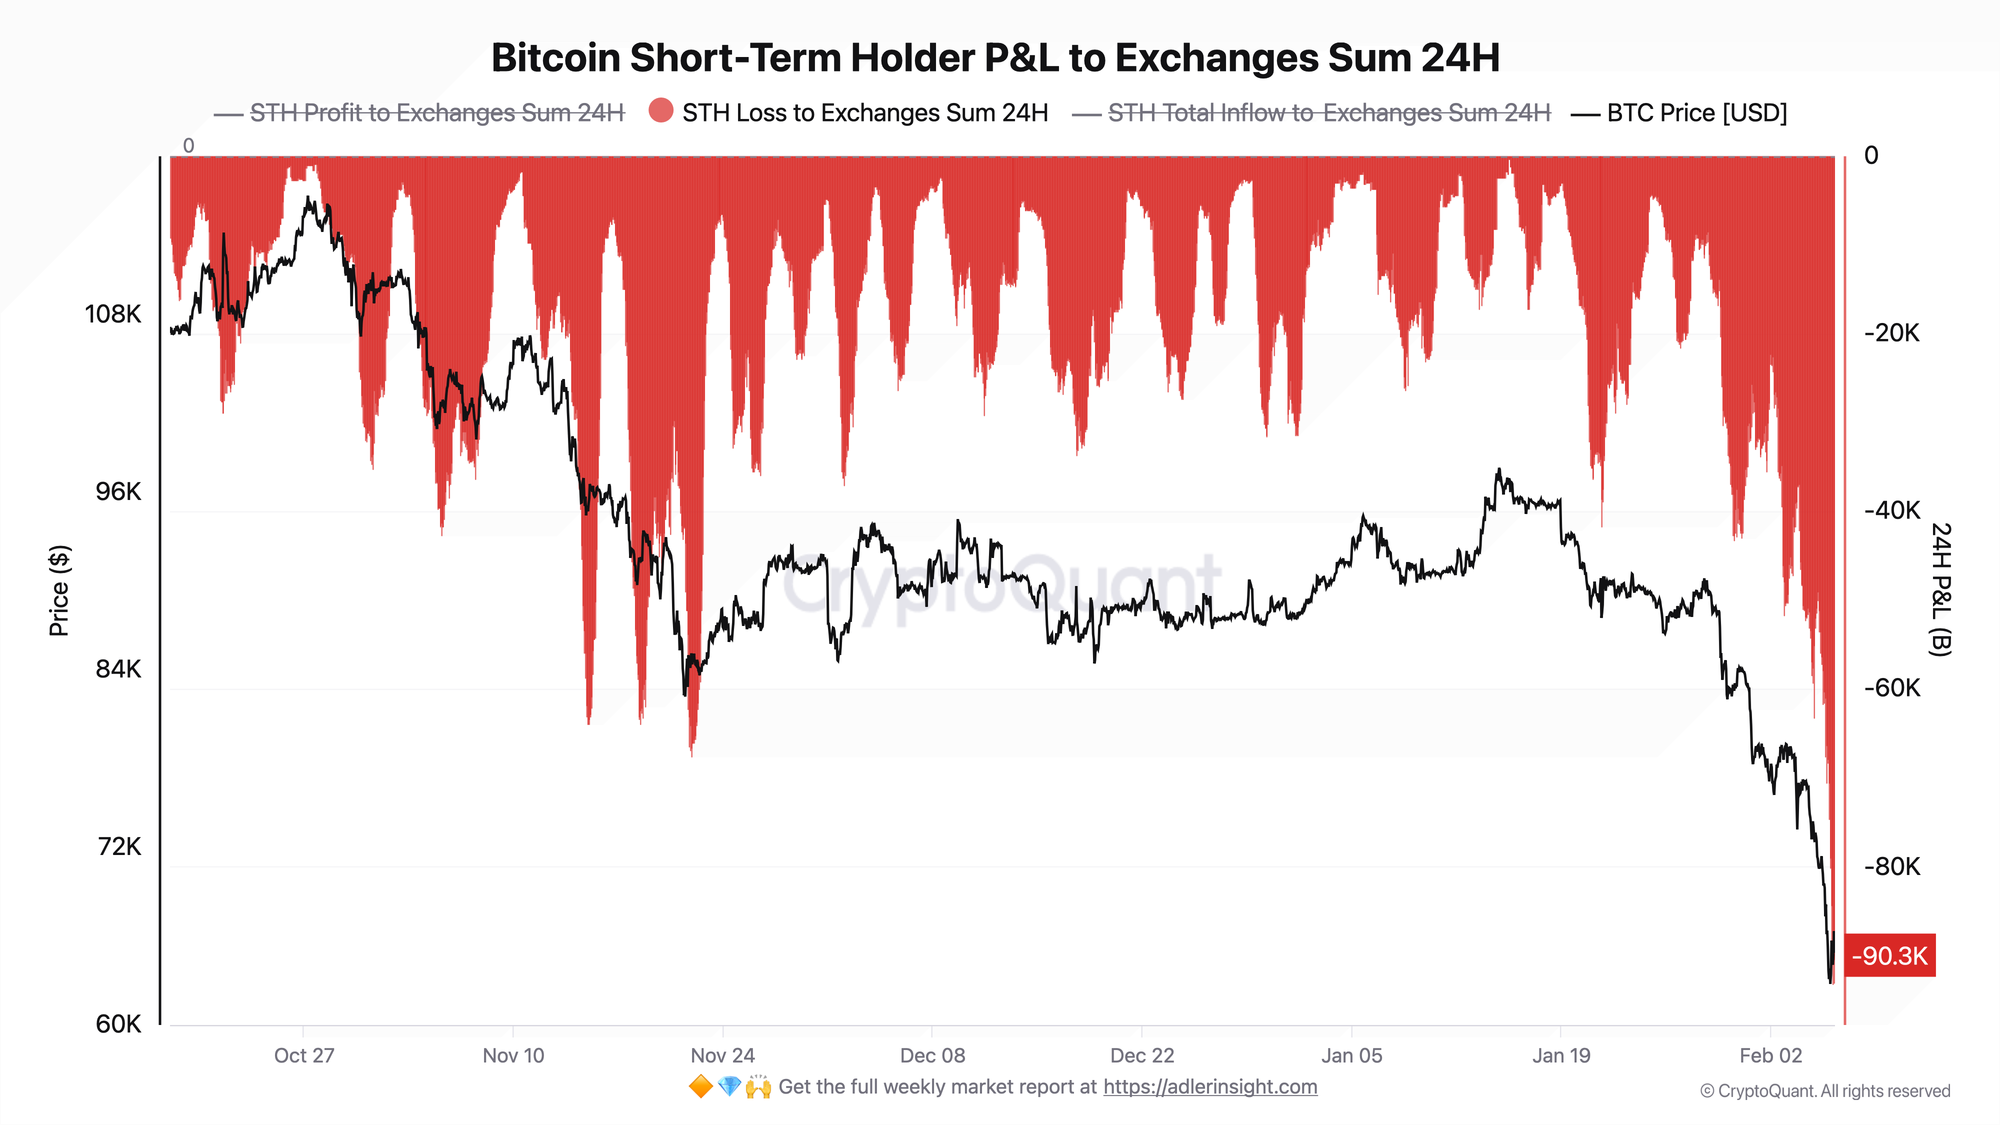
The metric reflects realized P&L of coins transferred to exchanges by short-term holders. The red zone represents losses (coins sent to exchanges at a loss), with depth indicating the scale of capitulation.
The indicator collapsed to an extreme value of around -90K BTC, the largest dump of STH losses to exchanges in the entire observed period. For comparison: previous local extremes in November reached -40-60K BTC. The current level is double any spike in recent months. Note the structure: the red zone expanded sharply and vertically, characteristic of panic selling rather than gradual distribution.
Extreme loss dumps historically accompany the capitulation phase. The key reversal signal is a narrowing of the red zone as price stabilizes. Until then, the risk of continued pressure remains.
Bitcoin Futures Long Short Liquidations Dominance
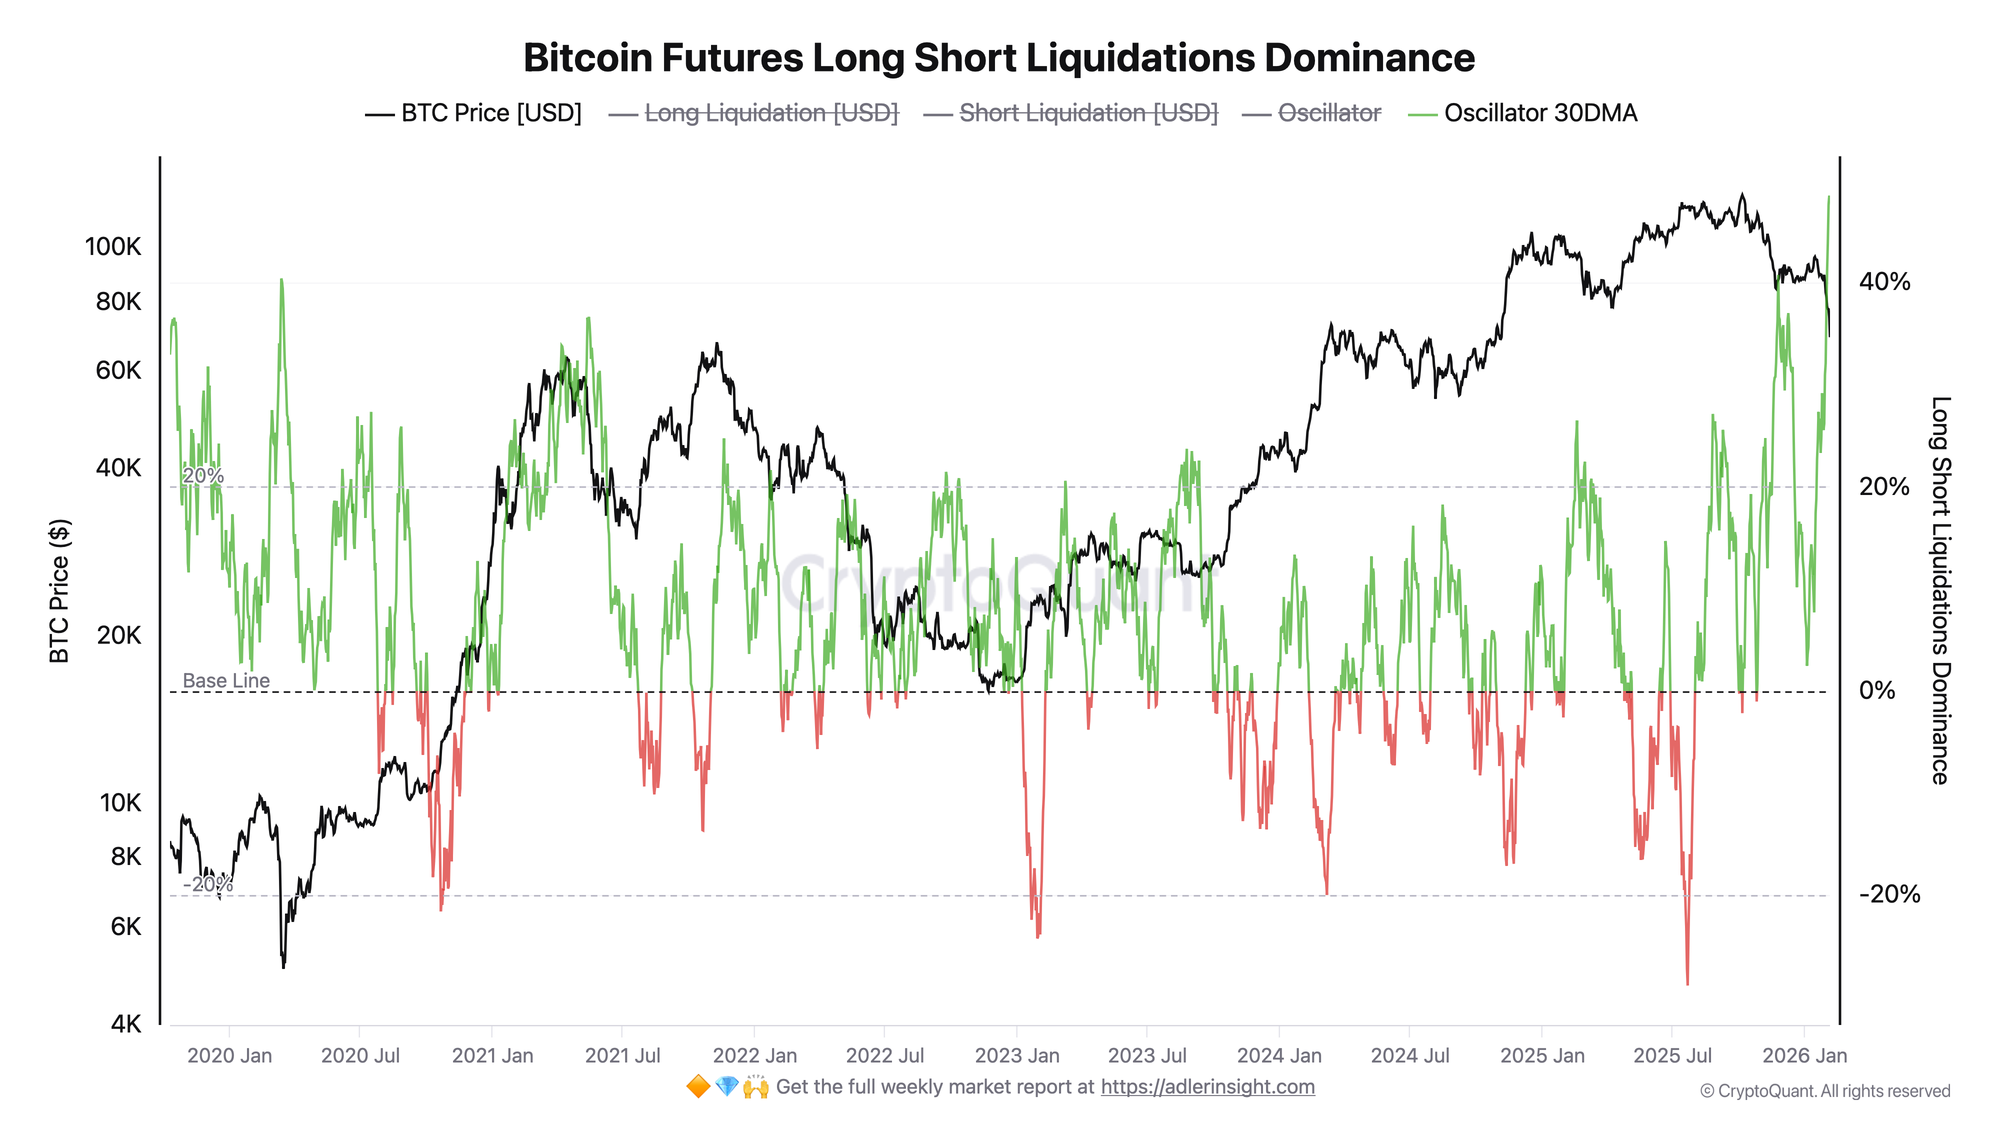
The oscillator measures the dominance of one side in liquidations: values above zero indicate long liquidation dominance, below zero indicates short liquidation dominance. The 30-day moving average smooths out noise.
February 5th recorded $688M in long liquidations, the highest since the start of 2026. The 30-day oscillator moving average rose to 47-48%, one of the highest values in the past five years. The green line on the chart shows a sharp vertical rise, a sign of cascading liquidations where closing one position triggers the next.
Both charts paint a consistent picture: the spot market (STH losses) and derivatives (long liquidations) have reached extremes in sync. This convergence of signals increases the probability of a local bottom, but requires confirmation through price stabilization and reduced pressure.
Narratives change faster than portfolios.
The 7-layer Bitcoin strategy replaces opinions with a rules-based playbook you can actually execute.
→ Unlock the full Bitcoin playbook and weekly signals
FAQ
Why is the current liquidation level important?
$688M in a single day is the highest since the start of the year, showing that leverage was extremely high before the drop. Mass long closures create a cascade effect: liquidating one position pushes the price lower, triggering the next. When this process ends, the market clears excess leverage.
What signals will confirm bottom formation?
A combination of three factors is needed: reduced STH loss volume to exchanges (narrowing of the red zone on the first chart), return of the liquidation oscillator to the neutral zone around 0%, and price holding above $60K for several days. The absence of any of these factors maintains the risk of continued decline.
CONCLUSIONS
The milestone 100th brief marks a point of maximum stress: synchronized capitulation across spot and derivatives markets. STH sent a record volume of losses to exchanges (~90K BTC in 24 hours), while long liquidation dominance at $688M per day reached the 2026 high. Current regime is maximum stress with signs of a capitulation phase. Historically, such extremes have formed accumulation zones, but confirmation of a bottom requires price stabilization above $60K and reduced pressure on both markets. Main risk for the weekend: continued cascade if $60K breaks could intensify forced selling. Main trigger for improvement: holding current levels and STH flows turning positive.