
🎧 Morning Brief #171 - audio debate on today’s market setup
The market has undergone a regime shift. Two indexes - Bitcoin Bull-Bear Structure Index and Bitcoin Price Structure - show the same thing: the bulls' attempt to hold above neutrality in early May failed. The bearish segment is now dominant again, while there is still no strong resistance from demand.
TL;DR
Two structural signals confirm one conclusion: bulls have lost control. The market failed to hold above the zero zone, sellers absorbed the bullish impulse, and price is once again pinned to the lower part of the structure.
Until BTC restores its position above key levels and gets confirmation from buyers, the regime remains risk-off.
Bitcoin Bull-Bear Structure Index
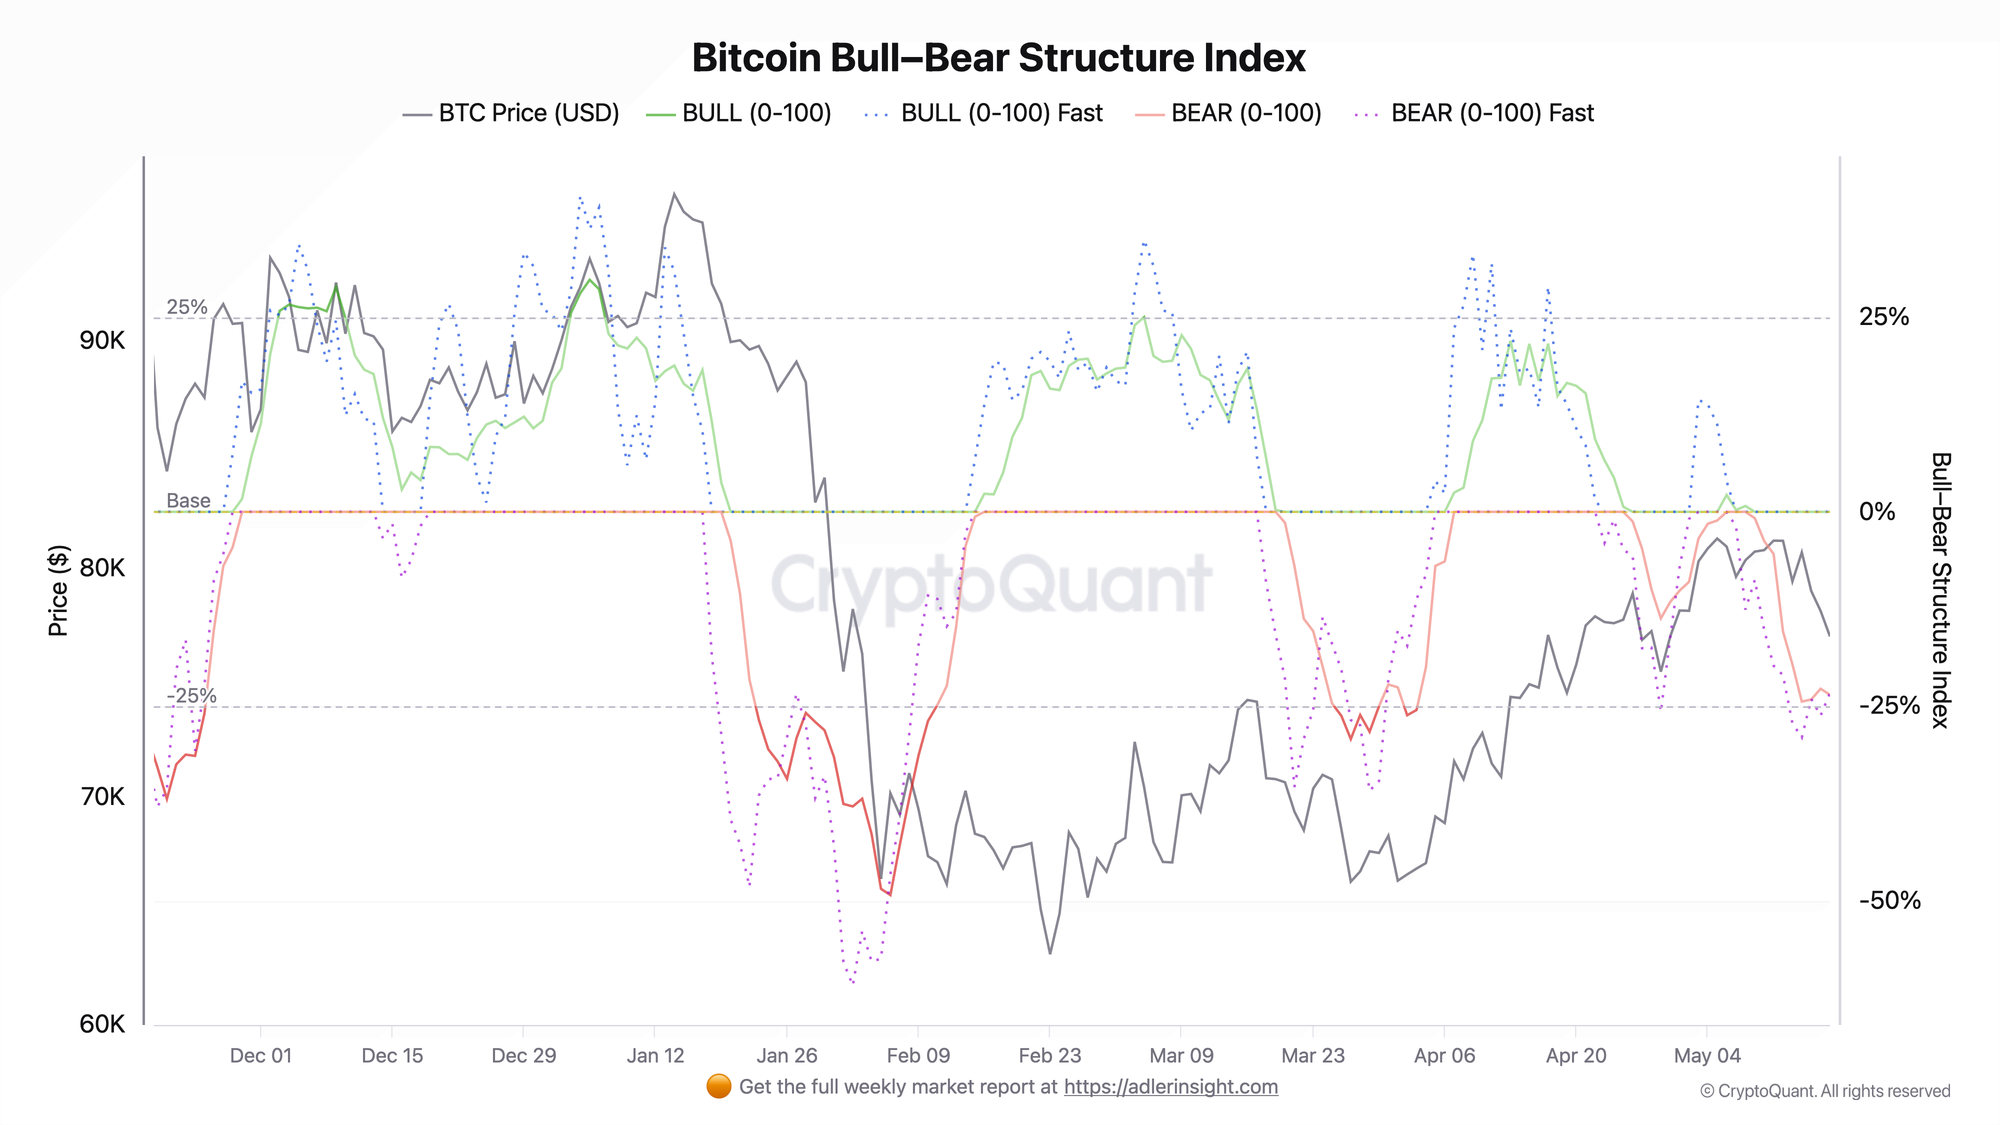
The index is built on six market signals: taker imbalance, open interest pressure linked to price direction, funding rate, ETF flows, net exchange outflow, and price position relative to MA20. Positive values indicate a bullish structure, while negative values indicate a bearish one.
In the first days of May, the SLOW version of the index managed to move above zero. On May 6, the value reached +2.16, while the FAST line rose to +14. Formally, the market entered a bullish regime, but the signal intensity was weak. Already on May 9-10, both lines turned lower: SLOW moved below zero on May 9 to -0.82, and by May 17 it had fallen to -23.49. The FAST version also dropped to -23.24.
The key point here is not the level itself, but the duration of the signal. The attempt to hold above zero lasted less than three trading days. After that, seller pressure completely absorbed the bullish impulse.
The index is now in a stable bearish regime with no signs of reversal. A regime shift requires the SLOW line to return toward zero, and that would require a synchronized improvement in at least two or three components, primarily taker imbalance and ETF flows.
Bitcoin Price Structure Composite Signal
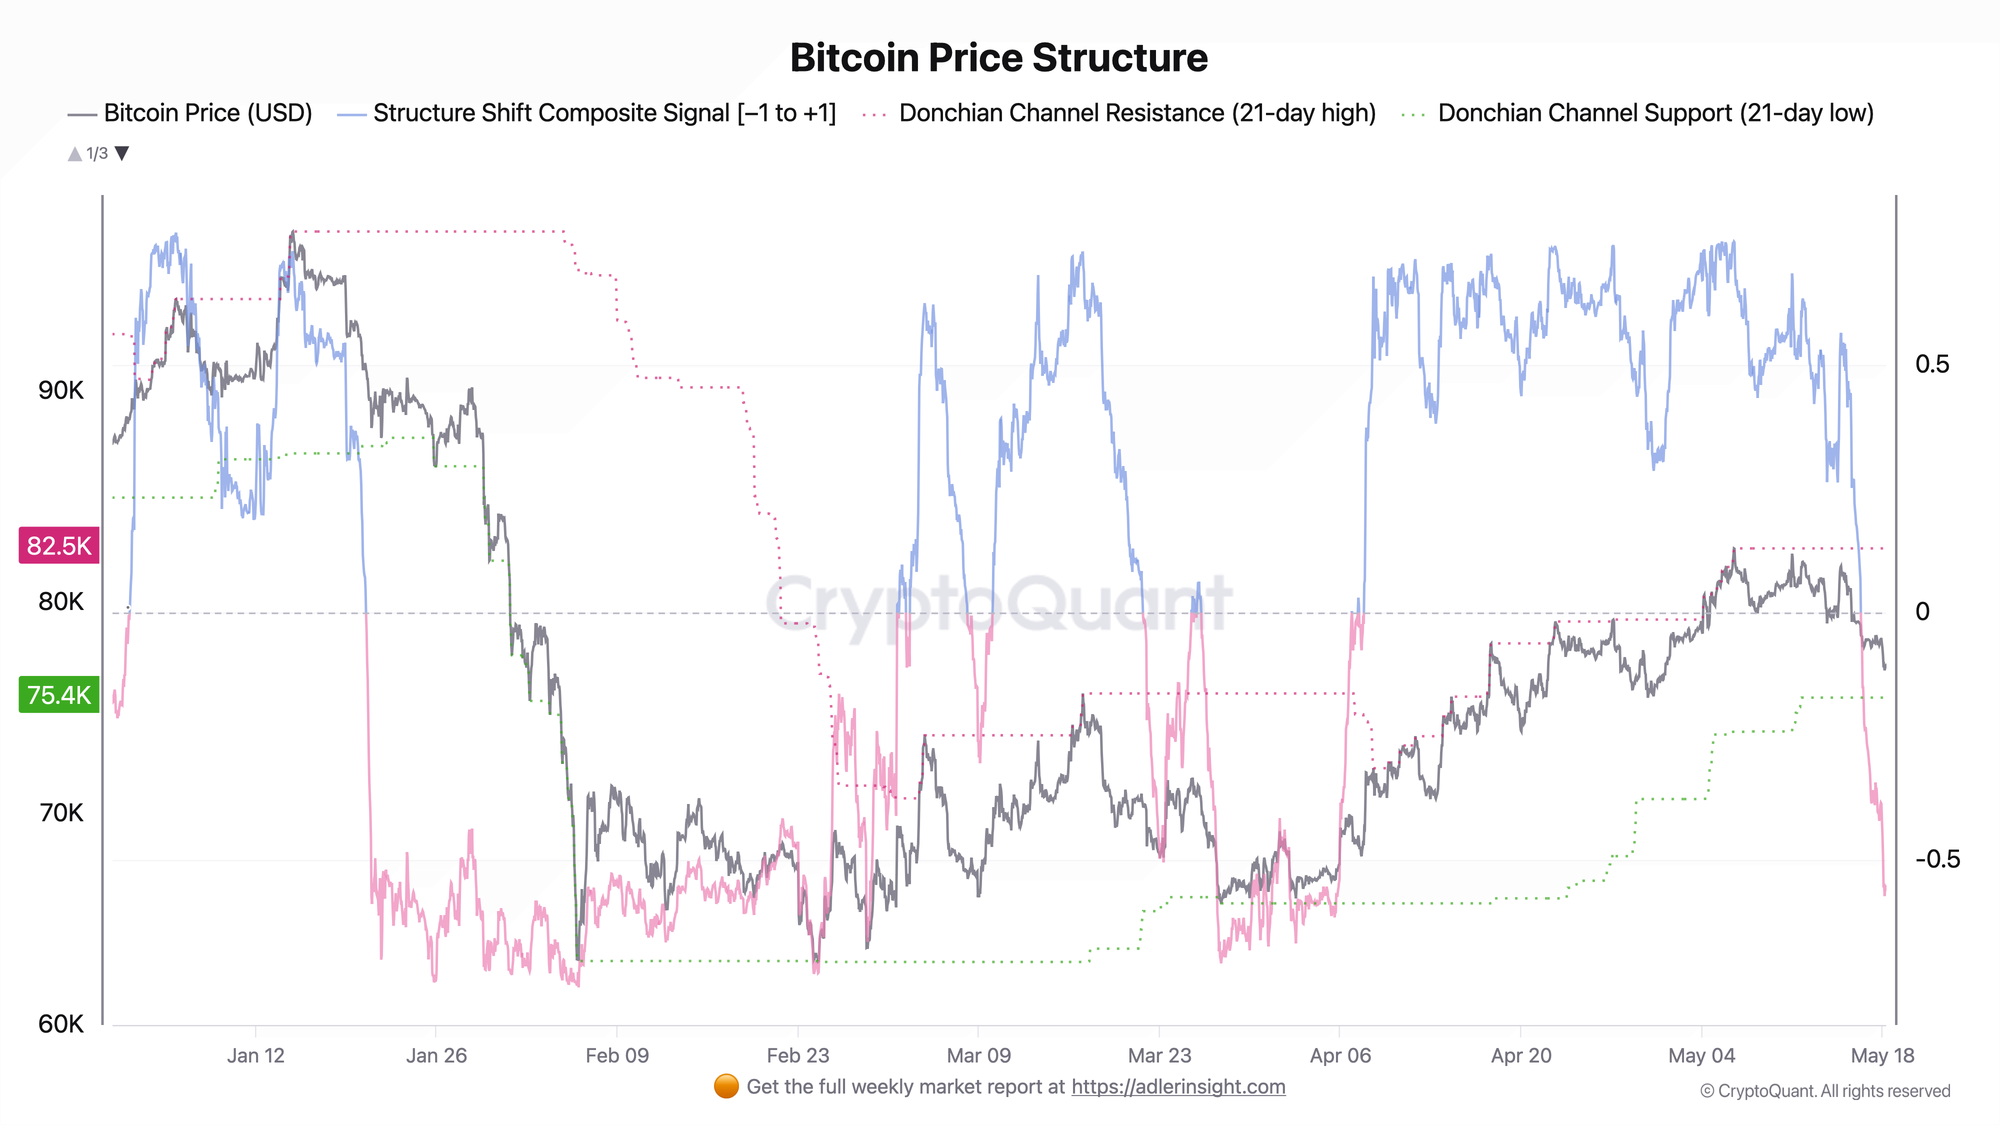
Price Structure shows where price is now relative to its short-term structure: closer to strength or weakness. The higher the value, the more control buyers have. The lower the value, the stronger the seller pressure. The signal has now moved into negative territory, meaning the structure has turned bearish again.
At the May 6 peak, when BTC touched the $81,500-$82,500 zone, the composite signal reached +0.75. The position in the Donchian channel was close to 1.0, while the EMA trend was at +0.999. This was an overheated structure: price was standing near the upper boundary of the range, and the trend component was almost at its maximum.
After May 11, the structure began to deteriorate quickly. The signal moved below zero, and by May 18 the composite is around -0.55. The momentum signal fell to -0.78, while the price position in the Donchian channel dropped to 0.20. This means BTC is once again pinned to the lower third of the range.
The link between the two charts: Price Structure confirms what the Bull-Bear Index captures on the daily scale. The reversal happened synchronously across two timeframes, and there are still no signs of recovery in either of them.
Stop holding through every crash - start your 7-day free trial. Weekly Engine tells you when to stay in, when to step aside, and when risk is rising.
FAQ
What does it mean that the index failed to hold above zero? In the Bull-Bear Index, zero is the boundary between regimes. If the SLOW version moves above zero and holds there for several days, it means that most components have shifted toward the bulls. When the index quickly returns below zero, it means the market did not confirm that shift with real demand.
Under what condition can the regime become bullish again? The minimum set of conditions: taker imbalance must return to positive territory, ETF flows must recover, and price must stabilize above the 7-day EMA, currently around $79,200. Only with a synchronized improvement in these components will the SLOW line begin moving back toward zero.
CONCLUSIONS
Both indexes show the same picture: the market is back in a bearish structure after the bulls' failed attempt to hold above neutrality on May 6-8.
SLOW Bull-Bear Index dropped to -23.5, Price Structure Composite declined to -0.56, and price position in the Donchian channel compressed into the lower third of the range. This is a synchronized deterioration of structure on both the daily and hourly scale.
The current regime is risk-off. Seller pressure remains both at the derivatives level, through funding and OI, and at the level of price itself. The main trigger for a regime shift is taker imbalance returning to positive territory alongside price recovering above the 7-day EMA. The main risk is continued bearish pressure in the absence of ETF buying and with price remaining near the lower boundary of the channel.
Further Reading