
🎧 Morning Brief #170 - audio debate on today’s market setup
Price is stuck between the realized cost basis level of short-term holders and the 200D SMA, and every bounce meets the same reaction: STH are using strength to exit, preventing the market from moving higher. Together, the two charts show not just technical resistance, but a behavioral trap.
TL;DR
Bitcoin approached the $82K zone three times and pulled back three times: STH-SOPR shows that short-term holders are using every rally to exit, confirming structural overhead pressure. Until price secures a move above the 200D SMA and STH SOPR holds above 1.0, the rally remains without fuel.
Bitcoin Support and Resistance
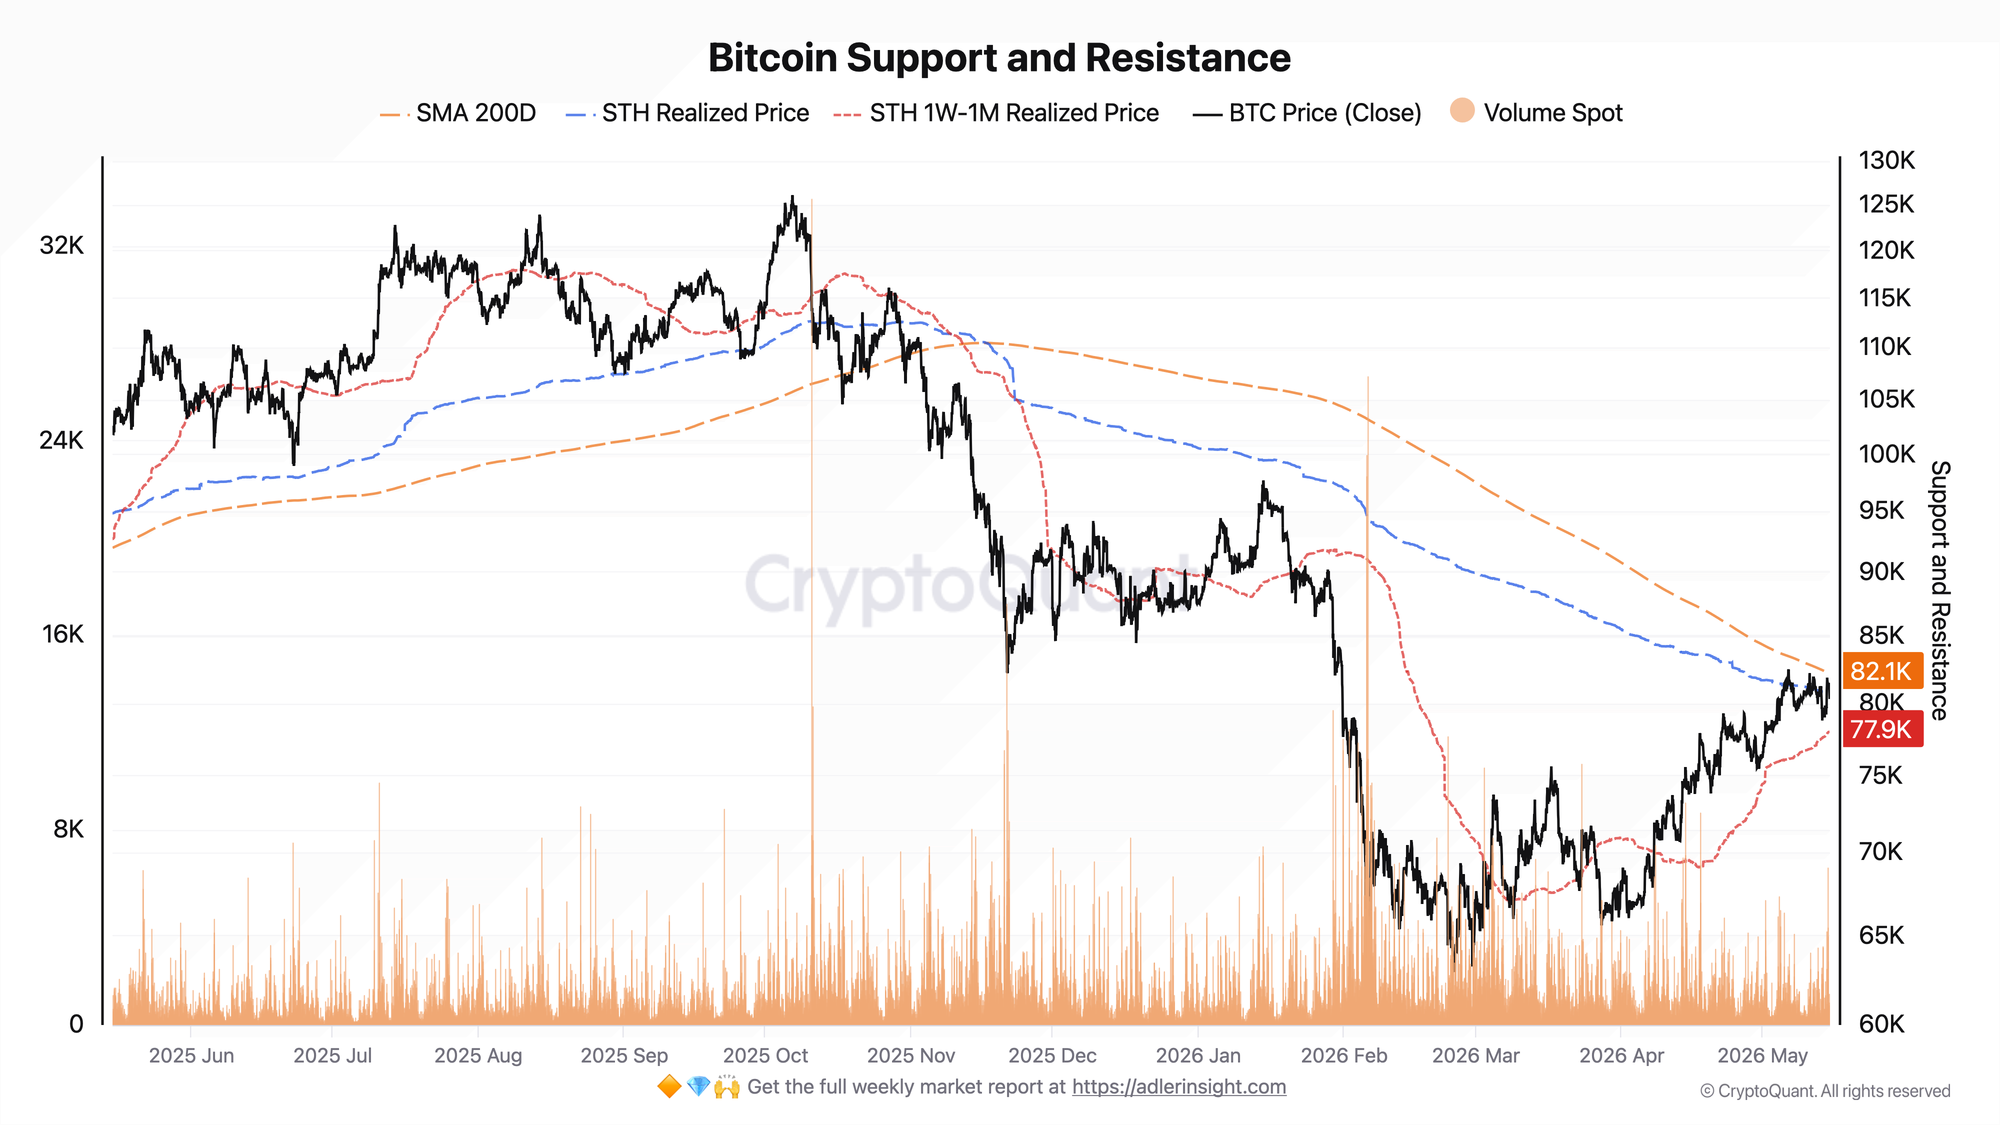
Price is trading in a narrow corridor, with the STH 1W-1M Realized Price at $77.9K acting as support below, and the 200D SMA at $82.1K acting as resistance above. Inside the range, the STH Realized Price zone adds to the density of resistance. Since April 2026, the market has tried three times to break through the upper boundary of this zone, and all three attempts ended in a pullback. Volume does not show abnormal spikes during these moves, which points to a lack of aggressive demand.
As long as price remains below $82.1K, the resistance structure stays intact. Confirmation of a regime change would require a confident daily close above the 200D SMA alongside rising volume. Without that, every bounce remains a candidate for selling.
Bitcoin Short Term Holder SOPR
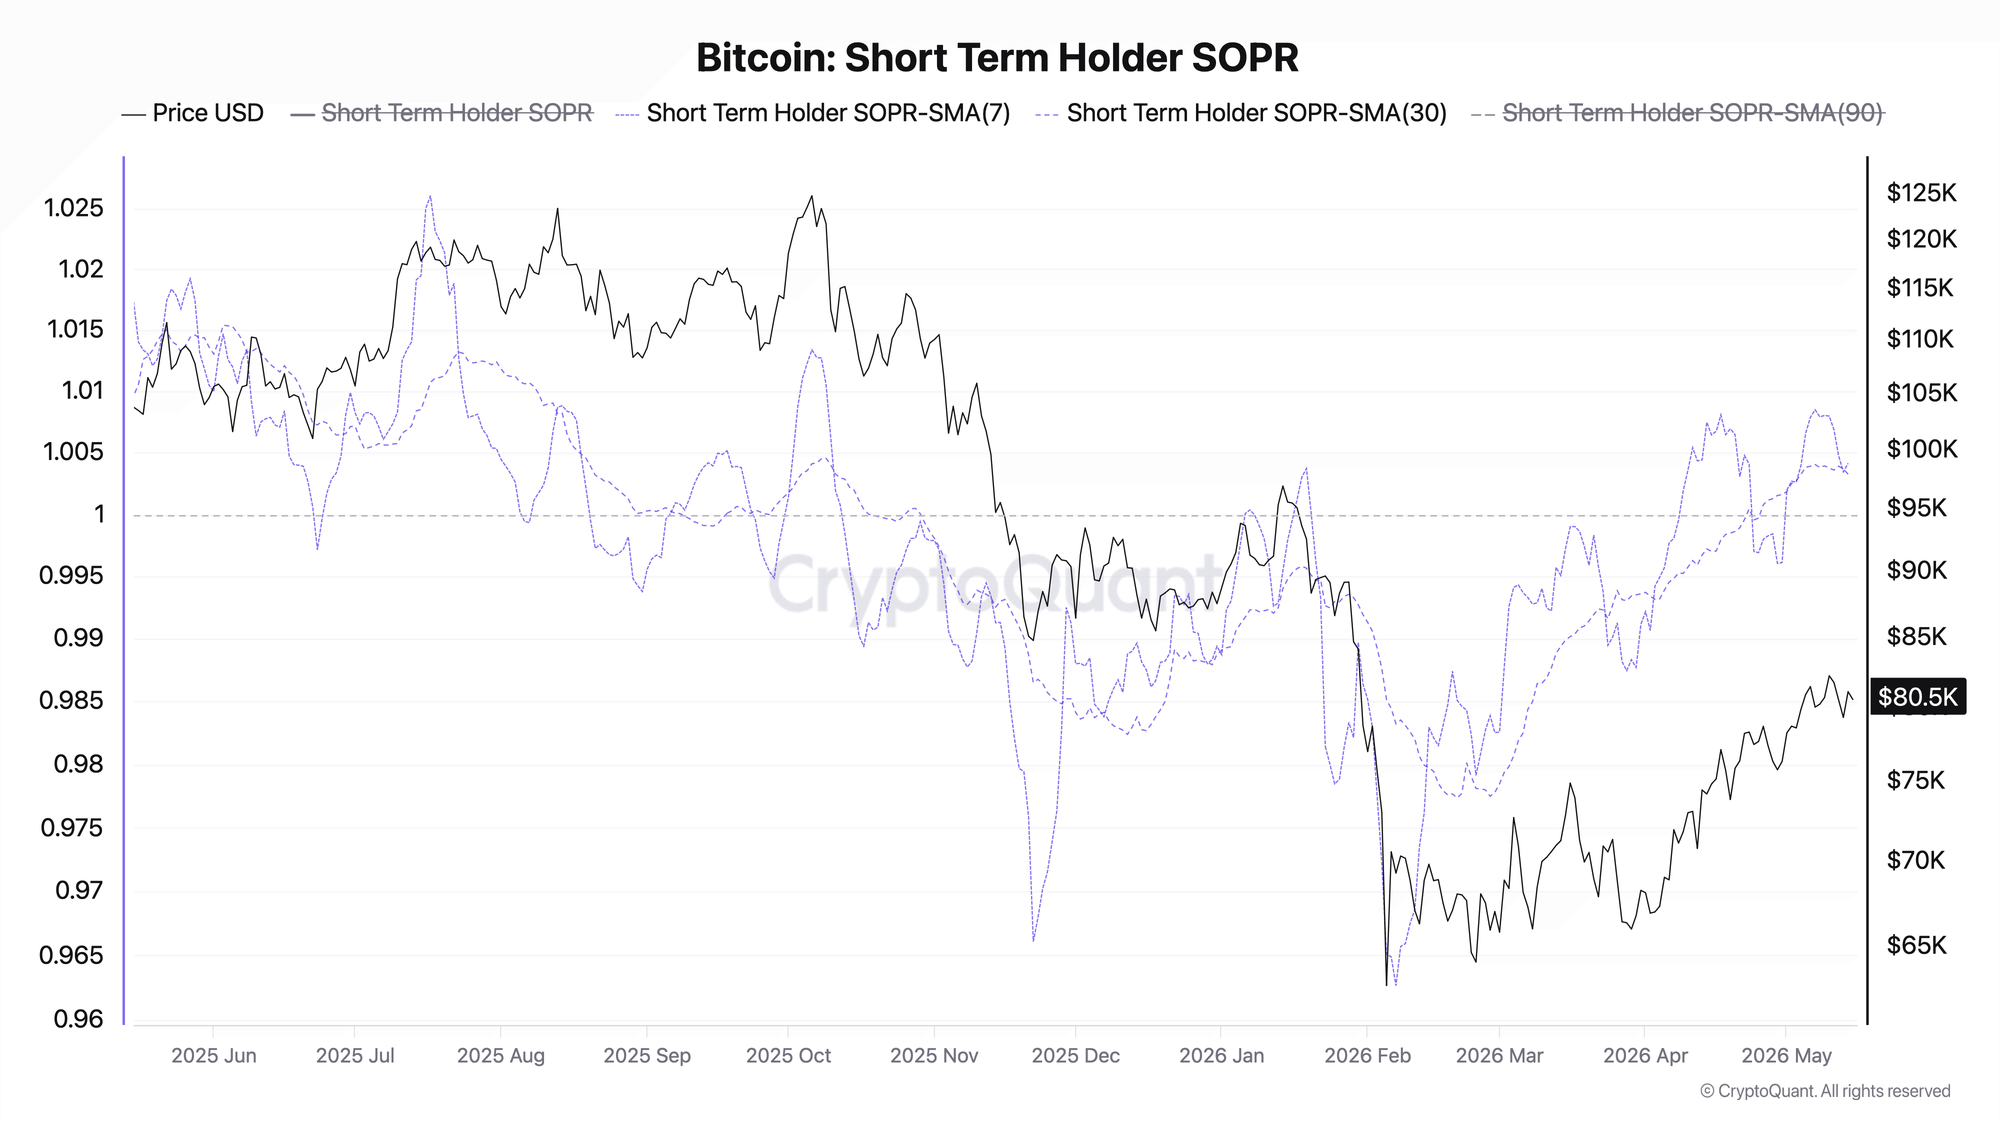
STH SOPR has recovered from the extreme lows of February 2026, but still has not managed to hold sustainably above the 1.0 level. The current SMA(7) and SMA(30) values are hovering near that boundary, and the same pattern keeps repeating: every time price attempts to rise, SOPR briefly moves up toward 1.0, then quickly falls back again. This means that STH are using rallies to exit rather than holding positions in anticipation of further upside.
This pattern is a sign of a market where supply dominates demand in the break-even zone. A trigger for a shift in sentiment would be a sustained hold of the STH SOPR SMA(7) above 1.0 for several consecutive days.
The link between the charts is direct: each of the three failed breakout attempts on the first chart was accompanied by a move in SOPR toward 1.0 followed by a reversal. This is not a coincidence, but a mechanism. Resistance at $82.1K is being maintained not only technically through the 200D SMA, but also behaviorally - by STH themselves, who use this zone to sell whenever the market tries to move higher.
Reading the signal is not enough - you need to act on it. Weekly Engine turns on-chain data into one clear decision per week, with risk caps and invalidation built in. Start free.
FAQ
Why is the $82.1K level so important? It is the 200D SMA - one of the key long-term trend reference points, which is now acting as the upper boundary of local resistance. The market has already approached this zone three times and failed to hold above it all three times, which makes it the main technical barrier in the current structure.
What needs to happen for a breakout to occur? Two conditions are needed at the same time: price must close confidently above $82.1K on the daily timeframe, and the STH SOPR SMA(7) must hold sustainably above 1.0. That would mean that short-term holders have stopped using rallies to exit and have started holding positions in profit, which would change the structure of seller pressure.
CONCLUSIONS
Both charts describe the same market regime from different angles: price is trapped in a narrow range, while the upper boundary is being defended both technically through the 200D SMA and behaviorally through selling by short-term holders. Three failed breakout attempts are not a random technical pattern, but a recurring market reaction to price strength. The current regime remains neutral with a cautious bias. The main trigger for a change is a sustained close above $82.1K with STH SOPR above 1.0. The main risk is a return to $77.9K after another failed attempt to break resistance, which would open the way for a test of lower support levels.
Further Reading
If you want to go deeper on the metrics behind today's brief:
- Bitcoin STH SOPR: What It Is and How to Use It
- Bitcoin Short-Term Holder Profitability: Break-Even as Bull/Bear Signal
- Bitcoin STH Realized Price: Definition, Formula & Cost Basis Framework
- STH vs LTH Realized Price: Support & Resistance Guide
- Bitcoin Realized Price Bands Explained: Cycle Analysis, Signals, and Historical Examples
Live Chart
Bitcoin STH-SOPR